Barfield Raiborn Kinney Cost Accounting_18 pot
Bạn đang xem bản rút gọn của tài liệu. Xem và tải ngay bản đầy đủ của tài liệu tại đây (677.02 KB, 50 trang )
(ROI) for performance evaluation. The Hazlett Division has just been awarded
a contract for a product that uses a component manufactured by the Andalusia
Division as well as by outside suppliers. Hazlett used a cost figure of $3.80 for
the component when the bid was prepared for the new product. Andalusia
supplied this cost figure in response to Hazlett’s request for the average vari-
able cost of the component.
Andalusia has an active sales force that is continually soliciting new cus-
tomers. Andalusia’s regular selling price for the component Hazlett needs for
the new product is $6.50. Sales of the component are expected to increase.
Andalusia management has the following costs associated with the component:
Standard variable manufacturing cost $3.20
Standard variable selling and distribution cost 0.60
Standard fixed manufacturing cost 1.20
Total $5.00
The two divisions have been unable to agree on a transfer price for the com-
ponent. Corporate management has never established a transfer price because
interdivisional transactions have never occurred. The following suggestions have
been made for the transfer price:
• regular selling price,
• regular selling price less variable selling and distribution expenses,
• standard manufacturing cost plus 15 percent, or
• standard variable manufacturing cost plus 20 percent.
a. Compute each of the suggested transfer prices.
b. Discuss the effect each of the transfer prices might have on the Andalusia
Division management’s attitude toward intracompany business.
c. Is the negotiation of a price between the Hazlett and Andalusia Divisions
a satisfactory method to solve the transfer price problem? Explain your
answer.
d. Should the corporate management of Southeast Products Inc. become in-
volved in this transfer controversy? Explain your answer.
(CMA adapted)
65. (Effect of service department allocations on reporting and evaluation) Shiell
Corporation is a diversified manufacturing company with corporate headquar-
ters in Tampa, Florida. The three operating divisions are the Kennedy Divi-
sion, the Plastic Products Division, and the Outerspace Products Division. Much
of the manufacturing activity of the Kennedy Division is related to work per-
formed for the government space program under negotiated contracts.
Shiell Corporation headquarters provides general administrative support
and computer services to each of the three operating divisions. The computer
services are provided through a computer time-sharing arrangement. The cen-
tral processing unit (CPU) is located in Tampa, and the divisions have remote
terminals that are connected to the CPU by telephone lines. One standard from
the Cost Accounting Standards Board provides that the cost of general ad-
ministration may be allocated to negotiated defense contracts. Further, the stan-
dards provide that, in situations in which computer services are provided by
corporate headquarters, the actual costs (fixed and variable) of operating the
computer department may be allocated to the defense division based on a rea-
sonable measure of computer usage.
The general managers of the three divisions are evaluated based on the
before-tax performance of each division. The November 2000 performance eval-
uation reports (in millions of dollars) for each division are presented below:
Chapter 18 Responsibility Accounting and Transfer Pricing in Decentralized Organizations
851
Plastics Outerspace
Kennedy Products Products
Division Division Division
Sales $23 $15 $55
Cost of goods sold (13) (7) (38)
Gross profit $10 $ 8 $17
Selling and administrative:
Division selling and administration costs $ 5 $ 5 $ 8
Corporate general administration costs 1 — —
Corporate computing 1 — —
Total $ 7 $ 5 $ 8
Profit before taxes $ 3 $ 3 $ 9
Without a charge for computing services, the operating divisions may not make
the most cost-effective use of the Computer Systems Department’s resources.
Outline and discuss a method for charging the operating divisions for use of
computer services that would promote cost consciousness by the operating di-
visions and operating efficiency by the Computer Systems Department.
(CMA adapted)
Part 4 Decision Making
852
66. (Selection of type of transfer pricing) A multiple-division company is considering
the effectiveness of its transfer pricing policies. One of the items under consid-
eration is whether the transfer price should be based on variable production
cost, absorption production cost, or external market price. Describe the circum-
stances in which each of these transfer prices would be most appropriate.
67. (Transfer pricing and performance measurement) Appleby Industries consists
of eight divisions that are evaluated as profit centers. All transfers between di-
visions are made at market price. Precision Regulator is a division of Appleby
that sells approximately 20 percent of its output externally. The remaining 80
percent of the output from Precision Regulator is transferred to other divisions
within Appleby. No other division of Appleby Industries transfers internally
more than 10 percent of its output.
Based on any profit-based measure of performance, Precision Regulator is
the leading division within Appleby Industries. Other divisional managers within
Appleby always find that their performance is compared to that of Precision
Regulator. These managers argue that the transfer pricing situation gives Pre-
cision Regulator a competitive advantage.
a. What factors may contribute to any advantage that the Precision Regula-
tor Division might have over the other divisions?
b. What alternative transfer price or performance measure might be more ap-
propriate in this situation?
68. (Multinational company transfers) The Arizona Instruments Company (AIC) is
considering establishing a division in Ireland to manufacture integrated circuits.
Some of the circuits will be shipped to the United States and incorporated into
the firm’s line of computers. The remaining output from the Ireland division
will be sold in the European Union. AIC plans to operate the Ireland division
as a profit center. Compose a report describing some of the problems related
to transfer pricing that AIC must consider in establishing the Ireland division.
REALITY CHECK
69. A large American corporation participates in a highly competitive industry. To
meet the competition and achieve profit goals, the company has chosen the
decentralized form of organization. Each manager of a decentralized center is
measured on the basis of profit contribution, market penetration, and return
on investment. Failure to meet the objectives established by corporate man-
agement for these measures is not accepted and usually results in demotion
or dismissal of a center manager.
An anonymous survey of managers in the company revealed that the man-
agers felt pressure to compromise their personal ethical standards to achieve
the corporate objectives. For example, certain plant locations felt pressure to
reduce quality control to a level that could not ensure that all unsafe products
would be rejected. Also, sales personnel were encouraged to use questionable
sales tactics to obtain orders, including offering gifts and other incentives to
purchasing agents.
The chief executive officer is disturbed by the survey findings. In her opin-
ion, the company cannot condone such behavior. She concludes that the com-
pany should do something about this problem.
a. Discuss what might be the causes for the ethical problems described.
b. Outline a program that could be instituted by the company to help reduce
the pressures on managers to compromise personal ethical standards in
their work. (CMA adapted)
70. Search the Internet to identify three decentralized companies. Based on the in-
formation you find on each, either determine directly or infer from the infor-
mation given the types of responsibility centers used by these companies. Fur-
ther, determine or speculate about whether the companies use transfer prices
or allocation of costs for intracompany transfers of services. Prepare a report
on your findings and inferences. In cases for which you had to infer, explain
what information or reasoning led you to that inference.
Chapter 18 Responsibility Accounting and Transfer Pricing in Decentralized Organizations
853
19
Measuring Short-Run
Organizational Performance
CHAPTER
LEARNING OBJECTIVES
After completing this chapter, you should be able to answer the following questions:
1
How are performance measures tied to organizational missions and strategies?
2
What roles do performance measurement serve in organizations?
3
What guidelines or criteria apply to the design of performance measures?
4
What are traditional short-term financial performance measures of profit and investment centers?
5
How might the Statement of Cash Flows be useful for performance measurement?
6
How are return on investment and residual income similar? How do they differ?
7
How is economic value added used to measure performance?
8
Why might the use of ROI create suboptimization in investment decisions?
Wachovia
INTRODUCING
he environment in which banks will compete in the
next decade may force them to perform much
more like retailers than like the financial institutions our
parents knew. This means that whether bank managers
and employees are in the service or sales arena, opera-
tions, product management, or channel management, they
will need the skills and behavior of the “best in class” re-
tailers. Banks must harness the power of information to
create a banking experience that is customized to their
target customers. Successful banking in this new millennium
will require focusing on the customer.
Wachovia is a $68.8-billion-asset bank that believes
it has found the formula for success in the new banking
environment. At Wachovia, information drives the develop-
ment and retention of profitable relationships. With dual
headquarters in Winston-Salem and Atlanta, the bank
serves customers in five states: Florida, Georgia, North
Carolina, South Carolina, and Virginia. Overall, the bank
operates 700 “stores” that are complemented by a robust
ATM network.
Wachovia has developed a process called continuous
relationship management (CRM) as a crucial tool in differ-
entiating its services from those of competitors. CRM is
built around the idea that the bank must maintain the very
best intelligence information about its customers. By
wielding this information effectively, Wachovia’s managers
believe they can deliver superior service to their cus-
tomers and generate higher profits than their competitors.
The ability to attract the right new customer is the
next horizon in revenue and earnings growth for banks.
Wachovia has recognized that the key to achieving high
profits is serving the right mix of products to the right cus-
tomers. Accordingly, the company has also developed so-
phisticated information systems to evaluate customer prof-
itability, which, in turn, have led to the development of
systems to profile and target new customers.
Raw information provides no advantage. The way fi-
nancial service companies distinguish themselves is to
competently process, distribute, and use information to
serve customers. At Wachovia, the goal of employees is
to know and understand customers and their cares and
concerns better than any other financial institution.
The information systems of Wachovia demonstrate the latest generation of tools for
managing information and feedback. The two characteristics that differentiate this
generation from preceding generations of systems are the focus on the customer
rather than the bottom line, and the integration of information feeder systems.
The switch in focus from profitability to the customer is somewhat illusory.
Managers of today are no less concerned with profits than managers of other eras;
however, to achieve profitability in the face of global competition, managers rec-
ognize that the single most important variable is to attract and satisfy customers.
Hence, there is high correlation between achieving profitability and effectively serv-
ing the marketplace.
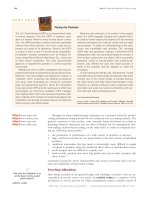
Exhibit 19–1 provides the links between customer types and profitability ef-
fects. Common reasons why some customers are unprofitable are given and the
exhibit demonstrates why customer targeting and screening are so essential to prof-
itably operating businesses.
The ability to integrate information from a set of information systems allows
managers to gain new insights about the value chains in which they are partici-
pants. Like Wachovia, firms are striving to integrate all available information to
identify innovative ways of serving existing customers and attracting new customers.
The overriding goal is to find ways to serve customers that generate acceptable
profits for the investors.
SOURCES
: Wachovia 1998 Annual Report; Beverly B. Wells, “At Wachovia, Customer Focus Means Information-Driven Continuous Relationship Management,”
Journal of Re-
tail Banking Services
(Summer 1999), pp. 33–36.
857
T
One type of information system that is crucial to effectively compete today is
the performance measurement system. This chapter and the next two cover gen-
eral concepts of performance measurement. The focus of this chapter is traditional,
shorter term performance measures; Chapter 20 covers performance measurement
over the longer term and nonfinancial performance measures. Chapter 21 discusses
how and why managerial rewards are linked to organizational performance mea-
sures. The discussion in the following section explains how performance measures
are used in organizations.
Part 5 Evaluating Performance
858
Common Cause Examples
EXHIBIT 19–1
Common Causes of Unprofitable
Customers
1. Large customers demanding low prices
and high levels of service
2. Undifferentiated service with low-sales-
value customers receiving the same
high-cost service as large, high-volume
customers
3. Providing high service levels as a
competitive advantage
4. Overall high-cost sales, administration,
and delivery processes
5. Providing highly customized products/
services
6. High customer turnover
Customer negotiates low price, purchases
lower margin goods and causes high
selling, administration, and delivery costs.
Customer is serviced through costly weekly
sales visits and deliveries. Such customers
will never generate sufficient net margins to
cover these costs.
Management considers its ability to deliver
goods overnight to be a competitive
advantage. Unfortunately the high cost of
delivery makes every order unprofitable.
A company’s sales process is relying on
costly sales visits for all transactions and
customers. There is no use of lower cost
channels, such as call centers or EDI.
Highly customized products are produced
for a small number of small customers.
The cost of obtaining and setting up
customers is high and/or customers
profitability increases over time, e.g.,
insurance and telecommunications.
SOURCE
: Mark Pickering, “Using Customer Profitability Information to Drive the Bottom Line,”
Charter
(March 1999),
pp. 32–34.
ORGANIZATIONAL ROLES OF PERFORMANCE MEASURES
Organizations have reasons or missions for which they exist. In fulfilling organi-
zational missions, managers design and implement strategies that apply organiza-
tional resources to activities. The activities are intended to execute management’s
strategies. Management talent and time are dedicated to planning, decision mak-
ing, controlling, and evaluating performance with respect to these activities. The
intent in these managerial processes is for management to take actions that max-
imize the efficiency and effectiveness of resources used. For an organization to be
successful in its missions, managers must devise appropriate information systems
to track resource applications.
Gauging effective and efficient management of resources is possible only if (1)
the terms effective and efficient can be defined, and (2) measures that are consis-
tent with the definitions can be formulated. Definitions of effective and efficient
could be relative to historical performance, competitors, or expectations. Once de-
fined, effectiveness and efficiency of performance can be assessed by comparing
measures of actual performance with defined performance goals.
How are performance measures
tied to organizational missions
and strategies?
1
Ultimately, performance is assessed to be effective and efficient if sharehold-
ers receive an adequate return on their investment. This places pressure on top
management to achieve returns that are attractive to shareholders. Failing to sat-
isfy shareholders has severe consequences financially and for the reputations of
management teams
1
:
Those companies that are not taking good care of the precious capital they
manage are finding themselves coming under tremendous pressure from pow-
erful institutional investors. If they don’t find a way to generate appropriate re-
turns for investors, they are often forced to sell out to someone that may do a
better job. . . . As we all know investors will cease to provide capital to man-
agement teams that destroy value.
Thus, the need for managers to generate a satisfactory return to shareholders is
the key driver of performance measurement
2
:
Nobody ever said it was easy to track down shareholder value. . . . [but]
shareholder return [is] the single most important measure. . . . the measure most
relevant to the shareholders and most relevant to managers trying to manage
for shareholder value.
Performance measurement provides a foundation for
3
• judging organizational performance,
• relating organizational missions and goals to managerial performance,
• fostering the growth of subordinate managers,
• stimulating managerial motivation,
• enhancing organizational communication,
• making judgments about promotion, and
• implementing organizational control.
By linking performance measures to managerial rewards, managers are given
incentives to concentrate on improving specific performance areas. As the mea-
sured dimensions of performance are improved, managerial rewards are increased.
The linking of management rewards to organizational performance measures creates
the incentive that drives managers to take desired actions.
Performance measures should be devised for all critical resources consumed by
operations. Additionally, the performance measurements should lead to insights about
how to improve resource use and how to achieve organizational changes that allow
firms to remain competitive. The following subsections provide details of performance
measurement information in areas that are critical to survival in the global market.
Information for Evaluating Capital Market Performance
A traditional area of performance measurement relates to the effective and efficient
use of capital resources. This area is the domain of financial accounting. Gener-
ally accepted accounting principles (GAAP) are formulated for providing informa-
tion that is comparable across firms to capital markets and other external users.
This comparability facilitates investor/creditor judgments about which firms are wor-
thy of capital investments. On the other side of the capital equation, to obtain
needed capital at competitive rates, managers must demonstrate to investors that
the managers’ firms offer excellent returns relative to the risks assumed. Absent an
ability to acquire capital at reasonable rates, a firm will stagnate for want of funds
to capitalize on growth opportunities.
Chapter 19 Measuring Short-Run Organizational Performance
859
1
Vincent J. Calabrese, “Economic Value Added: Finance 101 on Steroids,” The Journal of Bank Cost & Management Account-
ing (1999), pp. 3–34.
2
C. Frederic Wiegold, “Quest for Shareholder Value, Ranking America’s Best & Worst Companies,” The Wall Street Journal
(February 26, 1998), p. R1.
3
Adapted from Harry Levinson, “Management by Whose Objectives?” Harvard Business Review (July–August 1970), pp. 125–134.
What roles do performance
measurement serve in
organizations?
2
Another consideration that makes managers focus on capital management is
stockholder influence. Stockholders, acting through their boards of directors, have
the right to determine who will manage their businesses. Naturally, stockholders
are interested in hiring a management team that will maximize the return on the
stockholders’ investment in the firm. Managers are in constant competition to ob-
tain and maintain their positions. Only if managers satisfy the demands of share-
holders will these managers be allowed to maintain their positions, be promoted,
and enhance their personal human capital.
Stockholders achieve returns on their investments through dividends and ap-
preciation in stock prices. Both types of returns depend on the ability of the firm
to generate future earnings. Accordingly, stockholders and other capital providers
are most intensely interested in measures of performance that indicate the ability
of the firm to generate profits
4
:
Part of the battle is fought by trying to prove whose metric best correlates
with changes in stock prices. . . . What matters most is that companies are fo-
cusing on creating shareholder value by rationalizing their businesses, setting
financial hurdles that have to be met before investing in new ventures and at-
tempting to drive the incentives deep into their organizations.
Information for Evaluating Organizational Learning
and Change
The emerging global market has created a pronounced trend in designing perfor-
mance measures. The quality and quantity of firms competing in markets have
placed the consumer at the center of attention, and success in a market depends
on the ability of a firm to satisfy some segment of the market better than can any
rival firm. In recent years, managers, like those at Wachovia, have focused more
attention on assessment of their firms’ performance in serving customers.
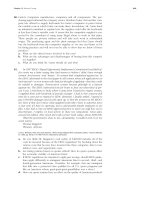
Exhibit 19–2 provides an outline of Wachovia’s profitable relationship opti-
mization system. This is one of the key systems used to exploit customer data in
targeting and delivering services to customers. Steps five and six measure the re-
sults of sales efforts and provide feedback to the participants in the process.
Although the level of profit achieved may be the arbiter’s ultimate measure of
success in serving customers, profit is a very aggregated measure. Other measures
can be developed that give indications of relative success in specific areas of market
performance.
For example, under the forces of global competition, markets are always evolv-
ing as firms constantly search for ways to be innovative in providing customers
with more value at less cost. To compete in this environment, a firm must develop
an organizational culture that fosters learning and innovation. Measures can be used
to track a firm’s performance against customer expectations. Other measures can be
designed to identify waste and assess relative efficiency in resource consumption.
With appropriate measures in place, the focus of managers and workers is on
the success of the firm in serving its customers. As the organization strives to im-
prove its performance, a climate embracing change and organizational evolution
is created. Such a culture is necessary for a firm to be opportunistic and aggres-
sive as it confronts world-class competition. The measures may also provide the
incentive that is necessary to foster cooperation across functional specialties in an
organization. The accompanying News Note describes how Sears has developed
performance measures that managers use to control the company.
Managers develop products and organizational structures to support strategies
that have been devised to serve a firm’s customers. Once these strategies are de-
ployed, measures must be developed to assess the performance of the products
and organizational structure.
Part 5 Evaluating Performance
860
4
Vincent J. Calabrese, “Economic Value Added: Finance 101 on Steroids,” The Journal of Bank Cost & Management Account-
ing (1999), pp. 3–34.
Chapter 19 Measuring Short-Run Organizational Performance
861
EXHIBIT 19–2
Wachovia’s Profitable
Relationship Optimization (PRO)
System
1. PRO begins with Robust Customer
Information.
4. Human, network and brand
resources aligned for
relationship-based selling.
2. Customer information is analyzed.
3. Targeted customer leads
distributed and customers
contacted for relationship-
based dialogue.
5. Results of customer contacts
and market impacts analyzed.
6. Feedback loop enriches
customer file; facilitates
learning.
SOURCE
: Beverly B. Wells, “At Wachovia, Customer Focus Means Information-Driven Continuous Relationship Man-
agement,”
Journal of Retail Banking Services
(Summer 1999), pp. 33–36.
The Bottom Side of Sears
NEWS NOTEGENERAL BUSINESS
In many businesses, it is difficult to measure even rela-
tively hard behaviors like customer retention, and the in-
evitable result is that many companies are unwilling to
expend the time, energy, and resources to do it effec-
tively. Not surprisingly, many companies do not have a
realistic grasp of what their customers and employees
actually think and do.
Sears does. By means of an ongoing process of data
collection, analysis, modeling, and experimentation, we
have developed and continue to refine what we call our
Total Performance Indicators, or TPI—a set of measures
that shows us how well we are doing with customers, em-
ployees, and investors. We understand the several lay-
ers of factors that drive employee attitudes, and we know
how employee attitudes affect employee retention, how
employee retention affects the drivers of customer satis-
faction, how customer satisfaction affects financials, and
a great deal more. We have also calculated the lag time
between a change in any of those metrics and a corre-
sponding change in financial performance, so that when
we see a shift in, say, employee attitudes, we know not
only how but also when it will affect results. Our TPI makes
the employee–customer–profit chain operational be-
cause we manage the company on the basis of these in-
dicators, with remarkably positive results.
SOURCE
: Anthony J. Rucci, Steven P. Kirn, and Richard T. Quinn, “The Em-
ployee–Customer–Profit Chain at Sears,”
Harvard Business Review
(Janu-
ary–February 1998), p. 84.
Information for Evaluating Product/Subunit Performance
A company may place its products in a market to compete on the dimensions of
price, quality, and/or functionality (or product features).
5
Superior performance in any
of these three areas can provide the competitive advantage needed for a firm to
be successful. By developing specific performance measures for each competitive
dimension, alternative ways can be identified to leverage the firm’s competencies.
The organizational structure reflects the manner in which a firm assigns and
coordinates its people in deploying strategies. By subdividing the overall firm, sub-
units can be created and charged with making specific contributions to the busi-
ness. Managers of each subunit can then concentrate on developing the skills and
competencies necessary to satisfy their organizational roles. The extent to which
each subunit succeeds in its mission can be assessed using carefully designed per-
formance measures. Such measures must be tailored to capture the important per-
formance dimensions of each subunit.
Part 5 Evaluating Performance
862
5
For more details, see Robin Cooper, When Lean Enterprises Collide (Boston: Harvard Business School Press, 1995).
DESIGNING A SYSTEM OF PERFORMANCE MEASUREMENT
Through the linking of performance measures to a reward structure, managers are
given an incentive to improve their segment’s performance. Once this incentive is
created, it will work to advance the organization toward its established missions,
or it will cause managers to act in manners contrary to the missions. The outcome
depends largely on how well performance measures have been designed to cap-
ture the performance dimensions that are critical to accomplishing the organiza-
tion’s missions. Exhibit 19–3 identifies warning signs of performance measures that
are flawed.
Each manager in a firm is expected to make a particular contribution to the
organization. This concept was introduced in Chapter 18 in discussions of re-
sponsibility centers and responsibility accounting. The performance measurements
selected must be appropriate for the type of responsibility assigned and the type
of behavior desired. The point that performance measures are created to cause
managers to act cannot be overemphasized. The critical question to address in eval-
uating a performance evaluation measure is: What managerial actions will this per-
formance measure encourage? This section discusses important issues to be con-
sidered in designing a system of performance measurement.
Selecting Performance Measures
To evaluate performance benchmarks must be established against which accom-
plishments can be measured. A benchmark can be a monetary one (such as a stan-
dard cost or a budget appropriation) or a nonmonetary one (such as zero defects
What guidelines or criteria apply
to the design of performance
measures?
3
■
Performance is acceptable in all dimensions except profit.
■
Customers don’t buy even when prices are competitive.
■
No one notices when performance measurement reports aren’t produced.
■
Managers spend significant time debating the meaning of the measures.
■
Share price is lethargic despite solid financial performance.
■
You haven’t changed your measures in a long time.
■
You’ve recently changed your corporate strategy.
SOURCE
: Michael R. Vitale and Sarah C. Mavrinac, “How Effective Is Your Performance Measurement System?”
Man-
agement Accounting
(August 1995), pp. 43–47. Reprinted from
Management Accounting
. Copyright by Institute of
Management Accountants, Montvale, N.J.
EXHIBIT 19–3
Seven Warning Signs of
Problems with Performance
Measures
or the market share of another organization). Regardless of the specific measures
used (whether monetary or nonmonetary), four general criteria should be consid-
ered in designing a performance measurement system:
1. The measures should be established to assess progress toward organizational
goals and objectives.
2. The persons being evaluated should be aware of the measurements to be used
and have had some input in developing them.
3. The persons being evaluated should have the appropriate skills, equipment,
information, and authority to be successful under the measurement system.
4. Feedback of accomplishment should be provided in a timely and useful manner.
One key to designing an effective system of performance measurement is to
recognize that no single performance measure is capable of capturing all of the
important dimensions of performance.
Multiple Performance Measures
The first criterion establishes the reason for using multiple performance measures
rather than a single measure or measures of only a single type. Organizations have
a variety of operational objectives. A primary objective is to be financially viable.
If the organization is a profit-oriented one, this objective is satisfied by generating
a net income considered by the owners to be satisfactory relative to the assets in-
vested. That level of “satisfactory” earnings may change over time or differ based
on the type of business or subunit mission. Therefore, financial performance mea-
sures must be relevant for the type of company or organizational subunit being
evaluated. Also, any financial measures chosen must reflect an understanding of
accounting information and its potential for manipulation.
In addition to financial success, many companies are now establishing opera-
tional targets of total customer satisfaction, zero defects, minimal lead time to mar-
ket, and social responsibility for the environment. These goals cannot be defined
directly using traditional, financial terms. Even though poor or excellent perfor-
mance in these areas will eventually be reflected in financial measures, alternative
short-term performance measures are needed to capture the nonfinancial dimen-
sions of performance. Nonfinancial performance measures can be developed that
indicate progress—or lack thereof—toward the achievement of these important crit-
ical success factors of a world-class company.
The current trend is to apply the concept of the balanced scorecard to per-
formance measurement.
6
A balanced scorecard is an approach to performance
measurement that weighs performance measures from four perspectives. The first
is the traditional perspective: financial performance. The other three include an in-
ternal business perspective, a customer perspective, and innovation and learning.
Managers choosing to apply the balanced scorecard are demonstrating a belief that
traditional financial performance measures alone are insufficient to assess how the
firm is doing and what specific actions must be taken to improve performance. A
balanced scorecard is illustrated in Exhibit 19–4 for a company in the semiconductor
business.
As discussed in the News Note on page 865, the keys to successfully imple-
menting a balanced scorecard in a technology company are to know what to mea-
sure and to not measure everything.
Awareness of and Participation in Performance Measures
Regardless of the number or types of measures chosen, top management must set
high performance standards and communicate them to lower-level managers and
Chapter 19 Measuring Short-Run Organizational Performance
863
6
The balanced scorecard was created by Robert Kaplan, Harvard University, and David Norton, Renaissance Strategy Group.
balanced scorecard
employees. Additionally, the measures should promote harmonious operations
among organizational units. This factor is important to minimize the effects of
suboptimization (as discussed in Chapter 18) that might occur in a decentralized
company.
People will normally act specifically in accordance with how they are to be
measured. Thus, the individuals must know of and understand the performance
measures used, so that managers can make decisions in light of the effects of al-
ternative decisions on the performance measures. Withholding information about
Part 5 Evaluating Performance
864
EXHIBIT 19–4
The Balanced Scorecard for a
Semiconductor Firm
Cash flow
Quarterly sales growth and
operating income by division
Increased market share and
return on equity (or investment)
Survive
Succeed
Prosper
FINANCIAL PERSPECTIVE
Measures
How do we look to
our shareholders?
Can we continue to
improve and create value?
At what must we excel?How do customers see us?
Goals
Percent of sales from new
products
Percent of sales from
proprietary products
On-time delivery
(defined by customer)
Share of key accounts’
purchases
Number of cooperative
engineering efforts
New
products
Responsive
supply
Preferred
supplier
Customer
partnership
CUSTOMER PERSPECTIVE
MeasuresGoals
Technology
leadership
Manufacturing
learning
Product focus
Time to market
INNOVATION AND LEARNING PERSPECTIVE
Goals
Time to develop next
generation
Process time to maturity
Percent of products that
equals 80% of sales
New product introduction
versus competition
Measures
Manufacturing geometry
versus competition
Cycle time
Unit cost
Yield
Silicon efficiency
Engineering efficiency
Actual introduction
schedule versus plan
Technology
capability
Manufacturing
excellence
Design
productivity
New product
introduction
INTERNAL BUSINESS PERSPECTIVE
MeasuresGoals
SOURCE
: Reprinted by permission of
Harvard Business Review
. An excerpt from “The Balanced Scorecard–Measures that Drive Performance,” by Robert S. Kaplan
and David P. Norton (January-February 1992), pp. 72, 76. Copyright © 1992 by the President and Fellows of Harvard College; all rights reserved.
measures will not allow employees to perform at their highest level, which is frus-
trating for them and does not foster feelings of mutual respect and cooperation.
To illustrate, assume your teacher said, “Turn in the answer to Problem 7 and
it will be graded.” You work the problem and turn in only the answer, as re-
quested. Your homework is returned and you receive two points out of a possi-
ble ten because the teacher’s grading key assigned points to supporting computa-
tions of the final answer. Do you believe your performance has been properly
measured? Had you known that supporting computations were to be counted, and
you chose not to turn them in, would your performance have been properly mea-
sured? Thus, proper measurement is influenced by proper information about what
is expected.
If actual-to-standard or actual-to-budget comparisons are to be used as per-
formance measures, people are more likely to be committed to the process if they
participated in setting the standards or the budget. Participation captures the in-
terest and attention of those persons involved and results in a “social contract” be-
tween participants and evaluators. This allows individuals to demonstrate a mutual
respect for each other’s ability to contribute effectively to the development process.
The participants who will be evaluated understand and accept the reasonableness
of the standards or budget and generally attempt to achieve the results to affirm
that the plans were well founded. Employee involvement in a performance mea-
surement system is so important that “management attempts to bolster productivity
will plateau without employee support, which is the key to achieving maximum
productivity.”
7
Appropriate Tools for Performance
Anyone who has accepted a job understands that there will be a performance mea-
surement and evaluation process. For performance measures to be fair, placement
personnel must first put the right individuals in the available jobs. If candidates
placed in jobs do not have the appropriate skills, they are usually destined to fail.
Thus, the organization is responsible for making certain that either job skills exist
or can be obtained through available training.
Chapter 19 Measuring Short-Run Organizational Performance
865
Putting Balance into the Scorecard
NEWS NOTEGENERAL BUSINESS
The balanced scorecard divides business strategy into
four perspectives: Financial, Customer, Internal and
Learning. Each perspective breaks down into tactics and
measures, although you must take care to link tactics and
measure across all four perspectives. The result is a sim-
ple set of metrics describing how well information tech-
nology (IT) accomplishments are supporting the business
strategy.
Clearly, some effort is necessary to create, fine-tune
and execute a balanced scorecard. It is especially im-
portant to avoid the impulse to measure everything. Only
a small number of metrics is necessary. Informing your
business managers isn’t the only benefit of using a bal-
anced scorecard. For example, according to John Hen-
drick, industry benchmarking director for AT&T, the com-
pany’s $5 billion IT organization uses about 50 distinct
metrics, only five of which are regularly reviewed at the
executive level. More important, all AT&T business units
use the same five top-level metrics, making easier com-
parisons of how each unit, including IT, is contributing to
the business.
SOURCE
: Phillip Gordon, “What Is the Balanced Scorecard?”
InformationWeek
(October 18, 1999), p. 76.
7
Dan J. Seidner and Glenn Kieckhaefer, “Using Performance Measurement Systems to Create Gainsharing Programs,” (Grant
Thornton) Manufacturing Issues (Summer 1990), p. 8.
Given job competence, people must then be given the necessary tools (equip-
ment, information, and authority) to perform their jobs in a manner consistent with
the measurement process. No matter where an employee is in the organizational
hierarchy, each job has certain requirements. A carpenter must have a saw and a
drawing or idea of the product to be made; an accountant must have transaction
information and/or source documents and a manual or electronic means by which
to capture monetary changes; the company president must have the authority to
obtain the needed resources to accomplish organizational objectives. Competent
individuals having the necessary job “tools” can be held responsible for their per-
formance. If the appropriate tools are unavailable, people cannot be presumed to
be able to accomplish their tasks.
In decentralized firms, upper-level managers have little opportunity to observe
the actions of subordinates. These managers are able to observe the outcomes as
captured by performance measures. This fact makes it imperative that the perfor-
mance measures selected be (1) highly correlated with the subunit mission, (2) fair
and complete reflections of the subunit manager’s performance, and (3) measuring
performance that is under the subunit manager’s control.
Need for Feedback
Managerial performance should be monitored (though not evaluated) on a con-
tinuous basis, and feedback should be provided to the appropriate individuals.
Thus, performance monitoring and feedback should be ongoing activities, whereas
performance evaluation should be scheduled for specified points in time. Positive
feedback serves to motivate employees to future success by encouraging continu-
ation of favorable behaviors. Employees receiving negative feedback are made
aware of problems and can attempt to change behaviors. Waiting to provide feed-
back on performance until some “measurement date” is reached allows employ-
ees no opportunity for early adjustment. As indicated by the survey data presented
in Exhibit 19–5, some employees do not believe that the feedback they are re-
ceiving is of the highest quality.
Performance measurement has typically relied on information generated from
the cost management system during the management control process. Exhibit 19–6
provides a diagram of the basic management control process and indicates the
point at which performance has traditionally been evaluated. Although this type of
measurement system was easy to implement, it often focused on performance traits
that were not the most conducive to sound, competitive positions. Because of this,
traditional performance measures are being supplemented with additional ones.
Part 5 Evaluating Performance
866
TRADITIONAL SHORT-TERM FINANCIAL PERFORMANCE MEASURES
The traditional focus of performance evaluation at the managerial level is on the
financial aspects of operations and concentrates on monetary measures such as di-
visional profits, achievement of budget objectives, individual and total variances
from budget or standard, and cash flow. Each of these measures provides differ-
ent information that can be used to analyze the effectiveness and efficiency of man-
agerial performances.
The type of responsibility center being evaluated affects the performance mea-
sure(s) used because managers should be evaluated using only performance mea-
sures relating to their authority and responsibility. In a cost center, the primary
financial performance measure is the materiality of the variances from budgeted or
standard costs. Performance in a pure revenue center can be primarily judged by
comparing budgeted revenues with actual revenues. These two responsibility cen-
ters are accountable for only one type of monetary object: costs and revenues, re-
spectively. When a manager is responsible for only one monetary item, the financial
What are traditional short-term
financial performance measures
of profit and investment centers?
4
Chapter 19 Measuring Short-Run Organizational Performance
867
EXHIBIT 19–5
Feedback and Performance
Measurement
Strongly
disagree
Disagree Agree Strongly
agree
I receive adequate feedback on my performance.
Promotions are based on employee performance.
Performance is evaluated regularly.
Managers communicate openly and honestly.
Performance reviews are fair.
My supervisor provides feedback on performance.
The feedback I receive is balanced — negative and positive.
Negative feedback expressed in our organization addresses
the problem, not the person.
Regular feedback is the ultimate tool for shaping workers’ performance, yet few
employees feel their managers give it. Nor do workers really believe that performance
leads to promotion, according to a survey of more than 1,000 employees in 15 small,
midwestern companies. None of the following statements managed to earn a full
“agree” rating–a dismal comment on the quality of employee feedback. (The shaded
area represents the average response.)
SOURCE
: Ross Culbert Lavery and Russman Inc. (New York), compiled from company organizational audits, Perz
Inc., Maumee, Ohio, 1992; presented in
Inc.
(September 1992), p. 32. Reprinted with permission of
Inc.
magazine.
© 1992 by Goldhirsh Group, Inc.
EXHIBIT 19–6
Diagram of Management Control
Process
Traditional
Focus of
Performance
Measurement
Execution
Feedback
and
Corrective
Action
Planning
What is desired to
take place?
Developing Programs:
• Objectives
• Policies
• Plans
Developing Tools:
• Organization
• Systems
• Procedures
• Methods
• Standards
• Budgets
Control
What should and did
take place?
Means of Control:
• Responsibility
accounting
• Cost accounting
• Standards
• Budgets
Evaluation of Findings:
• Performance and
control reports
• Exception reporting
• Variance analysis
SOURCE
: Patrick L. Romano, “Performance Measurement and Planning–Revisited,”
Management Accounting
(January 1989), p. 62. Reprinted from
Management
Accounting
. Copyright by Institute of Management Accountants, Montvale, N.J. Permission conveyed through the Copyright Clearance Center.
measurements appropriate for performance evaluations are limited to those rele-
vant to that single monetary item. However, nonmonetary performance measures
are now being coupled with monetary measures in balanced scorecards to provide
multidimensional views of responsibility center performance.
Profit and investment center managers are responsible for both the revenues
and expenses of those centers. Given this greater accountability, more financial
performance measures can be used for these responsibility centers than the rather
simplistic ones used by cost and revenue centers.
Divisional Profits
The segment margin of a profit or investment center is a frequently used measure
of divisional performance.
8
This amount is compared with the center’s budgeted
income objective, and variances are computed to determine where objectives were
exceeded or were not achieved.
One problem with the use of segment margin for measuring performance is that
the individual components used to derive it (like any other accounting income-
based amount) are subject to manipulation. Segment margin manipulation can take
many forms, for example:
• If the center is using a cost flow method other than FIFO, inventory purchases
can be accelerated or deferred at the end of the period to change the Cost of
Goods Sold amount for the period.
• Replacement of workers who have resigned or been terminated can be deferred
to minimize salary expense for the period.
• Routine maintenance can be delayed or eliminated to reduce expenses.
• If actual overhead is being allocated to inventory, production can be increased
so that cost per unit declines.
• Sales recognition can be shifted between periods.
• Advertising expenses or other discretionary costs can be delayed or accelerated.
• Depreciation methods may be changed.
These tactics can be used to “cause” reported segment margin to conform to budget
expectations, but such manipulations are normally not in the center’s long-run best
interest.
Divisional segment margin (or profit) represents a short-term, rather than a
long-term, objective. Most reward systems (promotions, pay raises, bonuses) are
based on short-term performance. Although short-run efficiency is important, com-
panies should not use the quarterly or annual segment margin as the only perfor-
mance measure of a profit or investment center’s manager. A year is often too short
a time over which to judge managerial performance. The performance measure-
ment period should coincide with the time it takes to evaluate the quality of the
center manager’s decisions.
9
Similarly, the performance measures should be matched
to the subunit’s mission. Short-term measures are more appropriate for hold and
harvest missions and less appropriate for build missions.
Cash Flow
Managers who have authority over operating, investing, and financing activities
know that for their entities to succeed, two requirements must be met: (1) long-run
Part 5 Evaluating Performance
868
8
The term segment margin is defined in Chapter 12 as segment sales minus (direct variable expenses and avoidable fixed ex-
penses). Thus, the margin would not include allocated common costs.
9
Quality and financial benefits to the organization should be measured concurrently. The accounting system should be de-
signed to capture both types of information (qualitative and quantitative) that can be used as valid predictors of long-term
profitability. See Sue Y. Whitt and Jerry D. Whitt, “What Professional Services Firms Can Learn from Manufacturing,” Manage-
ment Accounting (November 1988), pp. 39–42.
How might the Statement of
Cash Flows be useful for
performance measurement?
5
profitability and (2) continuous liquidity. Because external financial statements use
accrual-based figures, management’s attention can become diverted from the size
and direction of cash inflows and outflows. The Statement of Cash Flows (SCF)
helps to correct this situation by providing information about the cash impacts of
the three major categories of business activities (operating, investing, and financ-
ing). The SCF explains the change in the cash balance by reflecting the entity’s
sources and uses of cash. Such knowledge can assist in judging the entity’s abil-
ity to meet current fixed cash outflow commitments, to adapt to adverse changes
in business conditions, and to undertake new commitments. Further, because the
cash flow statement identifies the relationships between segment margin (or net
income) and net cash flow from operations, the SCF assists managers in judging
the quality of the entity’s earnings.
Although the cash budget presented in Chapter 13 is essential to current cash
management, the budgeted SCF gives managers a more global view of cash flows
by arranging them by major activity. Such an arrangement permits management to
judge whether the anticipated flows are consistent with the entity’s strategic plans
and, thus, provides an opportunity to evaluate performance. In addition, the cash
budget disregards significant noncash transactions that are incorporated into a
schedule or narrative on a Statement of Cash Flows. Because most noncash trans-
actions will ultimately result in cash flows, disclosure of noncash transactions pro-
vides a more complete picture of future operations and their potential effect on
cash availability. Analysis of the SCF in conjunction with budgets and other finan-
cial reports provides information on cost reductions, collection policies, dividend
payout, impact of capital projects on total cash flows, and liquidity position.
Like segment margins and income, cash flow can be manipulated and relates
to the short run rather than the long run. As a measure of performance, cash flow
suffers from some of the same problems as divisional profits because managers
can defer purchases of inventory and equipment or misassign collections to a pe-
riod to enhance the appearance of cash flow. But adequate cash flow is a neces-
sity for conducting business activities. Inadequate cash flow may reflect poor judg-
ment and decision making on the part of the profit or investment center manager.
Many useful financial ratios (such as the current ratio, quick ratio, and number of
days’ collections in accounts receivable) involve cash flow available to assist man-
agers in the effective conduct of their functions. Three other financial measures of-
ten used to evaluate divisional performance in an investment center are return on
investment, residual income, and economic value added.
Return on Investment
The difference between a profit center and an investment center is that the in-
vestment center manager also has responsibility for assets under the center’s con-
trol. Giving the manager responsibility for acquisition, use, and disposal of assets
increases the number of financial performance measures available because another
dimension of accountability is added. Return on investment (ROI) is a ratio
relating income generated by the investment center to the resources (or the asset
base) used to produce that income. The return on investment formula is
ROI ϭ Income Ϭ Assets Invested
Before ROI can be used effectively, both terms in the formula must be specifically
defined. To do this, Exhibit 19–7 asks and answers several definitional questions
about this ratio. Once definitions have been assigned to the terms, ROI can be
used to evaluate individual investment centers as well as to make intracompany,
intercompany, and multinational comparisons. However, managers making these
comparisons must consider differences in the entities’ characteristics and account-
ing methods.
Chapter 19 Measuring Short-Run Organizational Performance
869
How are return on investment
and residual income similar?
How do they differ?
return on investment
6
Using segment margin rather than operating income is preferred in the ROI
calculation because the investment center manager does not have control in the
short run over unavoidable fixed expenses and allocated corporate costs. Therefore,
unavoidable fixed expenses and allocated corporate costs should not be a part of
the performance evaluation criteria.
10
The same logic applies to the exclusion of
taxes (or corporate interest) in determining investment center income. Company
tax rates are determined based on total company income. Investment centers might
pay higher or lower rates if they were separate taxable entities.
Investment center managers may have a substantial number of assets that are
not being used. Eliminating these assets from the ROI denominator provides no
encouragement for the manager to dispose of duplicate or unnecessary assets. Thus,
total assets available for use is preferable to total assets utilized. Disposition of idle
assets will provide the manager with additional cash flow that could be used for
alternative projects. In contrast, if the objective is to measure how well the seg-
ment is performing, given the funds stockholders have provided for that segment,
then net assets should be used to measure return on equity funds.
Use of the original cost of plant assets is more appropriate than net book value
when determining the amount of assets invested. As assets age and net book value
declines, an investment center earning the same income each year would show a
continuously increasing return on investment solely because of the diminishing
asset base. Such false impressions of increasing returns could cause erroneous
assessments of a manager’s performance. The use of current plant asset values is,
however, preferable to original costs. Current values measure the opportunity cost
of using the assets. Such values, though, are more difficult to obtain and may be
determined only by very subjective methods.
Regardless of which plant asset base is chosen for the ROI denominator, that
value should be a periodic average. Because income is earned over a period rather
than at a specific point in time, the averaging period for the denominator should
be the same as that used to determine the ROI numerator.
Data for Southwest Real Estate (Exhibit 19–8) are used to illustrate return on
investment computations. The company has divisions in Dallas, Houston, and San
Antonio. All are operated as separate investment centers. All three divisions oper-
ate in the same industry and offer the same types of services to their customers.
Part 5 Evaluating Performance
870
Question Preferable Answer
Is income defined as segment or operating income? Segment income
Is income on a before- or after-tax basis? Before-tax
Should assets be defined as
■
total assets utilized;
■
total assets available for use; or
■
net assets (equity)? Total assets available for use
Should plant assets be included at
■
original cost;
■
depreciated book value; or
■
current value? Current value
Should beginning, ending, or average assets be used? Average assets
EXHIBIT 19–7
ROI Definitional Questions and
Answers
10
When assets and costs cannot be directly traced and must be allocated to an investment center, ROI calculations may not
carry the same credibility as when allocations are not necessary. ROI calculations for an entire company or its autonomous,
free-standing divisions are easier to make and are more meaningful than ROI calculations for units requiring such allocations.
Criticism of ROI comparisons may also arise when such comparisons are made among divisions of very unequal sizes or at
different stages of growth and product development.
Also, each division is charged with a hold mission. The similarity in mission and
business line allows comparisons to be made among the three investment centers.
Return on investment computations (using a variety of bases) for Southwest
Real Estate divisions are shown in Exhibit 19–9. This exhibit illustrates that ROI
figures differ dramatically depending on the definitions used for the formula
terms. Therefore, how the numerator and denominator in the ROI computation
are to be determined must be precisely specified before making computations
or comparisons.
The ROI formula can be restated to provide useful information about individ-
ual factors that compose the rate of return. This restatement indicates that ROI is
affected by both profit margin and asset turnover. Profit margin is the ratio of in-
come to sales and indicates what proportion of each sales dollar is not used for
expenses and, thus, becomes profit. Asset turnover measures asset productivity
and shows the number of sales dollars generated by each dollar of assets. The re-
statement of the ROI formula is referred to as the Du Pont model and is
ROI ϭ Profit Margin ϫ Asset Turnover
ϭ (Income Ϭ Sales) ϫ (Sales Ϭ Assets)
As with the original ROI formula, terms in the restated formula must be
specifically defined before the formula is usable for comparative or evaluative
purposes. The Du Pont model provides refined information about an investment
center’s opportunities for improvement. Profit margin can be used to judge the
center’s operating leverage by indicating management’s efficiency with regard to
the relationship between sales and expenses. Asset turnover can be used to
Chapter 19 Measuring Short-Run Organizational Performance
871
IN THOUSANDS
Dallas Houston San Antonio Total
Revenues $1,600,000 $ 337,500 $215,000 $2,152,500
Direct costs:
Variable (560,000) (155,250) (86,000) (801,250)
Fixed (avoidable) (275,000) (58,750) (30,000) (363,750)
Segment margin $ 765,000 $ 123,500 $ 99,000 $ 987,500
Unavoidable fixed
and allocated costs (186,000) (39,000) (25,000) (250,000)
Operating income $ 579,000 $ 84,500 $ 74,000 $ 737,500
Taxes (34%) (196,860) (28,730) (25,160) (250,750)
Net income $ 382,140 $ 55,770 $ 48,840 $ 486,750
Current assets $ 24,250 $ 16,560 $ 10,000
Fixed assets 3,089,500 2,305,000 450,000
Total asset cost $3,113,750 $2,321,560 $460,000
Accumulated
depreciation (616,250) (635,000) (31,250)
Asset book value $2,497,500 $1,686,560 $428,750
Liabilities (1,065,000) (300,000) (81,250)
Net assets $1,432,500 $1,386,560 $347,500
Proportion of total
assets utilized 100% 93% 85%
Current value of
fixed assets $2,750,000 $1,200,000 $390,000
NOTE
: A summarized corporate balance sheet would not balance with the investment center balance sheets because
of the existence of general corporate assets and liabilities.
EXHIBIT 19–8
Data for Southwest Real Estate
profit margin
asset turnover
Du Pont model
judge marketing leverage with regard to the effectiveness of asset use relative
to revenue production.
Calculations showing the ROI components using the Southwest Real Estate in-
formation are given in Exhibit 19–10 and use segment margin and total historical
cost asset valuation as the income and asset base definitions. Thus, these compu-
tations provide the same answers as those given in the third calculation of Exhibit
19–9.
The calculations indicate that the Houston investment center is performing very
poorly relative to the other two divisions. Its performance trails for both profit mar-
gin and asset turnover measures. Based on the amount of accumulated depreciation,
the Houston investment center appears to be the oldest, which may be related to its
Part 5 Evaluating Performance
872
Dallas Houston San Antonio
Operating Income $579,000 $84,500 $74,000
Assets Utilized $2,497,500 $1,568,501 $364,438
ROI 23.2% 5.4% 20.3%
Operating Income $579,000 $84,500 $74,000
Asset Current Value $2,750,000 $1,200,000 $390,000
ROI 21.1% 7.0% 19.0%
Segment Margin $765,000 $123,500 $99,000
Total Asset Cost $3,113,750 $2,321,560 $460,000
ROI 24.6% 5.3% 21.5%
Segment Margin $765,000 $123,500 $99,000
Asset Book Value $2,497,500 $1,686,560 $428,750
ROI 30.6% 7.3% 23.1%
Segment Margin $765,000 $123,500 $99,000
Asset Current Value $2,750,000 $1,200,000 $390,000
ROI 27.8% 10.3% 25.4%
Segment Margin $765,000 $123,500 $99,000
Net Assets $1,432,500 $1,386,560 $347,500
ROI 53.4% 8.9% 28.5%
EXHIBIT 19–9
ROI Computations
Dallas Investment Center:
ROI ϭ (Income Ϭ Sales) ϫ (Sales Ϭ Assets)
ϭ ($765,000 Ϭ $1,600,000) ϫ ($1,600,000 Ϭ $3,113,750)
ϭ 0.478 ϫ 0.514 ϭ 24.6%
Houston Investment Center:
ROI ϭ (Income Ϭ Sales) ϫ (Sales Ϭ Assets)
ϭ ($123,500 Ϭ $337,500) ϫ ($337,500 Ϭ $2,321,560)
ϭ 0.366 ϫ 0.145 ϭ 5.3%
San Antonio Investment Center:
ROI ϭ (Income Ϭ Sales) ϫ (Sales Ϭ Assets)
ϭ ($99,000 Ϭ $215,000) ϫ ($215,000 Ϭ $460,000)
ϭ 0.460 ϫ 0.467 ϭ 21.5%
NOTE
: For purposes of these computations, income is defined as segment margin and assets are defined as total
asset cost.
EXHIBIT 19–10
ROI Components
poor performance. For age-related reasons or others that cannot be identified from
the data shown, the Houston investment center is generating too little revenue rel-
ative to both the expenses it is incurring and the assets it is employing. Houston’s
manager might consider purchasing more modern facilities to generate more sales
dollars and greater profits. Such an investment could, however, cause ROI to de-
cline, because the asset base would be increased. Rate of return computations can
encourage managers to retain and use old plant assets (especially when accumu-
lated depreciation is excluded from the asset base) to keep ROIs high as long as
those assets are effective in keeping revenues up and expenses down.
Dallas enjoys both the highest profit margin and the highest turnover. It ap-
pears that Dallas may be benefiting from economies of scale relative to the other
divisions, which could partially account for its superior performance. Additionally,
Dallas is better leveraging its assets because they are 100 percent utilized.
The San Antonio investment center appears to be the youngest of the three.
It has a lower level of accumulated depreciation relative to its investment, and it
has a lower level of asset utilization. Even so, it is generating an ROI that is close
to that generated by Dallas. With greater utilization of its assets, the San Antonio
investment center should be able to generate a higher asset turnover and raise its
ROI.
ROI is affected by decisions involving sales prices, volume and mix of prod-
ucts sold, expenses, and capital asset acquisitions and dispositions. Return on in-
vestment can be increased through various management actions including (1) im-
proving profit margins by raising sales prices if doing so will not impair demand,
(2) decreasing expenses, and (3) decreasing dollars invested in assets, especially
if those assets are no longer productive. Action should be taken only after con-
sidering all the interrelationships that determine ROI. A change in one of the com-
ponent elements can affect others. For instance, an increase in price could reduce
sales volume if demand is elastic with respect to price.
Assessments about whether profit margin, asset turnover, and return on in-
vestment are favorable or unfavorable can be made only by comparing actual re-
sults for each component with some valid benchmark. Bases of comparison in-
clude expected results, prior results, or results of other similar entities. Many
companies establish target rates of return either for the company or, alternatively,
for the division based on the industry or market in which that division operates.
Favorable results should generate rewards for investment center managers.
Chapter 19 Measuring Short-Run Organizational Performance
873
When managers are responsible
for their asset investment base,
ROI is often used as a financial
measure of performance. But,
because of its reliance on in-
come, this metric can be manip-
ulated and may not be compa-
rable across divisions.
Unfavorable rates of return should be viewed as managerial opportunities for
improvement. Factors used in the computation should be analyzed for more de-
tailed information. For example, if asset turnover is low, additional calculations can
be made for inventory turnover, accounts receivable turnover, machine capacity
level experienced, and other rate-of-utilization measures. This investigation should
help to indicate to the manager the direction of any problem(s) involved, so that
causes can be determined and adjustments made.
Residual Income
An investment center’s residual income (RI) is the profit earned that exceeds an
amount “charged” for funds committed to the center. The amount charged for funds
is equal to a specified rate of return multiplied by the asset base. Top manage-
ment establishes a target minimum rate of return against which the investment cen-
ter’s ROI can be judged.
11
This target rate is comparable to an imputed rate of in-
terest on the assets used by the division. The rate can be changed from period to
period consistent with market rate fluctuations or to compensate for risk. The resid-
ual income computation is as follows:
Residual Income ϭ Income Ϫ (Target Rate ϫ Asset Base)
The advantage of residual income over return on investment is that residual in-
come yields a dollar figure rather than a percentage. It would always be to a com-
pany’s advantage to obtain new assets if they would earn a dollar amount of re-
turn greater than the dollar amount charged for the additional investment. Expansion
(or additional investments in assets) could occur in an investment center as long
as positive residual income is expected on the additional investment.
Continuing the Southwest Real Estate example, residual income is calculated
for each investment center. Southwest has established 15 percent as the target rate
of return on total assets and has defined income as segment margin. The calcula-
tions are shown in Exhibit 19–11. The Dallas and San Antonio investment centers
show positive residual income, which means that these responsibility centers are
earning above what top management considers a reasonable charge for funds. The
residual income computation for the Houston investment center indicates that in-
come is being significantly underproduced relative to the asset investment. The di-
vision manager should be apprised of the situation so that he or she can take steps
to discover the cause of and correct this unsatisfactory result.
Part 5 Evaluating Performance
874
11
The target rate established for measuring residual income is similar to the discount rate used in capital budgeting (discussed in
Chapter 14). For management to invest in a capital project, that project must earn at least a minimum specified rate of return. In
the same manner, ROI of an investment center must be equal or higher than the target rate used to compute residual income.
Residual Income ϭ Income Ϫ (Target Rate ϫ Asset Base)
Dallas:
$765,000 Ϫ (0.15 ϫ $3,113,750) ϭ $765,000 Ϫ $467,062 ϭ $297,938
Houston:
$123,500 Ϫ (0.15 ϫ $2,321,560) ϭ $123,500 Ϫ $348,234 ϭ $(224,734)
San Antonio:
$99,000 Ϫ (0.15 ϫ $460,000) ϭ $99,000 Ϫ $69,000 ϭ $30,000
NOTE
: For purposes of these computations, income is defined as segment margin and assets are defined as total
asset cost.
EXHIBIT 19–11
Southwest Real Estate Residual
Income Calculations
residual income
Top management must interpret the performance measures in light of the orga-
nizational mission of each investment center. In the case of Southwest, all divisions
have the same organizational mission and products that facilitate direct comparisons.
Economic Value Added
Perhaps the most popular trend in performance measurement is the development
of measures intended to more directly align the interests of common shareholders
and managers. Leading this trend is corporate adoption of the measure economic
value added (EVA).
12
Conceptually similar to RI, EVA is a measure of the profit
produced above the cost of capital. The major distinction between RI and EVA is
that the target rate of return for EVA is applied to the capital invested in the divi-
sion or firm as opposed to the market value or book value of booked assets, which
is the measure used for RI. Furthermore, because only after-tax profits are avail-
able to stockholders, EVA is calculated based on after-tax profits:
EVA ϭ After-Tax Profits Ϫ (Capital Invested ϫ Cost of Capital %)
Capital invested is defined as the market value of total equity and interest-bearing
debt. The market value of invested capital can differ considerably from the book
or market value of recorded assets. As this difference increases, so do the relative
benefits of using EVA rather than RI as a performance measure. It is not uncom-
mon today for the market value of a firm to be as high as five or six times the
book value of the firm. Accordingly, RI, which is based on a target rate of return
applied to the book value of assets, is likely to indicate much better performance
than EVA. This point is illustrated in Exhibit 19–12. The exhibit builds on data
taken from Exhibit 19–8 pertaining to Southwest Real Estate.
The data in Exhibit 19–12 show substantial differences between the market and
book values of all investment centers. The differences are positive for the Dallas cen-
ter and negative for the other two. Calculations of EVA for each investment center
are given in Exhibit 19–13. The after-tax cost of capital is assumed to be 13 percent.
The results given in Exhibit 19–13 show a completely different portrayal of
performance than the results of the ROI and RI calculations. The ROI and RI cal-
culations failed to capture the extraordinarily large difference between the market
and book values of the Dallas investment center. Accordingly, the ROI and RI mea-
sures overstate by a large margin the performance of the Dallas investment cen-
ter. The Houston investment center still appears to be performing poorly, although
Chapter 19 Measuring Short-Run Organizational Performance
875
12
EVA is a registered trademark of Stern Stewart & Co. It was first discussed by Alfred Marshall, an English economist in about
1890.
economic value added
(IN THOUSANDS)
Dallas Houston San Antonio Total
Operating income $ 579,000 $ 84,500 $ 74,000 $737,500
Taxes (34%) (196,860) (28,730) (25,160) (250,750)
Net income $ 382,140 $ 55,770 $ 48,840 $486,750
Current assets $ 24,250 $ 16,560 $ 10,000
Fixed assets 3,089,500 2,305,000 450,000
Total asset cost $3,113,750 $2,321,560 $460,000
Total market value $9,125,000 $1,200,000 $250,000
EXHIBIT 19–12
Data for Southwest Real Estate’s
Economic Value Added
Calculations
How is economic value added
used to measure performance?
7
better than the Dallas center. The San Antonio center is shown to be the stellar
performer.
Despite the growing popularity of the EVA measure, it cannot measure all di-
mensions of performance and it is a short-term measure of performance. Accord-
ingly, the EVA measure can discourage investment in long-term projects because
such investments drive up the amount of invested capital immediately but increase
after-tax profits only at some point in the future. The result is a near-term decrease
in EVA. Thus, EVA should be supplemented with longer term financial performance
measures (especially for growth-oriented organizational subunits) and with nonfi-
nancial performance measures.
When used to measure investment center performance, each of the financial
measures of performance discussed has certain limitations. For example, the limi-
tations of divisional profit and cash flow are their potential for income and cash
flow manipulation.
Limitations of Return on Investment, Residual Income
and Economic Value Added
ROI, RI, and EVA have three primary limitations. The first limitation is a triple di-
mension problem related to income. Income can be manipulated on a short-run
basis. Income also depends on the methods selected to account for items such as
inventory cost flow or depreciation. Secondly, for perfectly valid comparisons to
be made among investment centers, all centers must use the same accounting meth-
ods. Finally, income is based on accrual accounting, which does not consider the
pattern of cash flows or the time value of money and, therefore, may not always
provide the best basis for evaluating investment center performance. This problem
is illustrated in the accompanying News Note.
The second limitation is also a triple dimension problem related to the asset
investment base on which ROI, R1, and EVA measures rely. Asset investment is
difficult to properly measure and assign to center managers. Some expenditures
have residual values beyond the accounting period, but are not capitalized (for
example, research and development costs) and, therefore, create an understated
asset base.
13
Also, assets included in the asset base might be the result of deci-
sions made by previous investment center managers. Thus, current managers can
potentially be judged on investment decisions over which they had no control.
Third, “[w]hen fixed assets and inventory are not restated for [rising] price level
changes after acquisition, net income is overstated and investment is understated.
Thus managers who retain older, mostly depreciated assets [often] report much
Part 5 Evaluating Performance
876
EVA ϭ After-Tax Profits Ϫ (Market Value of Capital Invested ϫ Cost of Capital %)
Dallas:
$382,140 Ϫ ($9,125,000 ϫ 0.13) ϭ $382,140 Ϫ $1,186,250 ϭ $(804,110)
Houston:
$55,750 Ϫ ($1,200,000 ϫ 0.13) ϭ $55,750 Ϫ $156,000 ϭ $(100,250)
San Antonio:
$48,480 Ϫ ($250,000 ϫ 0.13) ϭ $48,480 Ϫ $32,500 ϭ $15,980
EXHIBIT 19–13
Southwest Real Estate’s
Economic Value Added
Calculations
13
Life-cycle accounting can help to eliminate this problem.
higher ROIs than managers who invest in new assets.”
14
This is much less of a
problem for the EVA measure, at least for measurement of assets. It is no less of
a problem for EVA’s income measure.
The third limitation of these measures is a single, potentially critical problem.
Each of these measures focuses attention on how well an investment center per-
forms in isolation, rather than how well that center performs relative to company-
wide objectives. Such a focus can result in suboptimization of resources, meaning
that the firm is not maximizing its operational effectiveness and efficiency.
The San Antonio Division of Southwest Real Estate is used to illustrate the ef-
fects of suboptimization. As indicated in Exhibit 19–8, the San Antonio investment
center has revenues of $215,000, direct costs of $116,000, and an asset base of
$460,000. ROI for the center is 21.5 percent ($99,000 Ϭ $460,000). Assume that the
San Antonio center has an opportunity to increase income by $20,000 by installing
a new computer network. This venture requires an additional capital investment
of $100,000. Considered separately, this venture would result in a return on in-
vestment of 20 percent ($20,000 Ϭ $100,000). If the San Antonio manager accepts
this opportunity, the center’s return on investment will fall:
ROI ϭ (Original Income ϩ New Income) Ϭ (Original Assets ϩ New Assets)
ϭ ($99,000 ϩ $20,000) Ϭ ($460,000 ϩ $100,000)
ϭ $119,000 Ϭ $560,000
ϭ 21.25%
If Southwest Real Estate evaluates investment center managers based only on ROI,
the San Antonio center manager will not accept this investment opportunity be-
cause it would cause the center’s ROI to drop.
Assume, however, that Southwest Real Estate has established a target rate of
return of 16 percent on investment dollars. The decision by the San Antonio man-
ager to reject the new opportunity suboptimizes the companywide returns. This
venture should be accepted because it provides a return higher than the firm’s target
rate. Top management should be informed of such opportunities, made aware of
the effects acceptance will have on divisional performance measurements, and be
willing to reward such acceptance based on the impact on company performance.
Chapter 19 Measuring Short-Run Organizational Performance
877
But, If the Bird’s Not in the Hand . . .
NEWS NOTEGENERAL BUSINESS
While EVA may be the best single-period measure of per-
formance currently known, it is not the universal answer
to the search for the perfect performance measure, ac-
cording to Michael C. Jensen of the Harvard Business
School and William H. Meckling of the University of
Rochester. Like all flow measures, EVA fails to solve what
they call the “capital value” problem.
This problem arises for projects where early years’
EVA is negative, but the future annual EVA of a project
is sufficiently large to justify an investment. Perfect mea-
sures of capitalized value will never be found, the au-
thors conclude, because value cannot be known with cer-
tainty until after a project has run its course to completion
and shutdown.
SOURCE
: Anonymous, “EVA Bandwagon,”
Journal of Commerce
(October 21,
1999), p. 7. Reprinted with permission from the Journal of Commerce.
14
Robert S. Kaplan, “Yesterday’s Accounting Undermines Production,” Harvard Business Review (July–August 1984), p. 99.
Why might the use of ROI create
suboptimization in investment
decisions?
7