Clearing Services for Global Markets A Framework for the Future Development of the Clearing Industry_6 doc
Bạn đang xem bản rút gọn của tài liệu. Xem và tải ngay bản đầy đủ của tài liệu tại đây (1.5 MB, 38 trang )
157 Analysing costs of derivatives clearing – transaction cost studies
r
assessment of clearing members’ average direct and indirect costs (sec-
tion 5.2.4);
r
analysis of clearing members’ unit costs (section 5.2.5);
r
benchmarking of derivatives clearing versus other market infrastructure
costs (section 5.2.6);
r
identification of cost reduction scenarios for clearing members (sec-
tion 5.2.7);
r
presentation of non-clearing members’ perspectives (section 5.2.8); and
r
introduction of cost reduction scenarios for non-clearing members
(section 5.2.9).
5.2.1 Clearing house fees
The comparison of clearing house fees is valuable for different reasons. Firstly,
the prev ious section showed that as the core driver of clearing costs, clearing
house fees have great relevance for high volume clearing members with a prop.
focus; but the fees ultimately represent an important cost component for all
clearing member types. Secondly, clearing house charges constitute the basis
for the subsequent analyses, such as the estimate of total European clearing
industry costs (section 5.2.3),
61
which in turn a llows for conclusions on the
average direct and indirect costs of the various low, medium and high volume
clearing member types (section 5.2.4) and their unit costs (section 5.2.5).
For the comparison of per-contract fees, the major European clearing
houses (Eurex Clearing, LCH.Clearnet, OMX Clearing, MEFF and CC&G)
were chosen to constitute the p eer group to be benchmarked against the two
largest US derivatives clearing houses, the CME and the OCC. For the pur-
pose of this analysis, fees a re not compared on a per-contract basis, but with
reference to a hedged amount of €500,000. The fee levels presented in the
following thus signify the charges for a single derivatives transaction worth
€500,000.
62
The reference date for the analysis was 29 September 2006.
63
61
Clearing house charges constitute the only publicly available information on the transaction costs of
derivatives clearing. As interviewees refused to provide quantitative details on their direct and indirect
costs, any further cost calculation must therefore be based on publicly available data.
62
This type of analysis facilitates the comparison of the per-contract fees charged by clearing houses by
equalising the different contract values. Although it can be assumed that the contract value is at least to
some extent reflected in the fee levels set by clearing houses, a comparison of per-contract fees runs the
risk of yielding incommensurable results.
63
29 September 2006 thus served as the reference date for exchange rates and the value of the respective
underlying.
158 Clearing Services for Global Markets
The fee levels of three different product groups, i.e. equity, equity
index and interest rate products, are compared. For each product group,
benchmark products were chosen according to comparability and volume
within the respective product group. In other words, whenever possible, the
products with the highest number of contracts cleared were selected as bench-
mark products.
64
Thefeesspecifiedhavebeenroundeddownoruptothe
nearest integral number.
65
Comparing clearing fees is problematic when all-
in fees (comprising trading and clear ing fees) are charged by clearing houses
or exchanges. As this is indeed the case for Eurex Clearing and OMX,
66
the
following workaround was implemented: in order to ensure comparability
with the fee levels of Eurex Clearing and OMX, trading fees were included
in the analysis. Whereas the OMX fees thus represent the combined charges
for trading and clearing, an artificial fee split was developed to separate the
trading and clearing components out of the all-in fees charged by Eurex.
67
Despite the inclusion of trading fees, the focus of the analysis is on the fees
charged by clearing houses. Note that whenever reference is made to Eurex’s
clearing fee in the following analysis, this fee represents an artificial estimate.
Should Eurex decide to separate its combined fee into trading and clearing
components at any point in the future, it must be assumed that this will result
in entirely different clearing fees. For a comprehensive overview of all fees and
details on the calculation, refer to Appendix 6. Following a brief description
of the benchmark analysis of equity, equity index and interest rate fees, the
findings are summarised and interpreted.
64
Based on the assumption that the highest volume products enjoy the most competitive pricing and
are thus best suited for a benchmark analysis, they were selected as benchmark products when-
ever possible. For the purpose of this analysis, the results of the comparison of benchmark prod-
ucts are generalised according to the respective product category. It should be taken into account
that this generalisation of results might not be applicable to all products within a specific product
category.
65
Decimal places 0.1 to 0.4 were rounded down; decimal places 0.5 to 0.9 were rounded up.
66
Furthermore, OneChicago charges all-in fees for single stock futures and Euronext.liffe charged an
all-in fee for equity derivatives traded on the Amsterdam market and cleared through LCH.Clearnet
until November 2006. Since then, Euronext.liffe and LCH.Clearnet have charged separate tr ading and
clearing fees.
67
Eurex and the Clearing Corporation planned to charge a link fee of €0.05 for the clearing of the
Eurex’s CFTC-approved euro-denominated products. The average transaction fee for these products is
approximately €0.30. It is assumed that the value of the link fee approximately resembles the stand-alone
value of Eurex’s clearing service. For the purpose of this analysis, the clear ing and trading fees are thus
assumed to be equivalent to 17 and 83 per cent of the all-in fee, respectively. Note that this calculation
serves the purpose of approximation only. The average transaction fee of €0.30 includes both a trading
and a clearing fee component. Calculating the exact fee split would thus require taking this factor into
account.
159 Analysing costs of derivatives clearing – transaction cost studies
0
20
40
60
80
100
120
140
200
220
1,500
50
100
150
200
250
300
350
1,000
No. of cleared contracts in m.Fees in EUR
Equity options clearing fees
Equity futures clearing fees
Equity options trading fees Equity futures trading fees
No. of contracts cleared in benchmark product in 2005
Hedged Amount: 500,000 / Reference Date: 29 September 2006
Eurex
24
36
OMX
91
200
MEFF
18
18
CC&G
74
73
CME/OCC
14
LCH.C
90
48
72*
* LCH.C as of January 2007
0
OCC
26 (CBOE)
18 (ISE)
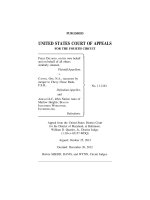
Figure 5.8 Clearing and trading fees for €500,000 hedge in equity options or equity futures
68
Source: Author’s own; based on clearing houses’ published fee schedules.
Figure 5.8 provides an overview of clearing and trading fees for a €500,000
hedge in individual equity options or single stock futures. The left axis displays
the respective fees charged for the transaction in euros. The right axis refers
to the number of cleared contracts in millions of contracts, i.e. the volume
of individual equity options and single stock futures cleared through the
respective clear ing house in 2005.
69
The sequence of the clearing houses
as presented in the figure is sorted by these cleared volumes. The volume
68
Single stock futures traded on OneChicago can be cleared at the CME or OCC. Whilst OneChicago
charges all-in fees for single stock futures, the assumed fee split is artificial and based on estimates from
expert interviews.
69
The volume of cleared products is exhibited on an annual basis rather than on a monthly basis because
clearing houses are more likely regularly to rev iew their pricing structure with reference to annual
figures rather than to any short-term data.
160 Clearing Services for Global Markets
information is included in the analysis to evaluate whether or not clearing
houses tend to translate higher volumes in benchmark products into lower
fees.
70
A comparison of the trading and clearing fees charged for a €500,000
hedge in individual equity derivatives reveals that trading fees are generally
higher than clearing fees. The significant variation of total fees within the
peer group is largely due to the different trading fees charged by the exchanges
rather than to substantial differences in clearing house fees. The clearing of the
equity options hedge is cheapest at the OCC and Eurex Clearing (ECAG), with
the OCC charging approximately €3 and ECAG claiming €4. At €9, MEFF’s
are roughly twice as high as ECAG’s clearing fees; at €12, CC&G charges are
triple their fee. At the reference date, LCH.Clearnet’s clearing fees were at
a non-competitive level, with €24 charged for the hedge. On 27 September
2006, the firm announced a reduction of these clearing fees as of January
2007,
71
resulting in charges that were more in line with those of its peers (i.e.
€6forthehedgeinequityoptions).
For the hedge in single stock futures, Eurex Clearing, LCH.Clearnet and the
CME/OCC each charge clearing fees of roughly €6, while MEFF charges €9
and CC&G€13. It isapparent that OMX charges the highest all-in fees for both
equity options and single stock futures. Whereas its charges for equity options
are on a par with the combined trading and ‘old’ clearing fees charged by
Euronext.liffe and LCH.Clearnet, fees charged for single stock futures appear
to be extraordinarily high. At €200, its fees are roughly three times higher
than those charged by CC&G and IDEM (the Italian derivatives exchange)
as well as fourteen times higher than OneChicago’s combined clearing and
trading fees.
Figure 5.9 exhibits clearing and trading fees for a €500,000 hedge in index
options or index futures.
72
Clearing the hedge in index options is cheapest in
the US; the OCC charges 13 cents. In Europe, LCH.Clearnet offers the most
competitive rate at 25 cents. Eurex Clearing charges more than twice as much,
i.e. 65 cents for the hedge in index options. Lastly, CC&G charges €1.56 for
clearing services.
70
This helps to provide first evidence of the existence of economies of scale on the part of the clearing
houses. Note that a final conclusion on this issue is not possible without taking into account the
production costs of clearing houses. A more detailed analysis of clearing house production costs and
the existence of economies of scale is provided in Chapter 6.
71
Cf. LCH.Clearnet (ed.) (27.09.2006).
72
Refer to Appendix 6 for details on which products were chosen for the benchmark analysis.
161 Analysing costs of derivatives clearing – transaction cost studies
0
2
4
6
8
10
12
14
16
18
390
30
60
90
120
150
180
210
360
No. of cleared contracts in m.Fees in EUR
Hedged Amount:
500,000 / Reference Date: 29 September 2006
OMX
17 17
MEFF
5
CC&G
6
3
OCC
1
LCH.C
2 2
Eurex
4
4
CME
1
Index options clearing fees
Index futures clearing fees
Index options trading fees
Index futures trading fees
No. of contracts cleared in benchmark product in 2005
Figure 5.9 Clearing and trading fees for €500,000 hedge in index options or index futures
Source: Author’s own; based on clearing houses’ published fee schedules.
An analysis of the fees for the hedge in index futures reveals that clearing is
cheapest in Europe, with 25 cents charged by LCH.Clearnet. The CME charges
30 cents for clearing the hedge, Eurex Clearing and CC&G both demand
65 cents and MEFF asks €2.50.Thecombinedtrading and clearingfees charged
by OMX are again well above the levels charged by its peer group, with €17
charged for both the hedge in index options or index futures.
Finally, the fees charged for a €500,000 hedge in interest rate futures are
compared. Figure 5.10 provides an overview of relevant fees for cash settled
and physically delivered interest rate futures.
73
The analysis shows that the
clearing of physically delivered interest rate products is cheapest in Europe,
with Eurex Clearing charging 17 cents for the €500,000 hedge. At 30 cents, the
73
Refer to Appendix 6 for details on which products were chosen for the benchmark analysis.
162 Clearing Services for Global Markets
0
0.5
1.0
1.5
2.0
2.5
3.0
9.5
10.0
10.5
900
100
200
300
400
500
600
700
800
No. of cleared contracts in m.Fees in EUR
Eurex
1
0.1
MEFF
2.3
LCH.C
0.2
OMX
9.8
1.5
CC&G
N.A.
CME
0.6
0.1
OCC
N.A.
Interest rate futures (phys.) clearing fees
Interest rate futures (cash) clearing fees
Interest rate futures (phys.) trading fees Interest rate futures (cash) trading fees
No. of contracts cleared in benchmark product in 2005
Hedged Amount: 500,000 / Reference Date: 29 September 2006
Figure 5.10 Clearing and trading fees for €500,000 hedge in interest rate futures
Source: Author’s own; based on clearing houses’ published fee schedules.
CME charges almost twice as much for clearing the hedge in T-bond futures;
MEFF prices the clearing of its product at 75 cents.
74
Clearing the hedge in
cash settled interest rate derivatives is generally cheaper. The cheapest fees
are offered in Europe, with Eurex Clearing and LCH.Clearnet both charging
2 cents for the hedge. The CME’s clearing fees are double the amount at
4 cents. The all-in fees charged by OMX are above the combined trading and
clearing fees of its peers; its fees for physically delivered interest rate futures
are roughly ten times higher than the fees charged by Eurex and roughly four
times higher than those charged by MEFF. At €1.50, cash settled interest rate
futures are seven-and-a-half times more expensive than products traded at
Euronext.liffe and cleared through LCH.Clearnet.
74
The inclusion of MEFF’s product, the Bono 10, is for the purpose of enlarging the peer group only. In
2005, not a single contract was traded in interest rate products at MEFF.
163 Analysing costs of derivatives clearing – transaction cost studies
To summarise, the benchmark analysis yielded a number of insights. Firstly,
trading fees are in all cases higher than clearing fees. Secondly, the most
economical way to execute the hedge is in the form of interest rate derivatives.
Hedging in index derivatives is more expensive, but hedging in individual
equity derivatives is the most expensive of all.
75
Further, the comparison of
fee levels charged by the different European and US clearing houses revealed
that with respect to four of the six benchmarked product ty pes, European
clearing houses charged lower fees than their US counterparts. However,
US clearing houses offer the lowest rates in equity options and index options
clearing . In fact, given the disparity between volumes cleared in the US in
certain products, such as by the OCC in equity options and by the CME
in index futures, and the largest European CCPs, it is surprising that the
difference in fees is not greater. It should be taken into account, however, that
it is common practice amongst American clearing houses to grant rebates
and/or (annual) discounts to certain clearing member types. Such reductions
were not taken into account, which distorts any final conclusions.
The analysis also serves to illuminate and provide a snapshot of the pricing
structure of the benchmarked clearing houses. High volumes do not always
seem to translate into lower fees, suggesting that there is room for thereduction
of per-contract clearing fees. Eurex Clearing offers competitive pricing for the
clearing of equity options, single stock futures and interest rate derivatives.
76
Although the fee split is artificial, its fees for clearing index options and
index futures nonetheless appear to be too high.
77
LCH.Clearnet’s fees for
single stock futures, index derivatives and cash-settled interest rate products
are competitive.
78
Despite the reduction in clearing fees for equity options,
these charges still seem excessive.
79
Whereas the clearing fees charged by the
CME and OCC for the clearing of single stock futures traded on OneChicago
75
These results are not surprising, because the pricing of derivatives is usually based on a per-contract
level. Due to the very high value of one interest rate contract as compared to one index, or individual
equity contract, a smaller number of contracts is needed for hedging a certain amount in interest rate
derivatives–whichinturnresultsinlowerfeeschargedforthetransaction.
76
An analysis of combined trading and clearing fees, on the other hand, suggests that the all-in fees
charged by Eurex could be lower for equity futures and physically delivered interest rate derivatives.
77
In index options, LCH.Clearnet charges half of Eurex’s clearing fees, although Eurex clears double the
volume. In index futures, Eurex’s clearing fee levels are equal to clearing fees charged by CC&G, albeit
with a volume of cleared contracts that is roughly thirty-seven times higher.
78
An analysis of the combined trading and clearing fees indicates that the trading fees charged by
Euronext.liffe for single stock futures could be lower.
79
With more volume cleared in equity options than Eurex, LCH.Clearnet’s new fee is still one-and-a-half
times higher than that of Eurex. There is room for improvement with regard to Euronext.liffe’s trading
fee; despite volumes that are approximately twenty-two times hig her than those of CC&G and IDEM,
its all-in fees are merely 3 per cent lower.
164 Clearing Services for Global Markets
are competitive, the CME’s fees for clearing index futures and interest rate
derivatives appear over-priced.
80
The fees charged by the OCC for individual
equity and index options seem reasonable, but not remarkably so.
81
Taking
into account the comparatively low volumes cleared at MEFF and CC&G, both
clearing houses’ fees are generally at very competitive levels.
82
The combined
trading and clearing fees charged by OMX for equity options and cash-settled
interest rate derivatives are relatively high, but within the scope of the peer
group. However, the fees charged for single stock futures, index derivatives
and physically delivered interest rate products are non-competitive.
Overall, the comparative analysis of per-contract fees charged by the major
horizontally and vertically integrated European and US clearing houses pro-
duced no clear winner in terms of the most competitive fee levels.
5.2.2 Clearing houses’ volume discount schemes
As outlined above, the second focus of the cost analysis is on investigating
the clearing houses’ volume discount schemes. The purpose of the analysis is
to discover which clearing member types – i.e. low, medium or high volume
clearers – receive preferential treatment from clearing houses; this serves
further to explore particularities of the current structure of the Value
Provision Network.
Not all clearing houses grant volume discounts, though. Figure 5.11 speci-
fies which of the b enchmarked clearing houses employ volume discounts, and
in which product categories. It also identifies the criterion used by the clearing
house to determine the discounts. When clearing houses utilise the ‘trade size’
as a criterion for discounts, this refers to the number of contracts per trans-
action. Other criteria employed are volume thresholds, i.e. a determination
of the minimum number of contracts cleared, either on a daily or monthly
basis. Usually, volume discounts either translate into reduced per-transaction
fees or fee caps.
83
80
Even though CME’s cleared volumes of index futures are roughly seven times higher than those of
LCH.Clearnet, CME’s clearing fee is still higher. Taking the trading fees into account changes the result
of the analysis, though – CME’s combined trading and clearing fee for index futures is the cheapest rate
offered. The same applies to the all-in fees for interest rate products charged by CME; these are at very
competitive levels.
81
At first sight, the fees charged for the clearing of equity options seem to be too high, because they are at
roughly the same level as those charged by Eurex, albeit with five times higher volumes cleared at the
OCC. However, the OCC provides refunds, fee reductions and discounts to its members on an annual
basis, which can ultimately lead to a significant reduction of the per-contract fee.
82
Taking the tra ding fees into account suggests that fees charged by IDEM for equity options and single
stock futures could be lower in comparison with its peers.
83
Volume discounts can also be granted through annual refunds and discounts.
165 Analysing costs of derivatives clearing – transaction cost studies
N.A.YES
Daily
Contracts
N.A.NONONONO
Interest Rate
Futures
CRITERION:
N.A.NONONONONONO
Index Futures
CRITERION:
N.A.
NO
NO
YES
Monthly
Contracts
NONO
Index Options
CRITERION:
YES
Trade Size
NOYES
Trade Size
NONO
Single Stock
Futures*
CRITERION:
N.A.NOYES
Trade Size
NO
Equity Options
CRITERION:
OCCCMECC&GMEFFOMXLCH.CEurex
* Cleared through CME or OCC
YES
Unspecified
YES
Trade Size
YES
Trade Size
YES
Trade Size
YES
Trade Size
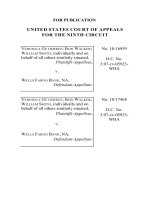
Figure 5.11 Clearing houses’ volume discounts in benchmark products, as of September 2006
Source: Author’s own; compilation based on clearing houses’ websites.
84
The overview shows that except for ECAG and MEFF, all of the other
benchmarked clearing houses employ volume discounts.
85
Volume discounts
are granted for the clearing of equity options, single stock futures, index
options and interest rate future contracts. None of the clearing houses applies
a volume-based discount scheme for index futures.
Whether or not clearing members generally welcome the implementation
of discount schemes again depends on their perspective and business focus.
Clearing memberswith aprop. focus welcome any reduction in fees charged by
clearing houses; members with an agency focus, however, are often dismissive
of such discounts, because the schemes tend to augment the complexity of
calculating the fees charged to customers. The need to monitor and track
discount levels translates into increased back-office costs.
From a proprietary point of view, I quite like fee caps, because we always hit them.
But it doesn’t benefit me as an individual from a client point of view. Then yes, it just
becomes a pain!
86
84
The key according to which annual refunds are granted by the OCC is not publicly available. Therefore,
the OCC’s annual refund policy is not included in the overview.
85
Note that the volume discounts specified for the CME refer to the Equity/Clearing Member pricing and
that the discount scheme of OMX concerns combined trading and clearing fees.
86
Statement made by interviewed clearing member representative.
166 Clearing Services for Global Markets
(1) 1–15,000
(2) 15,001–30,000
(3) > 30,000
Daily Contracts
N.A.
CME Futures or
Options on Futures
N.A.N.A.N.A.
Interest
Rate
Products
(1) 1–500
(2) 501–1,000
(3) 1,001–2,000
(4) > 2,000
(1) 1–21,000
(2) > 21,000
Trade Size
Monthly Contracts
Index Options
N.A.N.A.
Traded in SEK or EUR
N.A.
Index
Options
(1) 1–1,000
(2) > 1,000
(1) 1–2,000
(2) > 2,000
Trade SizeTrade Size
SSF
Traded in SEK or DKK
N.A.
Single
Stock
Futures
(SSF)
(1) 1–500
(2) 501–1,000
(3) 1,001–2,000
(4) > 2,000
(1) 1–1,000
(2) > 1,000
(1) 1–2,000
(2) 2,001–10,000
(3) > 10,000
(1) 1–6,000
(2) > 6,000
Trade SizeTrade SizeTrade SizeTrade Size
Equity Options
N.A.
Equity OptionsTraded in SEK, EUR
or DKK
Traded in Paris
Applicable
Member Type:
Discount Level
Rate of
Reduction:
Criterion:
Product:
Applicable
Member Type:
Discount Level
Rate of
Reduction:
Criterion:
Product:
Applicable
Member Type:
Discount Level
Rate of Reduction:
Criterion:
Product:
Applicable
Member Type:
Discount Level
(No. of contracts)
Rate of
Reduction:
Criterion:
Product:
Equity
Options
OCCCMECC&GOMXLCH.C
Unspecified
Unspecified
Single Stock Futures
–97%
–10%
–75%
–75%
–20%
–40%
> 40%
–50%
–43%
–20%
–40%
> 40%
VERY HIGH
VOLUME
VERY HIGH VOLUME
VERY HIGH
VOLUME
VERY HIGH
VOLUME
VERY HIGH VOLUME
UNSPECIFIED
HIGH VOLUME
HIGH VOLUME
HIGH VOLUME
MED./HIGH VOLUME
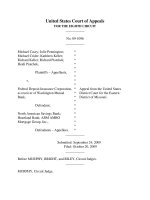
Figure 5.12 Clearing houses’ volume discounts and benefiting clearing member types
Source: Author’s own; compilation based on clearing houses’ websites.
87
Even though the clearing houses are trying to do you a favour by doing this tiered
structure, it doesn’t reduce your costs; it actually increases your costs, because you
have to track these and pass them on to the customer. So that is a ver y big issue
for us.
88
Figure 5.12 details the discount schemes employed by the clearing houses,
specifies the benefiting clearing member types and allows conclusions as to
whether or not the potential savings through volume discounts are substantial.
The overview shows that clearing houses tend to give high volume clearers
preferential treatment through discounts. Medium volume clearers hardly
ever benefit, and low volume clearers are not eligible for discounts at all. Out
87
Identification of applicable clearing member types is based on estimates that take into account the
following information: the number of cleared contracts per year/month/day eligible for discounts;
minimum and maximum market share thresholds as defined for low/medium/high volume clearers;
and information on average contracts per cleared trade as published by clearing houses.
88
Statement made by interviewed clearing member representative.
167 Analysing costs of derivatives clearing – transaction cost studies
of ten relevant discount schemes, only one initiative allows medium volume
clearing members to benefit from fee reductions, three schemes benefit merely
high volume clearers, and five initiatives are solely applicable to very high
volume clearing members.
89
Given that thehigh and very high volume clearing
members are the clearing houses’ most important customers, these findings
are not surprising; the clearing houses will logically aim to satisfy them. Those
types of clearer also have the greatest lobbying power, which ensures that their
voice is heard. A clearing house’s governance and ownership structures also
impact the ultimate influence that different types of clearer can exert over
the CCP.
The analysis also shows that the potential savings from discount schemes
can be substantial – on average, clearing members can save 50 per cent or even
much more in some cases. Findings suggest that benefits from preferential
pricing can translate into a competitive advantage for the respective high
volume clearing members.
To summarise, not all clearing houses provide volume discounts, but those
that do penalise low and medium volume clearing members; the CCPs tailor
their discount schemes to their high and very high volume clients. Fee caps and
rebates mainly benefit the high volume clearers with a prop. focus; whether
or not NCMs and other customers benefit from such schemes depends on
whether clearing members undertake the arduous monitoring and tracking
effort required to pass on these savings.
5.2.3 Total European clearing industry costs in 2005
To enable a deeper understanding of the true costs related to European deriva-
tives clearing and to provide a basis for analysing the impact that certain
network strategies between clearing houses have on transaction costs, the
third step of the cost analysis provides an estimate of the total European
clearing industry costs in 2005. The estimated figure represents the sum of
all direct and indirect costs borne by European clearing members in 2005
for clearing exchange-traded derivatives transactions through Eurex Clear-
ing, LCH.Clearnet, OMX Clearing, MEFF and CC&G. The calculation of
costs is based on insights from the empirical study (particularly information
on the composition of all-in clearing costs for different benchmark clearing
member types; see Figure 5.5), confidential information provided by Eurex
Clearing , as well as publicly available data on clearing houses’ cleared volumes,
89
One initiative could not be specified due to a lack of publicly available information.
168 Clearing Services for Global Markets
Direct
Costs*
Service Provider Charges = 250,000,000
Indirect
Costs*
Cost of Capital = 128,000,000
Risk Management Costs = 94,000,000
IT Costs = 579,000,000
Back-Office Costs = 647,000,000
Total European Costs* in 2005 = 2,173,000,000
Clearing House Charges = 475,000,000
3.
1.
2.
4.
5.
6.
Total European Direct Costs = 725,000,000
Total European Indirect Costs = 1,448,000,000
* Costs in EUR
Figure 5.13 Total European derivatives clearing costs in 2005
Source: Author’s own.
per-transaction fees, other feescharged, communication and network charges.
This resulted in the calculation of direct and indirect cost estimates for the
benchmark clearing members. This data was subsequently used to calculate
the total industry costs. For details on the quantitative analysis and the under-
lying assumptions, refer to Appendix 7.
Following the presentation of the quantitative results, the shortcomings
and limitations of the analysis are outlined. A more detailed interpretation of
the cost estimates is provided in section 5.2.6.
Figure 5.13 outlines the quantitative results of the analysis.
90
The total
European costs of derivatives clearing amounted to roughly €2.173 billion in
2005. This figure correlates to the first level of transaction costs, thus repre-
senting all direct and indirect costs that the 219 European clearing members
had to bear in the first place. Note that some of these direct and indirect costs
are redistributed within the Value Provision Network, as they are ultimately
90
Figures are rounded to millions of euros; €100,000 to €499,000 are rounded down, whereas €500,000
to €999,000 are rounded up.
169 Analysing costs of derivatives clearing – transaction cost studies
passed on (either directly or indirectly, as part of the commissions) by clearers
to their respective NCMs and/or other customers.
At €725 million, direct costs represent 33 per cent of total industry costs,
whereas indirect costs of roughly €1.448 billion amount to 67 per cent of
total costs. The most significant cost categories in 2005 were back-office
costs, with estimated annual costs of €647 million, followed by IT costs of
€579 million; clear ing house charges accounted for €475 million and service
provider charges came to €250 million. At the lower end of the spectrum,
capital costs and risk management costs added up to approximately €128
million and €94 million, respectively.
The underlying data on individual benchmark clearing members’ costs
was cross-checked with interviewees representing three of the selected clear-
ing members. Some limitations in the data were thereby uncovered, mainly
resulting from a mismatch of clearing-related costs as defined in section 3.2
and the input received from the intervi ewed clearing members.
The interviewees’ perception of the different cost categories is outlined
in section 5.1 and explains why certain cost categories (such as the cost
of capital and r isk management costs) were structurally underestimated in
terms of their significance by the interviewed clearing members. Other factors
also impacted the results of the cost analysis, mainly affecting the indirect
cost categories. All of these factors are detailed in the following paragr aphs.
Whereas the validation of the data on clearing house charges revealed that the
above-mentioned figure is in the right magnitude (see Appendix 7 for details),
several caveats apply to the interpretation of the indirect cost estimates.
91
The estimated €94 million in risk management costs represents the per-
sonnel costs pertaining to the basic continuous r isk management processes
related to monitoring proprietary and agency positions, but they do not cover
the personnel costs arising from sophisticated risk management processes.
Particularly high volume clearing members typically incur costs resulting
from dedicated risk management processes, which go beyond pure position
monitoring. The figure thus underestimates the effort and costs related to
such sophisticated r isk management processes. As outlined above, the diffi-
culties associated with the correct evaluation of risk management costs have
various causes. Risk management commonly covers several different markets
and products within a company; the responsibility for risk management can
also reside in (geographically) distinct depart ments and is not necessarily
relegated to one individual manager. Depending on the clearer’s set-up, risk
91
These caveats were identified with the help of interviewees.
170 Clearing Services for Global Markets
management costs might not be reallocated internally, which makes it even
more difficult for clearing managers to gain a true understanding of these
costs. Clearing-related risk management costs are thus difficult to isolate and
to assess correctly.
Another indirect cost category w hose magnitude is structurally underesti-
mated by clearing members is the cost of capital. As outlined above, calculat-
ing, analysing and understanding the true cost of capital related to clearing
is difficult for various reasons. When asked to assess the cost of capital, the
interviewed clearing members might not have had in mind the full scope
of these costs as defined in section 3.2.2.1. Furthermore, the cross-checking
of the data revealed that the figure of €128 million for capital costs in 2005
underv alues the magnitude of capital costs in that it mainly accounts for
external financing costs. As the empirical research is biased towards the v iew
of collateral-rich clearing members, whose capital base is usually sufficient to
cover any clearing-related collateral requirements, most respondents do not
need to utilise external financing for clearing . The majority of interviewees
consequently cited very low costs of capital for derivatives clearing. How-
ever, as the cost of capital also includes the opportunity cost of capital, i.e.
the expected return foregone by clearing members due to bypassing other
investment alternatives, this cost category is undervalued by the difference of
the value of the benchmark portfolio and the value of the executed portfolio
(interest payments from the clearing house) as outlined in section 3.2.2.1.
The figure of €579 million for IT costs covers IT systems and their basic
clearing-related functions, such as interfacing with clearing houses and inte-
grating the received data with internal systems; the estimate therefore fails to
incorporate the IT costs related to enhanced systems that manage complex
tasks related to customer and/or NCM relationships and systems development
costs. The IT solution n eeded for this task is much more complex and conse-
quently requires higher expenditures. The figure for IT costs in 2005 is thus
underestimated in that it does not include the costs normally incurred from
implementing and operating the requisite enhanced and flexible IT solution.
Finally, the estimate of €647 million for derivatives clearing back-office
costs in 2005 covers the performance of basic back-office functions related to
continuous position management, regular processing and the orderly booking
of transactions to (customer/NCM) accounts. However, the figure does not
incorporate the costs for functions related to customer/NCM services or cus-
tomer/NCM relationship management. GCMs in particular incur sig nificant
additional costs resulting from the need to manage customer sub-account
structures, as this often has to be done manually to some extent. The figure
171 Analysing costs of derivatives clearing – transaction cost studies
11% Service Provider Charges
22% Clearing House Charges
Risk Management Costs 4%
Cost of Capital 6%
IT Costs 27%
Back-Office Costs 30%
Indirect Costs
Direct Costs
67% 33%
Figure 5.14 Composition of total European derivatives clearing costs in 2005
Source: Author’s own.
also does not take into account the average of error account costs, project-
related effor ts or the full extent of compliance and legal documentation costs.
Interviewed clearing members thus underestimated the magnitude of back-
office costs; managers generally do not have a complete overview of all of the
cost components defined in section 3.2.2.4. This der ives from the fact that the
defined components of back-office costs are commonly located within several
distinct departments and cover various different business segments; no one
single manager is likely to have oversight and knowledge of all of these costs.
The figure for the magnitude of back-office costs does not incorpor ate the
above-mentioned factors and thus constitutes an underestimate.
To summarise, the estimate of total European derivatives clearing industry
costs for 2005 does not reflect all clearing-related indirect costs. It can be
assumed that the actual indirect cost figure is higher than suggested. Taking
this into account, the finding that indirect costs exceed direct costs remains
unchanged, whereas the relative importance of indirect costs increases and
the relevance of direct costs decreases. With reference to the available cost
estimate, direct costs constituted approximately one-third of total European
derivatives clearing costs in 2005, and indirect costs represented roughly two-
thirds. Unfortunately, due to a lack of access to more detailed cost data, the
magnitude of the difference between the provided figures and thetrue cost data
cannot be quantified; it is therefore not possible to produce an ameliorated
cost estimate.
Whereas the results suggest that indirect costs were higher than direct
costs in 2005, the relative significance of back-office versus IT costs is more
172 Clearing Services for Global Markets
0
500,000,000
1,000,000,000
1,500,000,000
2,000,000,000
2,500,000,000
Costs in EUR
Total Costs Direct Costs Indirect Costs
European Derivatives Clearing Industry Costs in 2005
Percentage per Clearing Member Type
Low Vol. (Regional)
Medium Vol. (Reg Glob.)
High Vol. (Global)
Clearing Member Types :
2,173,000,000
725,000,000
1,448,000,000
34%
37%
29%
56%
30%
14%
23%
40%
37%
Figure 5.15 Per cent stake of different clearing member types in European derivatives clearing costs in 2005
Source: Author’s own.
problematic to determine. The available cost estimate indicates that back-
office costs and IT costs constituted 30 and 27 per cent of total industry costs,
respectively, revealing that total back-office costs were higher in 2005 than
total IT costs.
When analysing back-office versus IT costs, it should be taken into account
that the results of the cost estimate are biased towards the information pro-
vided by the six benchmark clearing members (refer to Figure 5.5); all but
one considered back-office costs more significant. Whereas this is true for the
benchmark clearers, it is not necessarily true for any other European clearing
member. The twenty-one interviewed clearing members unanimously con-
sidered the two categories as the most important sources of indirect costs,
but their input did not reveal the dominance of one over the other. It can
therefore be concluded that back-office and IT costs constituted the two most
significant indirect cost categories, but it cannot be clearly determined which
is more so.
Finally, Figure 5.15 outlines the per cent stake held by the different clearing
member types in the European costs of derivatives clearing. Whereas total
costs are roughly distributed equally across all three clearing member types –
i.e. low, medium and high volume clearers must bear 29, 37 and 34 per
cent, respectively, of total industry costs – a different picture emerges when
173 Analysing costs of derivatives clearing – transaction cost studies
direct and indirect costs are compared. The finding that high volume clearing
members bear roughly 56 per cent of all direct costs explains their strong
lobbying interest in trying to push clearing houses to reduce their fees (which,
as outlined above, is particularly relevant from a proprietary perspective).
The figure also illustrates the finding that indirect costs account for the
bulk of European derivatives clearing industry costs, of which regionally-to-
globally active (medium volume) clearers and regionally active clearers have to
bear the largest part (40 and 37 per cent, respectively). These clearing member
types consequently have a strong stake in the reduction of indirect clearing
costs.
5.2.4 Clearing members’ average direct and indirect costs
The fourth step of the cost analysis consists of an assessment of average annual
direct and indirect costs of different low, medium and high volume clearing
member archetypes. This analysis does not claim to deliver results applicable
to any particular clearing member, but it does provide for an archetypical
assessment of clearing costs. This in turn offers a deeper understanding of the
magnitude of clearing-related costs for different clearing member types and
serves to explain the structural particularities of the European Value Provision
Network.
The calculation is based on the assumptions underlying the estimate of total
European industry costs, as outlined in Appendix 7, as well as on insights from
the empirical study and feedback from selected interviewees. This enabled the
calculation of the average annual direct and indirect costs for clearing member
archetypes, as outlined in Figure 5.16.
For the purpose of this analysis, it was assumed that all of the pre-
sented European clearing member archetypes are direct members of all major
European clearing houses (Eurex Clearing, LCH.Clearnet, OMX Clearing,
MEFF and CC&G). For low and medium volume clearers, this assump-
tion deviates from the definition provided in section 2.3.2. The definition
establishes that regionally active (low volume) clearers do not maintain
more than a single clearing membership (with their domestic home clearing
house). The definition also outlines that while regionally-to-globally active
(medium volume) clearers are active (or interested in becoming active) in
many markets; they maintain only a single direct clearing relationship with
their domestic home clearing house. To clear their transactions in the other
(foreign) markets, these membersutilise one orseveral other GCMs as clearing
intermediaries.
174 Clearing Services for Global Markets
HIGH VOLUME CLEARER
MEDIUM VOLUME CLEARER
LOW VOLUME CLEARER
Ø TOTAL*Market Share Ø Direct Costs* Ø Indirect Costs*
10.00 %
4.00 %
3.00 %
2.00 %
1.00 %
0.50 %
0.30 %
0.01 %
52,509,000 35,006,000 87,515,000
30,869,000 25,256,000 56,125,000
24,453,000 21,685,000 46,138,000
15,145,000 22,718,000 37,863,000
8,483,000 25,450,000 33,933,000
4,756,000 21,665,000 26,421,000
3,093,000 14,092,000 17,185,000
861,000 4,880,000 5,741,000
Ø Unit Costs*
0.20
0.26
0.35
0.43
0.78
1.21
1.32
13.19
Costs in EUR
Figure 5.16 Average annual direct and indirect costs for clearing member archetypes
92
Note: ø = average.
Source: Author’s own.
Figure 5.16 illustrates the dynamics that constitute these structural partic-
ularities of the European Value Provision Network concerning the clear ing
members, as presented in section 2.5.1. The figure shows why it is economical
for medium volume clearers to utilise high volume clearers as intermediaries
instead of being a direct member of all European CCPs. It also indicates
why a relatively small number of European high volume clearers (around
seventeen) account for the bulk (roughly 73 per cent) of the total annual
European cleared market share (see Figure 2.19).
Generally speaking, service provider charges, risk management, back-office
and IT costs are largely fixed costs in the context of this set-up, whereas
clearing house charges and cost of capital are partly fixed, but for the most
part constitute variable costs. The more clearing house memberships a clearer
maintains, the higher the related direct and indirect fixed costs. According
to the findings from the empirical study, as outlined in section 5.1, there
are economies of scale on the part of the clearing members that enable high
volume clearers to economise on their internal structures and processes and
consequently leverage their fixed cost base.
Figure 5.16 underlines the existence of economies of scale by illustrating
that as cleared volume increases, unit costs decrease. Low and medium volume
92
The market share refers to the clearer’s relative share of the total European exchange-traded derivatives
clearing volume, i.e. the sum of cleared volumes at Eurex Clearing, LCH.Clearnet, OMX Clearing,
MEFF and CC&G.
175 Analysing costs of derivatives clearing – transaction cost studies
clearers therefore have to bear disproportionately high fixed costs, based on
the assumption that they are members of all major European clearing houses.
The lower a clearing member’s market share, the higher its fixed cost burden,
and the less economic sense it makes for the clearer to become a member
of all European clearing houses. It is simply too expensive to replicate these
fixed costs when another firm can provide this service in a more cost-effective
manner. In this case, clearing members are better off maintaining a single
direct clearing membership and employing the intermediary services of a
GCM to connect to any other clearing houses. Low and medium volume
clearers in particular will therefore not opt to become members of every
major European clearing house. This explains why a very high percentage of
the European market share in derivatives clearing is concentrated on a few
very high volume clearers; these clearers have cost structures that make it
attractive to offer intermediary services, and for low and medium volume
clearers, it makes economic sense to utilise these services. Should a low or
medium volume clearer nonetheless choose to become a member of many or
all major European clearing houses, the driving factors are likely to relate to
secrecy, control and reputation, rather than to cost efficiency.
The provided assessment of clearing members’ average annual direct and
indirect costs is based on theoretical archetyp es. In reality, the relationship
of cleared volume to cost structure is not so cut and dried; there are cases
in which low and high volume clearers operate with cost structures typical
for medium volume clearers, and some medium volume clearers have cost
structures resembling those typical for low volume clearers, etc. Consequently,
the incentive for using a GCM as an intermediary for certain markets instead
of maintaining a direct clearing membership can also apply to high volume
clearers, depending on their cost structure.
Similar considerations apply to the analysis of the unit costs, which corre-
spond to the number of lots cleared by a clearing member in relation to the
sum of total direct and indirect costs. Analysing the unit costs provides insight
into the clearing members’ costs of production, which are further explored in
the following section.
5.2.5 Clearing members’ unit costs
Whereas the previous sections provided a detailed explanation and analysis
of the magnitude of direct and indirect clearing-related costs that different
clearing member types have to bear, this section focuses on putting these costs
into context.
176 Clearing Services for Global Markets
As outlined in section 3.2, costs of production imply divergent meanings
for different clearing members. For a clearer with a prop. focus, these refer
to the costs of doing business, but from the perspective of a clearing member
with agency focus, the costs pertain to producing the services it provides to
its customers/NCMs. In the latter case, the costs of production form the basis
for the commissions charged by a GCM to its NCMs, thus directly impacting
the GCM’s profit margin.
In addition to the unit cost estimates detailed in Figure 5.16,theexpert
inquiry revealed that when comparing estimates for unit costs on the basis of
fixed costs per lot (i.e. covering service provider charges, risk management,
back-office and IT costs), unit costs can be as low as 10 cents for ver y high
volume clearers and as high as €13 for very low volume clearers.
Whereas these unit costs are relevant for clearers with a prop. focus, a
different scope of production costs has to be analysed from the perspective
of clearing members with an agency focus. Certain costs, such as cost of
capital or risk management costs, can only be passed on to customers/NCMs
to a limited extent. Depending on which costs a clearing member charges to
its customers/NCMs (either directly or as part of commissions), the clearer’s
production costs can even be significantly lower than 10 cents, i.e. in the range
of 2 to 6 cents per lot for very high volume clearers.
93
A thorough comparison
of these production costs to the GCMs’ commissions exceeds the scope of this
study, but the overview of clearing members’ costs of production provided
here serves to clarify further the structural particularities of the European
Value Provision Network.
To summarise, the currently strong position of high volume clearers within
the European Value Provision Network is supported by their advantageous
cost str ucture. These clearers have cost structures that make it attractive to
offer clearing intermediary serv ices. Due to their scaleofbusiness, high volume
clearers further benefit from their strong negotiating position towards ser vice
providers, which allows them to minimise service provider charges. Clearing
houses further strengthen the competitive advantage of European high volume
clearers by granting volume discounts.
Network initiatives, which help to reduce indirect costs, can thus have an
important impact on the structure of the European VPN. This is true when
initiatives entice mediumvolume clearers to self-clear many markets instead of
employing intermediary services, or, more generally, when the attractiveness
93
Cf. interviews.
177 Analysing costs of derivatives clearing – transaction cost studies
of becoming a clearer instead of an NCM in many markets increases. Whether
certain network initiatives serve to weaken or strengthen the (weak) strong
position of (low and medium) high volume clearers in the European VPN is
examined in greater detail in the remainder of this study.
5.2.6 Derivatives clearing versus other market infrastructure costs
The previous sections delivered detailed insights on the total costs related to
European derivatives clearing; this section benchmarks these costs to other
European market infrastructure costs. A first step compares derivatives clear-
ing costs to derivatives trading costs. As derivatives only seldom require settle-
ment of the underlying, and are usually closed out prior to their expiration, a
comparison of derivatives clearing costs with settlement costs is not provided.
Instead, derivatives clearing costs are compared with the costs of securities
trading, clearing and settlement.
The comparison of per-contract fees charged by European and US clear-
ing houses revealed that for all of the analysed benchmark products, trading
fees were equal to or significantly exceeded clearing fees. This suggests that,
in 2005, variable exchange charges exceeded variable clearing house charges,
leaving aside fixed cost charges. These findings are supported by the inter-
viewed clearing members, some of whom explicitly confirmed that exchange
charges exceeded clearing house charges in 2005. Due to the interviewees’
hesitancy to provide financial details on the questionnaire, it is unfortu-
nately not possible to calculate the exact ratio of total derivatives tr ading costs
to total derivatives clearing costs. A further comparison of total derivatives
trading and clearing costs first requires an understanding of the direct and
indirect cost categories inherent to derivatives trading. Book (2001) differen-
tiates three cost categories for derivatives trading – information and decision
costs, execution costs and fulfilment costs – all of which contain direct and
indirect components.
94
Gomber/Schweickert (2002) identify additional indi-
rect trading-related costs, which they classify as timing costs, market impact
costs and opportunity costs.
95
Insight provided by market experts suggests
that these indirect trading costs are significantly higher than direct trading
costs, allowing for the inference that total European derivatives trading costs
94
Cf. Book (2001), pp. 92–7.
95
They refer to these costs as ‘implicit’ costs. Although their research focus is on securities trading ,
their classification of trading costs is applicable to derivatives trading. Cf. Gomber/Schweickert (2002),
p. 486.
178 Clearing Services for Global Markets
exceeded total European derivatives clearing costs in 2005. To the best of this
author’s knowledge, no detailed analysis or quantitative estimate of total direct
or indirect industry-wide derivatives trading costs has yet been conducted, nor
are there any publicly available data on the magnitude of direct versus indirect
derivatives trading costs. Therefore, the sum of direct and indirect derivatives
trading costs is unknown and no comparison to the sum of direct and indirect
derivatives clearing costs in 2005 can be conducted. Due to the limited scope
of this study, no attempt will be made to calculate these derivatives trading
costs to verify the above inference.
In a second step, derivatives clearing costs are benchmarked against the costs
of securities trading, clearing and settlement. Direct and indirect securities
trading
96
and clearing costs are defined according to the definitions applied to
derivatives. Kr
¨
opfl (2003) differentiates four direct and indirect cost categories
of securities settlement:
97
fees charged by intermediaries (CSDs/ICSDs), liq-
uidity costs, risk costs and back-office costs. Lannoo/Levin (2003) classify
fees charged by settlement entities as direct costs and define back-office costs,
interface costs, banking and other financial costs, as well as the cost of using
intermediaries as the indirect costs of securities settlement.
98
Similar to the
findings in derivatives, indirect costs are generally found to exceed direct costs
in securities trading, clearing and settlement.
99
For the purpose of comparing the estimates derived for European deriva-
tives clearing costs in 2005, two studies serve to deliver European benchmark-
ing figures: Morgan Stanley/Mercer Oliver Wyman (eds.) (2003) and Deutsche
B
¨
orse Group (ed.) (2005a). Despite the shortcomings of the figures derived
in these studies,
100
they are c urrently the only publicly available estimates of
European securities trading, clearing and settlement costs.
101
Note that the
data presented by the studies merely cover direct charges by exchanges, CCPs
and CSDs/ICSDs; they do not account for the service provider charges or indi-
rect costs (as defined in section 3.2). All figures relate to 2002 costs. Whereas
the number of transactions in European equity shares grew roughly 26 per
cent from 2002 to 2005,
102
any increases or decreases in these costs cannot be
96
See Kaserer/Schiereck (2007) for an analysis of direct and indirect securities trading costs.
97
Cf. Kr
¨
opfl (2003), p. 93.
98
Cf. Lannoo/Levin (2003), p. 8.
99
Cf. Giovannini Group (ed.) (2001), p. 66–7; Gomber/Schweickert (2002), pp. 485–9; and Werner
(2003), p. 17.
100
Refer to European Commission (ed.) (2006b), p. 19, for details on the strengths and weaknesses of the
studies.
101
Additional estimates will be available in the near future thanks to a study provided by Oxera (ed.)
(2007), which provides for a methodology to derive more precise estimates of the total costs of securities
trading, clearing and settlement.
102
Cf. www.world-exchanges.com.
179 Analysing costs of derivatives clearing – transaction cost studies
accounted for due to a lack of reliable data. It is thus assumed that these costs
have remained static, i.e. at their 2002 levels.
103
Based on the findings of the Morgan Stanley/Mercer Oliver Wyman (eds.)
(2003) study,
104
Deutsche B
¨
orse Group estimates that European investors’
expenditures can be broken down as follows, i.e. in terms of direct costs
attributable to charges by the respective infrastructure providers:
105
€1.9 bil-
lion can be allocated to exchange charges, €100 million to cash equity CCPs
and €1.4 billion to CSDs/ICSDs.
These estimates indicate that in terms of absolute costs, European clearing
house charges for derivatives clearing were approximately four times higher
than charges for cash equities clearing in 2005.
106
Nonetheless, the derivatives
market was roughly 6.4 times larger than the cash equities market in terms of
size (i.e. number of tr aded contracts andnumber of transactions, respectively).
Considering that the v alue-added provided by CCPs can be assumed to be
greater in derivatives than in cash equities markets, this finding suggests that
customers have benefited from the scale of the derivatives market in terms of
comparatively low clearing house charges. Despite the fact that evidence exists
suggesting that indirect costs exceed direct costs in securities clearing, there
are no publicly available data on the proportion of total direct versus indirect
securities clearing costs. This precludes a final conclusion on the magnitude of
total European derivatives clearing costs compared to total European securities
clearing costs in 2005.
In terms of benchmarking derivatives clearing to securities trading and
settlement costs, the estimates indicate that derivatives clearing constitutes
the most efficiently organised part of European financial market infra-
structure. The comparison shows that the exchange-related charges in the
European securities market (€1.9 billion) alone approached the combined
direct and indirect clearing-related costs in the European derivatives market
(€2.173 billion) in 2005. Taking into account that indirect costs are assumed to
exceed direct costs in securities trading, the all-in costs of European securities
trading can be expected to significantly exceed the all-in costs of European
derivatives clearing.
103
This assumption is not realistic. However, due to the lack of available research on the development of
these costs over time, no reliable assumption can be made as to how they evolved from 2002 to 2005.
104
Cf. Morgan Stanley/Mercer Oliver Wyman (eds.) (2003), p. 19.
105
Cf. Deutsche B
¨
orse Group (ed.) (2005a), pp. 14–15.
106
Referring to €475 million total clearing house charges for derivatives clearing in 2005, minus approxi-
mately €66 million fixed costs, as compared to €100 million in equities clearing in 2005 (assuming that
the estimates provided by the Deutsche B
¨
orse Group study only account for variable clearing house
charges).
180 Clearing Services for Global Markets
Similar findings apply when derivatives clearing costs are benchmarked
to securities settlement costs: whereas CSD/ICSD-related charges alone
amounted to roughly €1.4billion in 2005, the need for cross-border settlement
necessitates the involvement of additional service providers and intermedi-
aries, resulting in a further increase of direct settlement costs.
107
Given that
indirect costs are assumed to exceed direct costs in securities settlement, the
all-in costs of European securities settlement are expected to greatly surpass
the all-in costs of European derivatives clearing.
Tosummarise, the benchmarking strongly indicatesthat derivatives clearing
is the most efficient segment within the European market infrastructure.
This means that in terms of costs resulting from the interaction between
the infrastructure providers (exchanges, clearing houses or CSDs/ICSDs) and
their direct customers, the transaction costs related to derivatives clearing are
comparatively low. However, this conclusion falls short of actually quantifying
the different service levels and value-added functions provided by the different
infrastructure providers. Despite the interviewees’ suggestion that the value-
added function of a clearing house is superior to the value-added function of
an exchange,
108
the aforementioned benchmarking of costs fails to incorporate
the economic benefit of the services provided by exchanges, clearing houses
and CSDs/ICSDs. A final conclusion on which part of the European market
infrastr u cture is most efficient would require quantifying the benefits of these
services.
5.2.7 Cost reduction scenarios for clearing members
On the internal side you have things like consolidation of systems, consolidation of
teams, outsourcing, lower cost environments, developments in terms of efficiency
that is business as usual, as you would expect. We have to keep stripping our costs
internally and, if possible, externally.
109
107
Deutsche B
¨
orse Group (ed.) (2005a) estimates the costs allocated to custodians and local settlement
agents at €16 billion. Cf. Deutsche B
¨
orse Group (ed.) (2005a), p. 15. Whereas this figure indicates
significant intermediary costs, it has to be treated with caution, because it includes the costs incurred
by the intermediaries themselves for the provision of their services. Cf. European Commission (ed.)
(2006b) for a summary of studies that identify a sharp difference among the costs of cross-border
versus domestic settlement within Europe. Cross-border settlement charges are found significantly to
exceed domestic settlement costs. Deutsche B
¨
orse Group (ed.) (2005a).
108
‘I still believe that the clearing function is better value-added to the global industry than the matching-
engine function. Clearing organisations will have the features and the value added pieces that are
dramatically harder to build.’ Inter view with James G. McCormick.
109
Statement made by interv i ewed industry participant.
181 Analysing costs of derivatives clearing – transaction cost studies
External
Measures
Internal
Measures
Cost Reduction Opportunities for Clearing Members
Indirect Cost Reductions
Network Strategies between Clearing Houses
Realisation of Synergies
Outsourcing/Off-Shoring
Centralisation/Regionalisation
Internal Standardisation of Services
Increase Straight-Through Processing
RESEARCH
FOCUS
Industry-Wide Initiatives
Individual Clearing House Initiatives
Direct and Indirect Cost
Reductions
Figure 5.17 Classification of cost reduction opportunities for clearing members
Source: Author’s own.
I’m actually thinking away from the large brokerage houses because I think they could
be circumvented. Actually, I think that there are costs there that don’t need to be there
for large users of futures.
110
Whereas the previous sections analysed the core cost drivers of derivatives
clearing as well as the nature, characteristics and magnitude of clearing costs
for different clearing member types, this section delivers insights from the
expert inquiry on different opportunities for reducing clearing-related costs.
Interviewees identified different opportunities for clearers to reduce trans-
action costs. These opportunities can be classified as either ‘external mea-
sures’ or ‘internal measures’. External measures refer to initiatives that reduce
transaction costs that are beyond the clearing members’ direct control. Exter-
nal measures can affect direct and/or indirect costs. Internal measures refer
to actions launched and controlled by the clearers themselves to cut costs;
these initiatives are aimed at reducing indirect costs. Figure 5.17 provides an
110
Interview with Edward F. Condon.