Forex on Five Hours a Week: How to Make Money Trading on Your Own Time _2 pot
Bạn đang xem bản rút gọn của tài liệu. Xem và tải ngay bản đầy đủ của tài liệu tại đây (378.3 KB, 22 trang )
P1: OTA
c01 JWBT185-Horner October 24, 2009 15:4 Printer: Yet to come
Making Money in Up and Down Markets 7
So how do you profit from such a position, and why would anyone buy
it from you? The first part is easy. Since you borrowed the shares from
your broker, all the broker expects is that you return the shares to them.
It’s much like borrowing a book from the library. The library made you get
a card so you are “approved” to borrow a book, and they expect you to
return it. The broker in this case is typically going to let you have those
shares borrowed out for pretty much as long as you need them. When you
sold IBM, you collected a certain price per share from the buyer knowing
that at some point you are going to need to buy some IBM sooner or later
to return what you borrowed. Let me say that again, because here is often
where the wheels fall off the wagon for a lot of folks.
You sold your borrowed shares of IBM into the market, and the buyer
of those shares gave you, for sake of keeping this simple, $100 per share.
Now you have this $100 per share, and that’s half the equation here of this
short position. Now based on your analysis you think that prices should
head lower, and by golly, they do! $98 $93 $88 $87 $84 until
they level off at your target of $80. So you sold at $100 and prices sold off
to $80—a $20 difference. Remember, your broker wants their shares back
at some point, and you’ve decided today’s the day and $80 is the price. So
you execute another order. Your first order was a SELL. Your second order
is a BUY. This will allow you to realize the $20 profit and return the shares
of IBM back to your broker, thus closing out your short position. You sold
these shares at 100 and are buying them back at 80, so the difference is
yours.
I had also mentioned the “Why?” Why would someone buy these shares
from you? Well, that’s what is so wonderful about the markets. There are
always going to be contrary opinions. Without them there would be no mar-
ket. When I think I see a buying opportunity, there is someone out there
who thinks that I am out of my mind and that there is a selling opportu-
nity. Without both sides of the equation, buyers and sellers, there would be
no market; there would be no investing, no trading, nothing! So next time
you hear about someone shorting the market, remember, there had to be
a buyer for that trade to be done and without both types of market partic-
ipants there would be no liquidity. We’ll talk later about liquidity and how
the forex is the most liquid market on the planet and why that’s so impor-
tant to us as traders. For now though, I hope your mind is starting to see
the opportunity in playing both sides of the market.
And by the way, my shorting example of IBM has nothing to do with
anything happening in the market. I have been an investor in IBM for many
years. It is the first stock I ever owned. My father, a proud IBMer, worked
for them until the day he passed away.
P1: OTA
c01 JWBT185-Horner October 24, 2009 15:4 Printer: Yet to come
8
P1: OTA
c02 JWBT185-Horner October 24, 2009 17:26 Printer: Yet to come
CHAPTER 2
Full-Time
Trading =
Full-Time Job
Perspective my friends, keep your trading in perspective!
2007 “Fxstreet.com. The Forex Market.” All Rights Reserved.
I
don’t know about you, but I have never wanted to work on Wall Street,
or in an exchange, or for a bank, or be a fund manager, or manage
other people’s money for that matter (by the way, I tried it and hated
it). That’s not to say those are not important or fulfilling jobs. It’s just that
I have never been much of an employee. I’ve always wanted to work for
myself, and that really is just my way of saying I want to dictate when
and how hard I work. You’re probably not that different from me. Who
doesn’t want that freedom? That’s what trading is to me, freedom. There
are plenty of ways to make a good living in this world. But I can’t throw a
9
P1: OTA
c02 JWBT185-Horner October 24, 2009 17:26 Printer: Yet to come
10 FOREX ON FIVE HOURS A WEEK
90 mile-an-hour fast ball, I can’t sing or dance, and I always kick myself
for not thinking of putting bird seed in a balloon and selling it as a stress
relieving grip ball. Oh well.
So it ain’t just the money! Trust me when I tell you that trading is the
hardest way to make an easy living I can think of.
I am a part-time trader. I think that people who are employed as traders
are professional traders or full-time traders, but there goes your freedom
out the window. I have never been great at answering to anyone as my
mother will attest. And I do like to sleep in from time to time, as a few
of my friends will attest when they have called me in the morning only to
wake me up!
So really by that definition I am a part-time trader and darn proud of
it. Does that mean that I treat my trading as a hobby? Definitely not! But
consider that forex, which is the main topic of this book, is a 24-hour mar-
ket. I don’t know about you, but I like to sleep, cook, train, golf, play a little
Wii, read a book, maybe write a book, talk with friends, do a little blogging,
dive, ride my motorcycle, go out to lunch with friends, go fishing, travel,
you know, have a life! So obviously there are going to be times that I can’t
be in front of my computer and more often, don’t want to be!
Let me tell you now that I was not always so enlightened. When I first
started getting into trading, I was totally addicted. Addicted to the action,
the charting, getting my hands on everything and anything trading related,
and going at it 16 hours a day. No joke. And I’ll tell you the whole tale later,
but suffice to say, I’m a chart junkie. My trading wasn’t better with my eyes
glued to dual monitors. My friendships weren’t better, and I’m pretty sure
my husband thought I had lost my mind. Although he still might be holding
that opinion.
So I eventually unplugged and embraced the life of a part-time trader.
You can and should do the same.
There are a few things that will make it clear once you understand
them. Just a few simple things are all you are going to need. I will show
you how to use time frames to your advantage as well as the prime trading
times for each pair. I’m going to lay it all out for you.
The forex is a 24-hour market, so do full-time traders ever sleep?
Okay, so now you may be thinking, “Raghee, won’t I miss trades if I
only watch the market part-time?”
And I will answer, “Yeah. You, me, and everyone else.”
Even full-time traders have to sleep, eat, and well you know. And
believe me when I tell you that I have known quite a few traders with com-
puters in the restroom. So trading forex is all about picking your spots and
knowing when the market is most likely to move. This luckily is not com-
pletely unpredictable. Markets, like people, have a natural daily rhythm.
As a trader, I count on it. In many ways, trading forex is trading the
P1: OTA
c02 JWBT185-Horner October 24, 2009 17:26 Printer: Yet to come
Full-Time Trading = Full-Time Job 11
opinions of seven different financial centers: Sydney, Tokyo, Hong Kong,
Singapore, Frankfurt, London, and New York. These seven represent the
major financial centers around the world, and each has its own psychol-
ogy, volatility, liquidity, and rhythm. You can find a time to trade. It’s re-
ally going to be more a function of your personal schedule. I will tell you
though that all financial centers are not equal. Some are more important
(New York) and larger (London) than others. Since the six most traded
pairs are U.S. dollar–correlated (they reflect strength or weakness ver-
sus the greenback)—EUR/USD, USD/JPY, GBP/USD, USD/CHF, USD/CAD,
AUD/USD—the “best” trading time is the overlap between Frankfurt,
London, and New York which makes the forex “prime time” 7
A.M.EST
to noon EST. What if you can’t be in front of your computer then? I’ll show
you how to trade it anyway, and that goes for any financial center. With
proper and well-thought out order entry and a firm grasp of time frames
you can handle just about any market.
Just accept it now; you are going to miss the occasional trade. The
sooner you can come to terms with that fact the less likely you will chase
trades, and the less likely you are to revenge a trade. And if you didn’t know
it already, doing that will empty your trading account at a nauseating pace.
EMPLOYEE MINDSET
When you become a trader, you become your own boss. Now for entre-
preneurs or those of you with a natural entrepreneurial spirit, this will not
be a major adjustment. For those of you who have been employed by some-
one else for most of your adult life—I won’t kid you—that first step is a lulu.
Traders live in the results economy, which is to say that we get paid
not for time spent doing something but for results and results only. Believe
me when I tell you that the market does not care one bit that you or I spent
six months or a year learning how to trade, or that we spent the better part
of an evening analyzing charts or news and fundamentals or that you got
up at 2
A.M. to trade Europe. Notice I didn’t say “we” in that last sentence,
because I just don’t get up at those silly hours of the morning. Not being
rewarded for effort and time is difficult for many new traders, and the lack
of return for the hours can be very frustrating for the unprepared. So here
I am—preparing you. This is a particularly tough habit for people with the
employee mindset to overcome because time spent doing something is the
measuring stick they are familiar with. If that isn’t enough, there are other
considerations, too.
It’s not my objective to make trading sound simple and easy, because
it’s not. It’s not because the skill is particularly difficult, but rather that
P1: OTA
c02 JWBT185-Horner October 24, 2009 17:26 Printer: Yet to come
12 FOREX ON FIVE HOURS A WEEK
we humans love to complicate everything. There are challenges to trading
just as in any other skill you are trying to acquire. I mean really, who here
plays golf? Could anything be harder or more painful with the exception
of childbirth? If you don’t practice what I am going to teach you or think
you are going to buy a piece of software that tells you what to do, then
seriously, please give this book to someone who is going to use it.
All I am telling you is what I have learned the hard way. A smart person
learns from her own mistakes. A wise person learns from the mistakes of
others.
CONFESSIONS OF A CHART JUNKIE
I still love charts, and they are still my bread and butter to finding, setting
up, and managing trades. For every knucklehead who asks me: “You know
what you find next to a sunken ship?”
“I give up.”
“A chart.”
“Ha ha.”
I know that there is no way that trading news or fundamentals can
work, without an understanding of how much or how little the news has
been discounted into the market. So the battle lines are drawn: fundamen-
tal traders versus chartists. I don’t think it has to be that way. I think a
hybrid of each, knowing which to use when, is the ultimate solution. But I
didn’t always think that way.
My chart junkie ways started like most. An interest in learning how
to trade and a charting subscription sent to my home each Monday. This
was back when I hated weekends because the markets were closed. Yeah, I
needed help or at the very least a hobby. There was little else I could get my
hands on at this time in the history of mankind because there was really no
Internet to speak of, and those giant mochaccino-lands with books didn’t
exist. So it was me, glued to a fledgling channel hardly anyone watched
called the Consumer News and Business Channel and Schabacker’s “Tech-
nical Analysis and Stock Market Profits.”
I would sit for hours poring over about 30 end-of-day charts of the fu-
tures market. A pen and ruler and calculator was as sophisticated as it
got. Forget streaming data and intraday charts; this was old school. You
know there’s nothing like going over printed charts manually with pen
and ruler. If I sound like I am pining for the days of yore, I guess in some
ways I am.
But it wasn’t perfect. And I’m here to tell you that the bell curve of
your trading will follow a path similar to mine, similar to a lot of traders
P1: OTA
c02 JWBT185-Horner October 24, 2009 17:26 Printer: Yet to come
Full-Time Trading = Full-Time Job 13
and would-be traders. As with anything new and exciting, you can’t get
enough. Not unlike your first car, first home, first puppy, or new love. It’s
all-consuming, and that’s what makes it great. You’re going to dive headfirst
into that new charting software, demo trade the heck out of that new order
entry platform (and start convincing yourself that the practice trades are
real), read every book written on the subject of trading, attend seminars,
watch CNBC, and nod as though you understand most of it, discover dead
Italian mathematicians (Fibonacci), and probably start making a series of
the worst trades ever made. Then and only then will you really start to
learn. Sadly and typically, the pain must come first. Now, with your bruised
ego, you do all of the above again. Only this time there’s doubt and fear, and
that’s when you think that someone else has the answers. Here’s a quick tip:
They don’t.
Most traders want to know everything. Pursuing that is, of course, in-
sane. But we all get crazy for a bit, overcompensating for the fact that we
know that we don’t know nearly enough. As we begin to try and apply too
much, naturally we begin that process of whittling away what doesn’t work
and what we don’t understand. If we continue to do this, eventually we find
that we’re not looking to add but rather subtract until we find the handful
of studies, tools, and whatnot that will finally conclude our search of “what
works.” That’s closing the gate. Keep the stuff that you want out, and keep
what you need in.
The quicker you can recognize where you are along this bell curve,
the better and the sooner you can get to closing the gate, the closer you
will be to becoming a trader. That’s a fact! There is a common thought
that you should never stop learning, and it’s true, but knowledge is depth,
not breadth. Knowing more is not always useful, knowing better, knowing
deeper, with more understanding is.
It’s more tempting out there in the world of trading, investing, and the
markets than ever. Today’s streaming data is more affordable than ever,
and the charting platforms that you can find for free online are better than
the platforms I used 10, 12 years ago and paid $800 a month for. The indi-
cators are seemingly unlimited, fast, and instant. But you know what, most
traders still stink, I mean really stink: losers to the tune of about 90 percent
plus. So it’s not technology that’s going to make us better traders.
You can use my approach to trade any market and any time frame,
forex, futures, and stocks!
One of the biggest mistakes I see with traders is that they fail to un-
derstand that no market is an island. There’s no such thing as a market
that trades inside a bubble. Markets move one another and are connected
across so many fronts: forex to futures to stocks and back again. I don’t
consider myself just a forex trader. I trade futures, stocks, options, and I
do this not because with price I can level the playing field, get an unfiltered
P1: OTA
c02 JWBT185-Horner October 24, 2009 17:26 Printer: Yet to come
14 FOREX ON FIVE HOURS A WEEK
read on market psychology, and trade liquid markets. I do this because
it makes all my trading better. You’ll learn more about the futures-forex
connection when we discuss my Forex Market Pulse and the specific rela-
tionship forex has to the U.S. dollar, Dow Jones, crude oil, and gold.
ANALYZING THE MARKET
I’ve set up some pretty lofty expectations, haven’t I? So how serious am
I about doing this in approximately one hour a day? No joke. No hype. I
mean it. Time spent does not equate to success. In fact, I’ll go so far as
to say that if you were to reduce the amount of time you spend analyzing
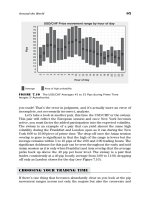
and trading—starting today—your returns would improve. Why? Well, Las
Vegas knows why. They don’t build billion-dollar casinos because they look
majestic in the desert. While almost everyone you and I know tells us that
they always leave Vegas a big winner, money in their pockets, someone has
got to be telling a whopper because I’m pretty sure that the water bill alone
at the Bellagio is enough to make my eyes cross. Now if you think I am
comparing trading to gambling, I am, just a little.
While it may be blasphemy in certain circles, comparing trading and
gambling there are similarities that it would do us good to notice. What I
have observed is the time spent sitting at a casino will eventually empty
your wallet if you don’t know when to walk away, and I don’t even gam-
ble. The fact that most traders don’t know when to stop does draw some
similarities to their gambling cousins. Is trading gambling? Sure, profes-
sional gambling. I’ve worked with a professional gambler; he was written
up in Forbes and was one of the most disciplined guys I have ever met. He
regulated his diet on days he worked, which is to say the days he would
gamble. He had a strategy, stop loss, money management the works! I
can’t dismiss that as merely gambling. There are trends in games like craps
just as there are trends in the EUR/USD or crude oil. Yes, I know there are
differences, but I think we can learn a lot from professional gamblers, and
I believe the main lesson is this, given enough time, the house will always
win. Not because they are better, but because they are patient and will play
every hand, every card, every roll. They know they are better funded than
you or I. And that alone lets them be wrong longer. They wait us out.
Gamblers make small decisions by noticing the small nuances. Who
hasn’t watched 14 hours straight of the World Series of Poker marathon
and noticed how the players size each other up? I’ve watched players at
the craps table, and they will vary their bets according to hot streaks—is
that much different than trading a trend? My point in all this is that much
P1: OTA
c02 JWBT185-Horner October 24, 2009 17:26 Printer: Yet to come
Full-Time Trading = Full-Time Job 15
of trading is psychological, and you are already in many ways equipped to
trade. You just don’t know it yet. So what are those nuances traders need
to notice to play the market? They are visual tools, but instead you will use
a price chart. Price is how we measure market psychology. It’s a gauge of
exactly what the buyers and sellers are thinking and doing.
So how do we know when to sit and play and when to watch? That’s the
key, isn’t it? Well, playing more is not the answer. Observing helps. So does
becoming a student of price action. Learn to watch price action without
feeling a compulsion to play. That’s discipline. The next step is knowing
when to rejoin the game. For us, traders, we can rely on financial centers
opening, closing, market overlaps, and scheduled news releases to signal
those times. That’s part of it. While we want to join the game at the right
time, the other half of the equation is the market behaving in a way that we
can capitalize on.
The three most common mistakes losing forex traders make are:
1. Risking too much on a single trade
2. Trading during the doldrums between the London close and Sydney
open and overtrading during Asia without regard to the European open
3. Trading at the moment of news releases
And those are just a few examples. But the topic here is how to analyze
the market quickly, and sometimes it’s just as effective to discuss what not
to do because you and I are going to spend the better part of the rest of this
book discussing what to do.
The lesson here is not that I want you to be Vegas or Wall Street; we
lack the capitalization. But I do want you to begin noticing what losers
do. Vegas, Wall Street they know what losers do, in fact they count on
them. Losers behave the same way. They congregate in little herds of losers
because they think and behave the same way. You know the old saying: If
you can’t find the sucker in the room, it’s you.
Knowing when you play or walk away is a function of knowing what
will make us act. I call them “decision levels.” The market seduces traders.
It’s a siren song that is hard to resist when you feel that the next price
could be a reason to act. The reason why Forex in Five traders will be
able to resist is that price becomes our ally; specific price will cue our
interest and begin analysis, and then, maybe, trigger a trade. Most traders
make knee-jerk reactions because they incorrectly believe that any and all
price moves are an invitation to trade. Watching the market this way is both
unproductive and exhausting. Knowing that you have a price at which you
have planned to act is instrumental to your success in trading.
P1: OTA
c02 JWBT185-Horner October 24, 2009 17:26 Printer: Yet to come
16 FOREX ON FIVE HOURS A WEEK
IDENTIFY THE TREND
You are not your entry strategy. If only I had a dime for every time someone
has told me, “I’m a swing trader” or “I am a breakout trader” or—and this
one is my favorite—”I am a contrarian.” Let me translate for you what each
of one of these trading statements really mean.
“I am a swing trader.” This actually has two different meanings. First is
“I enter trades and stay in them for anywhere from three to five days.” Okay,
interesting, but does that mean there is some kind of alarm you set—an egg
timer maybe—that goes off at a three- to five-day setting? And when it does
go off, is it a mad scramble to the exit button? How do you determine if the
trade is fully cooked at three days or five?
Second, and at least this one has more merit is “I am a trend trader.”
Frankly, I have fewer issues with this translation as it is a partial truth.
But first, how do you recognize a trending market? Sadly for most “swing
traders or trend traders” every market is treated and thought to be a trend-
ing market, which we know of course is just not the case.
“I am a breakout trader.” To a breakout trader the whole world is a
buy through a ceiling and a short through a floor. And if the markets were
kind enough to consolidate and break out with that much predictability,
everyone would be a trader, have six-pack abs, a full head of hair, and
children that clean their room after finishing their homework every night.
Breakout traders see the markets always as a coiled spring waiting to be
sprung, and while this is actually an effective strategy in a sideways market,
like any good strategy, it must start with the correct market cycle to be
applicable.
“I am a contrarian.” Here’s the translation. “I pick tops and bottoms in
trending markets mainly because I am not sure how to trade a trend and
follow it. Instead, I choose a subtle form of revenge trading, looking to buy
new lows and short new highs in between my hours of playing in oncoming
traffic because I missed the move in the cable from 1.7000 to 2.1000.”
The bottom line here is that you are not simply a swing, breakout, or
contrarian trader. You are all three, and the market will tell you when you
use which one if you know what to look for.
TIME FRAMES
Anytime someone asks me, “What’s such-and-such market doing, Raghee?”
I answer it by asking “Which time frame?” That must be the first considera-
tion. A five-minute chart could be behaving very differently from a one-hour
chart and different still to the four-hour or even the daily. The daily chart
P1: OTA
c02 JWBT185-Horner October 24, 2009 17:26 Printer: Yet to come
Full-Time Trading = Full-Time Job 17
is the most psychologically significant, but we should never assume that’s
where the trade or the action is! The easiest way to begin understanding
what it means to analyze any market across multiple time frames is to view
short time frames as the building blocks to larger time frames.
I trade forex off one of five time frames: the 30 minute, 60 minute, 180
minute, 240 minute and daily or end-of-day chart. Sometimes I’ll look at a
time frame as short as the 15 minute. But frankly, anything smaller than
that begins to make less sense when you factor in the cost-per-trade in
forex. With five, maybe six viable time frames to consider, there are not
only the individual market cycles to consider, but there are risk/reward
issues. Consider that daily charts, due to the fact that a single day’s trad-
ing will represent a wider range from high to low than a 30 minute or 180
minute time span can, inherently has more risk because of it. So it’s not
enough to find a trade on a specific time frame; you have consider the risk
that comes with it and whether the risk is appropriate for your account size
and risk tolerance.
No daily chart is going to trend higher or lower or consolidate with-
out the smaller, intraday time frames moving it there. That’s the heart of
the “brick by brick” philosophy. It takes two 15 minute candles to make a
30 minute candle, two 30s make a 60 minute candle, three 60s for a three
hour or 180 minute candle see where I’m heading? It’s the smaller time
frames that dictate the direction of the larger time frames; it’s cumulative.
For those of you who use multiple time frame (MTF) confirmation, this is
my reasoning for not using it.
I started out trading fully embracing the multiple time frame confir-
mation philosophy. I did it really for no other reason than I was told in
book after book, that it’s what I should do. So what is multiple time frame
confirmation you ask? Generally, it’s the process of confirming the overall
direction of a market with a comparatively larger time frame. For exam-
ple, confirming the direction of a 30 minute chart with the direction of the
180 minute or 240 minute chart. When you consider the “brick by brick”
philosophy, this is a backwards way of confirming market direction. Re-
member that moving from smaller time frames to larger time frames is
cumulative. Smaller time frames are the building block, the bricks, which
build the larger time frames.
At any given time there is a very good chance that each time frame
will have slight differences not only in direction but also the quality of that
direction. The 60 minute chart may be in an uptrend but the 30 minute’s
uptrend might be stronger or steeper or correcting to support better. It’s
these differences we compare to determine which time frame we will set-
up and trade. Here’s another point to consider. Once you choose the time
frame you will set-up, confirm, and manage the trade from that time frame
alone. Later on, we’ll be discussing market memory, and this will take care
P1: OTA
c02 JWBT185-Horner October 24, 2009 17:26 Printer: Yet to come
18 FOREX ON FIVE HOURS A WEEK
of many of the issues traders have when treating a time frame in this man-
ner. Most of the issues stem from a concern over not knowing all relevant
points, support and resistance, on the chart. It’s that feeling that you’re
not seeing everything you need to be aware of. Working from the market
memory, coupled with psychological numbers, will help take care of this
entirely.
There is some value in MTF, but I believe it’s limited to comparing in-
traday time frames to the overall or “daily” time frame. For many traders,
trading against the daily time frames is trading against the overall psychol-
ogy of the market. Now, if there is a clear direction on the daily, this cer-
tainly can be a filter. But it’s not a required one.
P1: OTA
c03 JWBT185-Horner October 24, 2009 15:12 Printer: Yet to come
CHAPTER 3
The Wave
The market is a 6
6
, 280-pound kickboxer that will smash
you. Don’t fight the market.
2006 “Fxstreet.com. The Forex Market.” All Rights Reserved.
I
f there is one indicator I cannot do without, it’s the Wave. It’s a simple
market cycle indicator: a trio of exponential moving averages based on
the Fibonacci number of 34. It provides me with a visual footprint of
the market’s trend, or lack of trend. It’s better than trendlines, support,
and resistance for this specific purpose. It’s not that trendlines, support,
and resistance are not effective but the fact is that these lines can be found
19
P1: OTA
c03 JWBT185-Horner October 24, 2009 15:12 Printer: Yet to come
20 FOREX ON FIVE HOURS A WEEK
in uptrending, downtrending, and sideways or range-bound markets, and
by themselves they do not indicate the market’s cycle.
So what’s the Wave? I’m not one for proprietary indicators, and any-
thing I use to analyze my charts can be done with some simple indicator
settings, all of which I will share with you. I will tell you why I use the set-
tings I use, and then you will have to go about doing the real work, which
is putting them on your charts and proving to yourself by watching how
these studies/indicators behave that you can trust them and will use them.
That’s no small task. I’m not your mother, so “because I said so” just isn’t
going to cut it.
While I am going to talk about the Fibonacci series of numbers and
their relevance to traders later on, let me just set the foundation quickly
here by saying that Fibonacci is a mathematical law of nature. You will find
that these numbers are not only accurate but consistent when it comes
to measuring the ebb and flow, the expansion and contraction, of nature.
Now do not confuse Fibonacci numbers with the popular trading tool Fi-
bonacci Retracement and/or Extensions. I will be using Fibonacci numbers
in a much more objective way in this book. Much of what makes most
traders shy away from using Fibonacci is their assumption that it’s the
Retracements and Extensions or nothing. That method of using Fibonacci
is and will always be very subjective, and subjectivity is something we want
to come as close to eliminating from our analysis as possible. While there
are aspects of the Wave and “clock angles” that will entail a very small de-
gree of subjectivity, if you follow the steps I am about to share, you will
substantially reduce the likelihood of seeing things “wrong” and make this
tool as visually objective as possible.
It’s not going to be enough for me to tell you that the Wave is created
by three 34 period exponential moving averages, one set on the high, one
set on the low, and one set on the close. That would be like my giving you
three ingredients for a recipe without telling you how to prepare them. The
preparation is everything. Let’s first tackle how you are going to set this
trio of moving averages up.
You will need a platform that will allow you to set-up multiple expo-
nential moving averages. Why exponential? Well, first moving averages are
simply taking a set number of highs, or lows, or closes and creating an
average and plotting that number on the chart. If your setting is a 34 pe-
riod on the close, then you are taking the last 34 closes, adding them up,
and then dividing that by 34. You get a single plot. It’s the accumulation of
those plots that make the lines you see going across the chart. That straight
average is known as a “simple” moving average or SMA.
But I said we were going to use an “exponential.” So what’s the differ-
ence? Exponential is a little “smarter” in that is takes that average of highs,
P1: OTA
c03 JWBT185-Horner October 24, 2009 15:12 Printer: Yet to come
The Wave 21
or lows, or closes, but instead of a straight average, it weighs more recent
price action so that it is more reflective of the current mood of the market.
How does it do that? Take a look:
EMA =
p
1
+(1 −α)p
2
+(1 −α)
2
p
3
+(1 −α)
3
p
4
+···
1 +(1 −α) +(1 −α)
2
+(1 −α)
3
+···
Can I tell you just how glad I am that my charting platform does the
work for me?
Essentially, what you are getting is a line plotted across your chart that
takes into consideration that recent price action is more important than
older price action and plots the lines accordingly. So the net visual effect is
that if prices are currently more volatile, the exponential moving average
(EMA) will reflect that, and if prices are consolidating, that will be factored
in. I use exponential moving averages instead of simple because I feel that
they better reflect the current market psychology without losing the overall
feel of what has already happened.
I also mentioned that you would need a platform capable of setting this
up. Again, these studies, or indicators, are fairly basic settings that even an
entry-level charting platform should be able to easily produce. Your charts
and data are your view into the market, and this is not the place to get
cheap or apathetic. That’s not to say you cannot find a quality, free chart-
ing platform. Forex traders all over the world use a very good one called
MetaTrader4 or MT4. I do have MT4, however, my primary charts and data
come from eSignal. Use whichever or whatever you want, but let me add
that there is a difference between charting and charting/data. eSignal is a
data provider, MT4 is a charting platform that relies on brokerage data. Let
me digress here for a moment because I think it’s important that you un-
derstand the difference, and this is specific to the foreign exchange market
and data in this “non-exchange” arena. This will slightly alter how your in-
dicators are plotted, how your buy and sell prices are quoted, and account
for the differences you will see from platform to platform and from broker-
age to brokerage.
eSignal provides what’s known as composite data. This means that
they have multiple contributors that make up their feed. In the case of
eSignal there are over 200 contributing banks, institutions, brokerages, and
corporations that make up their feed. I am simply using eSignal as an ex-
ample. There are other composite feeds out there– this is just the one I
personally use. Now contrast this with MT4, which is a robust charting
platform that relies on an outside data feed, most commonly a broker-
age feed. So with MT4 you are getting the feed from a single source as
P1: OTA
c03 JWBT185-Horner October 24, 2009 15:12 Printer: Yet to come
22 FOREX ON FIVE HOURS A WEEK
compared to the composite feed with multiple sources. This data feed is-
sue is unique to forex.
The foreign exchange does not operate from an exchange like stocks
do or even commodity futures. Stocks trade from exchanges such as the
NYSE or NASDAQ. The exchange sets certain requirements and also facili-
tates the execution of the vast majority of trades in the stocks that trade on
them. This means that the price you see is the same that everyone else is
seeing. Same goes for futures. Since the forex is “off exchange” there is no
single entity that facilitates most or all executions of buy and sell orders.
Instead, your brokerage either directly deals with you or provides you with
access to liquidity providers through their internal network. This means
that there is no standard, no way you could possibly see or have access
to all the different liquidity providers or bids and asks that are available.
However, most of the bid and ask quotes are typically within a few pips of
the best, also known as the “inside” price. “Inside” is just another name for
the current lowest ask price or current highest bid price.
There will inevitably be situations where one feed will have slightly
different open/high/low/close prices, and since technical studies are cal-
culated using the O/H/L/C, there can be some variance from platform to
platform. Also consider that your execution price will vary slightly from
broker to broker, but before you start asking me, “Who’s the best broker?”
there is no broker that always has the inside bid or ask.
Now that you have some background of charts, pricing, and how that
affects the indicators we will use, remember that it’s not a problem as much
as it is simply the reality of trading the forex. Accept it and move on. In the
big scheme of things, this is not going to be an issue.
Once you plot the three lines of the Wave, which again are:
1. The 34 period exponential moving averages on the high
2. The 34 period exponential moving averages on the low
3. The 34 period exponential moving averages on the close
you can begin interpreting price action. Remember, the Wave is
a market cycle tool first and foremost. Later, when I discuss what I call
“Lazy Days Lines,” we will look into using the Wave as dynamic support
and resistance.
The Wave is best and most easily interpreted by using what I call “clock
angles.” We are comfortable with the visual of telling time on a watch, even
when it has no numbers. We simply have trained our eyes to notice the
angle to see the distinction between a two o’clock and three o’clock angle.
I’m counting on this for Wave interpretation. When we work with visuals
that we are already familiar with, we can shorten the learning curve.
P1: OTA
c03 JWBT185-Horner October 24, 2009 15:12 Printer: Yet to come
The Wave 23
SINKING, SOARING, OR SIDEWAYS?
Real-time trend identification is vital to all traders. I don’t know about you,
but I don’t want to wait for two, three, or four touchpoints to develop so
I can identify a trend or wait for a channel to triangle to completely form
before I can begin to decide if the pattern is occurring in a sideways market.
It takes too much time, we give up too much potential profit, we end up
being among the last to the party, and worse still there is no definitive way
we can say that the lines and levels we are watching are occurring in the
correct market cycles. Those are the issues all traders deal with on a daily,
if not hourly, basis.
The main issue is this: Before beginning any analysis we must iden-
tify the direction of the market. This is no small task to do in real time
across multiple time frames. The Wave is the only tool I know of that can
do this. Frankly, because most traders don’t know how or know of any tool
to be able to confidently recognize a trend, they simply don’t discuss it and
therefore apply their strategies somewhat randomly. Swing traders treat
all markets as trending; momentum traders approach all markets as range-
bound. You get the picture. If all you have is a hammer, the entire world is
a nail.
MARKET CYCLES
Market cycle analysis is nothing new. When I first began learning how to
trade, most of the books and articles I read were written in the early 1900s.
Richard Schabacker and Charles Dow were my teachers. I have always
thought that the basic gears of the market are basically unchanged. These
men lived in a time before much of the regulation we see now in the finan-
cial markets, before computers and systems, before streaming data and
charting, yet the reasons why what they did still works is because human
behavior remains the same no matter what kind of technology is wrapped
around it. It doesn’t take long before the successful trader realizes that at
the core of trading is understanding her own mind and understanding the
mind of the market.
Specifically, when it comes to market cycles, we’re talking about the
mind of the market. The market is a gauge of psychology. Price does not
represent the actual worth of a company or commodity or currency but
rather the perception of its worth. This perception is affected by eco-
nomic releases and fundamentals, and discounting these into price. Now if
you think that somehow by not exhaustively researching this type of data
you’re missing something, think again. All this is represented in price, and
price action creates the cycles of the markets.
P1: OTA
c03 JWBT185-Horner October 24, 2009 15:12 Printer: Yet to come
24 FOREX ON FIVE HOURS A WEEK
Cycles are representative of the psychology of the market. When
traders and investors are greedy, markets rally. When they are fearful, mar-
kets fall. When they simply don’t know what to think, markets consolidate.
It is vital that we understand this rhythm because it is how we will decide
how to enter the market.
All strategies are based upon an underlying market environment. There
are just four environments or cycles:
1. Accumulation
2. Distribution
3. Mark up
4. Mark down
Accumulation is one of two varieties of sideways markets. You’ll have
an easy time knowing the difference once you understand the psychol-
ogy behind it. Accumulation is the quiet market—it’s on the back burner.
There’s likely little news or traders are waiting on news and no one wants
to be the tall poppy. The range is narrow as the market creeps along
sideways. What’s narrow? Remember, narrow is relative to the market’s
current range and typical personality. Each pair has a unique price action
behavior so what would be narrow on, for example, the USD/CAD can be
very different when compared to the GBP/USD.
When you look at accumulation markets, the Wave should be sideways
or traveling at what I call “three o’clock.” That’s right, just like the minute
hand on your watch or a clock. When the Wave is traveling sideways you
have a visual confirmation of the fact that prices are not trending higher
or lower but rather have found a balance between support (buyers) and
resistance (sellers).
Distribution is the second type of sideways market. The psychology
behind distribution is not as simple as that of accumulation as the psychol-
ogy behind it involves two distinct groups. Most commonly distribution is
associated with the exhaustion of an uptrend and the turmoil often seen
once a group of traders exit the markets as another group buys into the
selling. What is different however is the fact that the move essentially is
over or at stalling and therefore the market cycle “turns over” from the
trend to a sideways direction.
Since there is not a bullish bias in forex as there is in stocks and fu-
tures, and by bullish bias I mean a predisposition to buy and look for an
increase in the value of the market, you can also find distribution at the
end of a downtrend as well. Again, it is simply representative of one group
of traders exiting the market while another gets in, believing the trend is
still in place. Regardless of where the cycle occurs, it is very much the
P1: OTA
c03 JWBT185-Horner October 24, 2009 15:12 Printer: Yet to come
The Wave 25
collision of buyers and sellers, and it’s this collision that creates a more
volatile and wider range. When the market enters distributions, the main
difference you will notice, as compared to accumulation, is the volatility.
The Wave will be sideways but can travel not only at the three o’clock angle
but also at what is known as a “two to four o’clock angle.”
Two to four o’clock angles are unique to distribution and are more
easily identified by what they are not rather than what they are. Let me
explain. If a market is trending, it will be doing so at either a twelve to two
or four to six o’clock angle. We already know accumulation is three o’clock.
This means that its price action is sideways and the Wave is attempting to
transition to three o’clock but is unsuccessful. We can be on the lookout
for the two to four o’clock angle. It can’t be flat, and it can’t be trending. So
essentially, it is a process of elimination, and we identify this two to four
o’clock by what it’s not.
A few other things to look out for on sideways markets, whether it be
accumulation or distribution, is solid support or resistance. “Solid” simply
means that the touchpoints that make up the horizontal or static level are
within five pips or less. More than five pips and the level can still be con-
sidered static, but now it would be “soft.”
Transitions between any of the four cycles are probably the toughest
to deal with. These transitions will look as though one cycle is ending and
another is possibly beginning. This is where you are most likely to want
to have some sort of definitive way of saying that a new cycle is now set.
But it’s not that easy. It’s not going to be as easy as my saying count three
candles and if all three are traveling at the set clock angle you can say the
transition is complete. But I just did, but that’s not all I want you to do. It’s
more than the mechanics of counting candles. You must develop a feel for
the rhythm of the market, and I know with time and practice you will. The
market is just not that mysterious. It’s not more mysterious than human
behavior, and while humans are certainly entertaining, we’re nothing if not
predictable, and thus so is the market.
Mark up is just a fancy way of saying uptrend. Uptrends should be
defined by support, which is a series of lower highs. Support is the key
to maintaining an uptrend even within the context of pullbacks. Pullbacks
or corrections are part of a healthy trend, and it’s these moves lowering
within an uptrend that actually help perpetuate it. Think about it a moment.
If you are waiting for an opportunity to buy into an uptrend, first I must say
“kudos” because most people just buy the new highs and that is not an
effective way to enter a trend. But if you are one of those smart and patient
few who wait for a correction to enter a trend, then you know by your
acting—buying into the market—you are in effect supporting the uptrend.
An uptrend can be identified by the Wave traveling up at twelve to two
o’clock. Once the trend is underway, it will probably seem unnecessary to
P1: OTA
c03 JWBT185-Horner October 24, 2009 15:12 Printer: Yet to come
26 FOREX ON FIVE HOURS A WEEK
confirm an uptrend with the Wave, but please do not let your guard down.
It’s the slight nuance in the Wave, the transitions I explained earlier, that
are so important to notice. The initial sign of an uptrend, its very earliest
stages, are probably the most difficult to recognize without the assistance
of a visual tool like the Wave. So make and keep the good habit: Confirm
all trends consistently—no matter how obvious the trend may look—with
the Wave’s clock angle.
Confirmation of an uptrend being intact within the corrections that oc-
cur can be easily done with the Wave. Look for prices to respect the sup-
port of the three lines of the Wave, most especially the bottom line. If prices
break down through the bottom line of the Wave while moving up at twelve
to two o’clock, that’s the first sign of transition or a potential turnover.
Mark downs, surprise, surprise, are a downtrend. The Wave angle you
are looking for here is four to six o’clock. Downtrends are evidence of fear,
and fear creates selling. Pullbacks within an uptrend are selling as well,
but this is profit taking, and if it is true profit taking and the uptrend is
intact, the lower prices of the correction will invite buying. Downtrends are
different in their psychology because the emotion is much more extreme.
People sell when they are fearful, and fear can come from bad news (most
common) but also uncertainty. When in doubt, most traders will get out.
When it comes to downtrends, gravity applies. Prices fall much faster than
they rise. Because of this it is especially important that you stay sharp when
waiting for bounces within the four to six o’clock Waves.
Trends in the forex are not as straightforward as trends in what I will
call “single markets” like stocks and futures. If I am trading a stock, the
price reflects the rise or fall of the perception of value of that company.
The same can be said for commodity futures. If the market generally sees
the value of crude oil is going up, it will generate buying. The consideration
to buy or sell is determined by a single entity. It’s different when you are
trading forex pairs.
They are called pairs for a reason. You are trading a relationship be-
tween two currencies. Uptrends and downtrends are not necessarily re-
flective of fear and greed in the way they are in “single markets.” Let’s ex-
amine this because it’s very different from the way most markets operate,
since there are two separate markets that are being compared, and it’s the
relationship between the two that is traded.
To understand trends in the forex market, we have to break down the
pairs into the base currency and the second currency, so that we can un-
derstand on which half of the pair the fear is and which half of the pair the
greed is. Pairs are quoted in a specific way, and for the purposes of Forex in
Five trading and keeping with the most traded pairs, we discuss the same
six pairs I listed earlier, the U.S. dollar–correlated majors and comm dolls.
P1: OTA
c03 JWBT185-Horner October 24, 2009 15:12 Printer: Yet to come
The Wave 27
EUR/USD. The euro is the base currency here, and the U.S. dollar is
the second currency. When looking at quotes of the EUR/USD, also called
the “fiber,” you are seeing how many U.S. dollars you will need for each
euro or conversely how many euro you will get per U.S. dollar. So if the
quote is 1.2600 that means you need 1.26USD for each euro. An uptrend in
this market reflects a strengthening euro and/or a weakening U.S. dollar. A
downtrend reflects a strengthening U.S. dollar and/or weakening euro.
USD/JPY. The U.S. dollar is the base currency in this pair and the
Japanese yen is the second currency. This pair is most often called the
“dollar-yen.” When this pair is trending up, it is reflective of a stronger U.S.
dollar and/or a weakening Japanese yen as higher prices reflect that the
U.S. dollar gets you more yen. Lower prices indicate that the yen is stronger
against the U.S. dollar or that the dollar is weaker against the yen.
Realize that one side of the pair can be enough to move prices higher
or lower. The Japanese yen does not necessarily need to strengthen for the
U.S. dollar to be weak against it a simple move lower on the U.S. dollar
would be enough. This is why data from each country involved in the pair is
important and impactful. Additionally, because all the pairs have one thing
in common—the U.S. dollar—the U.S. market and data coming from the
United States is going to affect market psychology for these pairs.
GBP/USD. The British pound/U.S. dollar is called the “cable.” Traders
seem to have a habit of giving everything a nickname. By now hopefully
you are starting to see that the first currency in the pair is the base currency
and when paired with the U.S. dollar, higher prices indicate base currency
strength and/or U.S. dollar weakness.
USD/CHF. The U.S. dollar/Swiss franc is another pair where the U.S.
dollar is the first or base currency. When the U.S. dollar is the base, then
higher prices equate the U.S. dollar strength and/or second currency weak-
ness, in this case the Swiss franc. When the “swissy” is trending higher, that
means that each U.S. dollar is worth more and more Swiss francs. A lower
trending swissy indicates Swiss franc strength and/or U.S. dollar weakness.
So as we round out the final two pairs, both of which are comm dolls,
we can see that the USD/CAD (also known as the “Canada”) has the U.S.
dollar as the base currency, and the AUD/USD has the U.S. dollar as the
second currency. Since these currencies have a relationship with both the
U.S. dollar and also a commodity, I refer to these as “split personality”
pairs. There will be a triangular relationship. For example, the AUD/USD
(Australian dollar/U.S. dollar) has of course a relationship to the U.S. dol-
lar, but it also has a relationship to precious metals, namely gold.
We can add a seventh pair to this list with the NZD/USD (New Zealand
dollar/U.S. dollar) pair as it moves very similarly to the “aussie” and has a
comm doll relationship to the same commodities as the aussie. Additionally
P1: OTA
c03 JWBT185-Horner October 24, 2009 15:12 Printer: Yet to come
28 FOREX ON FIVE HOURS A WEEK
you will see a relationship to the Continuous Commodity Index. Frankly,
it is almost impossible to look at the forex market without considering
secondary cues and confirmation from the commodity futures market. I
certainly use these to my advantage, and I will teach you to do the same a
little bit later. I consider myself lucky to have started my trading career in
the futures market, and I encourage all forex traders to use this connection,
since it is one that when correctly applied will give you more understanding
of price action in the most widely traded forex pairs.
A WISH
If there is only one thing you get (I do sincerely hope you get more than
that) out of this book, it’s the concept of market cycles. It’s my wish that
when you think of me, you think, “Yeah, that’s The Wave girl and her mar-
ket cycles.” I hope you get so sick of me talking about them that you are
bludgeoned into using them! I hope that you see that unless you know what
cycle your strategy was designed for, your success will be hit or miss.
I hope that you take the time to understand what cycles your strategies
are designed to take advantage of and also your indicators. There is not a
more important concept than this, and the great part is that it will work and
improve anyone’s trading because it applies to every type of entry there
is. Most of the time when I see traders struggling, it’s because they don’t
know when to apply a particular strategy. They continually feel like they
are buying when they should be selling and selling when they should be
buying! And that’s because oftentimes they are!
Market cycles let you know the difference between a correction and a
reversal. They let you know whether a support or resistance level should
be bought or sold. They let you know when the market is range bounce
waiting for a breakout and when you should trend follow. I am standing on
the shoulders of giants whose words seem to have been lost or forgotten
by too many traders. I hope that you will see that the single best thing you
can do right now, at this exact moment, is understand that without first
identifying the cycle of the market, you are at best simply guessing at how
you should trade the market.
MARKET MEMORY
This is a simple concept and one rooted firmly in trader psychology. It
is also vitally important that you use this concept when setting up your
trades, finding support and resistance, significant highs and lows, and last