Forex on Five Hours a Week: How to Make Money Trading on Your Own Time _6 pot
Bạn đang xem bản rút gọn của tài liệu. Xem và tải ngay bản đầy đủ của tài liệu tại đây (1.38 MB, 22 trang )
P1: OTA
c07 JWBT185-Horner October 24, 2009 19:6 Printer: Yet to come
Around the World 95
0
5
10
15
20
25
30
35
40
45
50
55
60
65
70
75
0
1
2
3
4
5
6
7
8
9
10
11
12
13
14
15
16
17
18
19
20
21
22
23
Average Area of high probability
USD/CHF Price movement range by hour of day
Hour of Day
Pips
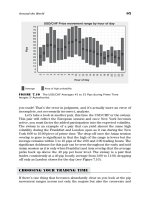
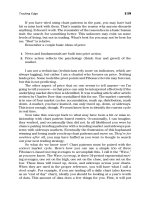
FIGURE 7.10 The USD/CHF Averages 45 to 55 Pips during Prime Time
Images © Autochartist.
you trade! That’s the error in judgment, and it’s actually more an error of
incomplete, not necessarily incorrect, analysis.
Let’s take a look at another pair, this time the USD/CHF or the swissy.
This pair will reflect the European session and once New York becomes
active, you must factor the added participation into the expected volatility.
The swissy is an example of a pair that can yield almost the same high
volatility during the Frankfurt and London open as it can during the New
York 8:00 to 10:00 piece of prime time. The drop-off once the Asian session
overlap is gone is significant in that the high of the range is lower but the
average remains within 5 to 10 pips of the 2:00 and 3:00 trading hours. The
significant doldrums for this pair can be seen throughout the early and mid
Asian session as it is only when Frankfurt and Asia overlap that the average
picks back up above the 40 pip per hour level. The swissy is a pair that
trades consistently at a 40 pip hourly average from 2:00 to 11:00, dropping
off only as London closes for the day (see Figure 7.10).
CHOOSING YOUR TRADING TIME
If there’s one thing that becomes abundantly clear as you look at the pip
movement ranges across not only the majors but also the cross-rate and
P1: OTA
c07 JWBT185-Horner October 24, 2009 19:6 Printer: Yet to come
96 FOREX ON FIVE HOURS A WEEK
comm-dolls, it’s this: the hours between 8:00 and 10:00 are consistently the
most active. That makes the overlap between Frankfurt, London, and New
York prime time. That also means that much of your follow-through for
trades will occur during these hours, but that doesn’t necessarily mean the
bulk of your entries will. For 15-, 30-, and 60-minute charts, these hours are
the best to trade. But if you are trading longer-term intraday time frames
like the 180 and 240 or the end-of-day time frame, these two hours will be a
blip on the overall radar since the sheer size of a three- or four-hour chart
and most especially a daily chart will swallow up the volatility of a mere
two hours of trading.
The pros of the Asian session are that new traders are not likely to take
big hits when they are wrong if they understand that the Asian session is
not as volatile as the European, U.K. or U.S. session and adjust their risk
and rewards expectations accordingly. The problem is not the session but
the expectations of follow-through that the session typically provides. With
the Asian session, there is the added knowledge that each day as Europe
enters the market it begins what could be a significant reversal. It’s best
then for a trader to leave protective orders in the market that will account
for this if there is an open trade going into 2
A.M. EST. I’ll be talking at
length about Stop Loss Placement in Chapter 12.
P1: OTA
c08 JWBT185-Horner October 26, 2009 17:15 Printer: Yet to come
CHAPTER 8
Market Pulse
Always respect the market, but don’t fear it!
2006 “Fxstreet.com. The Forex Market.” All Rights Reserved.
T
he forex market pulse is something that came from my background
as a long-time futures trader. Long before trading pairs, I was trad-
ing currencies in the futures market. I was also trading other pairs
like the Dow minis, gold, crude oil, and the U.S. Dollar Index among many
others. I was already familiar with their trading behavior, so it didn’t take
long to discover that there were correlations that affected the forex pairs. I
already knew that markets like gold and crude had an effect on the dollar,
and since the dollar was half of each of the major pairs and commodity
97
P1: OTA
c08 JWBT185-Horner October 26, 2009 17:15 Printer: Yet to come
98 FOREX ON FIVE HOURS A WEEK
currencies, I felt that by bringing over my existing futures knowledge I had
an edge. That’s what I will share with you now.
I want to caution you that if you do want to use these charts you will
need a futures feed. I will offer some alternatives to real-time feeds that can
be costly. My favorite is www.quote.com mainly because the same symbols
you see me use on the charts in this section can be typed in letter-for-letter
in Quote.com, and you can get produce overlays there too. I also want to re-
mind you that these are secondary correlation charts. What I mean by that
is that the primary chart should always be a chart of the market you are
actually setting-up to trade, which means that these market pulse charts
are not the primary reason you should be buying or selling anything. They
are effective as confirmation, and while they should be tracked daily, they
should not supplant the market cycles and chart set-ups on the pairs them-
selves. Far too often after learning about the market pulse, I will see traders
short the EUR/USD simply because they feel the U.S. dollar is going up, for
example. This is incorrect not because their thinking is wrong but because
the only reason you should be short anything is because your analysis is
pointing to a bearish direction for price. Got it?
What I will share in the following charts are the relationships to be on
the lookout for. Now you can choose to do these daily on your own, or
you can refer to the chart I post at my personal blog ragheehorner.com for
insight into the overall direction of the market pulse. I do this weekly at
the site, and this alone can begin to give you insight and the edge that only
the market pulse can provide. Each pair has a correlating chart, sometimes
two, but there is typically a primary correlation, and that’s the one you
want to keep an eye on.
The U.S Dollar Index is the main market pulse chart. It is a futures
contract that measures the performance of the greenback against a basket
of other currencies, and this contract is traded on the New York Board of
Trade.
You can find out more about this index at />blog/?page
id=468. This is the market that affects the most currencies and
the one that is affected by the other market pulse charts. When you look at
the dollar, you must consider the effects of higher or lower crude oil, gold,
commodities index, the Dow, and Fed Funds as these all impact the direc-
tion of the dollar and therefore are supporting cast in the overall scheme
of things. That does not mean that the crude, gold, commodities index, and
Dow are not worthy of primary correlations, but with specific pairs. The
U.S. dollar, since it is half of each of the most traded pairs in forex, has a
correlation to most of the pairs you will trade on a regular basis.
The most direct correlation between two charts has to be the relation-
ship between the U.S. dollar and the EUR/USD. This is almost a move-
to-move relationship that all traders who are setting-up a trade on the fiber
P1: OTA
c08 JWBT185-Horner October 26, 2009 17:15 Printer: Yet to come
Market Pulse 99
04 2516 06
Jul Aug Oct Nov Dec SepOct Dec Feb
70.000
72.000
91.80
74.000
76.000
78.000
80.000
82.000
84.000
86.000
88.000
(DX A0 - US DOLLAR INDEX FUTURES,D) Dynamic,0:00-24:00
(JPD A0-FX - JAPAN YEN COMPOSITE)
Feb Mar Apr MayJunJul
27 1708 2919 1031 2111 0324 1405 261607 28 18 0829 2010 0122 1202
85.346
FIGURE 8.1 Directional Correlations between the USD/JPY and U.S. Dollar Index
© eSignal, 2009.
should consider. Notice that it’s an inverse correlation, though! Support
or resistance in the U.S. Dollar Index does translate into levels that can
blindside a forex trader if she does not know they are there. The correla-
tion is inverse, which means that when the U.S. dollar is in an uptrend the
EUR/USD is heading lower as shown in Figure 8.1.
Think about what the quote means in this pair. The current price the
EUR/USD was trading at when this screenshot was taken was 1.2851. This
means something very tangible. It means that each euro is worth $1.2851 in
dollars. Or think of it as if we jumped on a plane to Paris and wanted euros.
For each one, we need 1.28 in dollars. If we were returning to the United
States with a pocketful of euros, we would get 1.28 in dollars for them.
As the dollar gains in strength, it has more buying power, and this
yields more euros on exchange. Remember “forex” is the foreign exchange!
The increase in trading volume in this market is not just speculative; it’s
caused by the increase in international business and trade. And despite
any protectionist talk out of Washington, this exchange of one currency
for another, as companies do business abroad, is not going anywhere.
P1: OTA
c08 JWBT185-Horner October 26, 2009 17:15 Printer: Yet to come
100 FOREX ON FIVE HOURS A WEEK
04 25 1606
Jul Aug
U.S. Dollar Index and USD/JPY
Oct Nov Dec SepOct Dec Feb
70.000
72.000
91.80
74.000
76.000
78.000
80.000
82.000
84.000
86.000
88.000
(DX A0 - US DOLLAR INDEX FUTURES,D) Dynamic,0:00-24:00
(JPD A0-FX - JAPAN YEN COMPOSITE)
Feb Mar Apr MayJunJul
27 17 0829 1910 3121 1103 2414 0526 1607 28 1808 2920 1001 2212 02
85.346
FIGURE 8.2 As the Dollar Strengthens, the Yen Weakens Against It and Heads
Lower
© eSignal, 2009.
When the EUR/USD moves, the direction can be gauged from two
countries. Bullish news and events out of Europe move this pair higher
on the charts as the euro gains over the dollar, while bullish news from the
United States pushes this chart lower. Now there will be times where there
is neither bullish news or bearish news coming from other countries, and
the pair will move regardless because in the end it’s the comparison of cur-
rent and future expectations for each currency that allows one currency to
gain strength against the other.
The U.S. dollar and USD/JPY pair does not have a consistent relation-
ship. Later when we look at the Dow and USD/JPY, you’ll see an example
of a better more reliable correlation. In Figure 8.2 you will see that from
July to December/January the direction was sympathetic as the two mar-
kets moved together. Unlike the dollar and fiber, which has a strong but
inverse correlation, the dollar and dollar-yen can be at times sympathetic
or inverse. This makes this relationship unreliable and one that, while it
cannot be ignored, needs to be watched closely for the current relation-
ship to be identified. Notice that it does change and hold the relationship
P1: OTA
c08 JWBT185-Horner October 26, 2009 17:15 Printer: Yet to come
Market Pulse 101
(DX A0 - US DOLLAR INDEX FUTURES,D) Dynamic,0:00-24:00
(JBD A0-FX - BRITISH POUND STERLING COMPOSITE)
14 28 12 26 09 23 07 21 04 18 01 15 29 13 27 10 24 08 22 05 19 02
May Jun Jul Oct Nov Dec 2009 Feb
72.000
1.4785
74.000
76.000
78.000
80.000
82.000
84.000
86.000
88.000
Aug Sep
85.346
FIGURE 8.3 Correlations Are Not Fixed and Can Change under Different Circum-
stances!
© eSignal, 2009.
for some time when it shifts. In the span of time represented on the chart,
each shift held for about four to six months.
The chart of the dollar-yen trends higher when the dollar advances
against the yen and also when the Dow strengthens as well. We’ll look
at the relationship with the Dow later. The quote tells us how many yen
each U.S. dollar will get. Currently that’s 85.346 yen per dollar as shown in
Figure 8.3.
The U.S. dollar Index and the cable have an inverse relationship akin
to the cable’s cousin, the fiber. I often will refer to the GBP/USD as a drama
queen because it will not only move inverse to the dollar’s action but will
do so in a more emphasized manner. Correlations must be measured by
direction (sympathetic or inverse) and scale. Some pairs will simply move
more (or less) than the dollar (or whatever the correlation market is) would
suggest. The cable moves more. It’s the amplitude that sets it apart; the
increased magnitude of the moves inverse to the dollar. It’s typically far
more than the fiber’s reaction.
P1: OTA
c08 JWBT185-Horner October 26, 2009 17:15 Printer: Yet to come
102 FOREX ON FIVE HOURS A WEEK
Notice that I circled an area on Figure 8.3 to remind you that any corre-
lation can adjust over time. Sometimes the relationship is strong, and other
times factors within one or both of the individual countries of the pair can
impact the degree to which they move against one another. There are times
when both countries can have strong fundamentals driving the currency’s
strength, simultaneously. In these environments it’s not a question of weak
versus strong but instead which is weaker or which is stronger. Remember
we are trading a pair, which means two individual things, and for a forex
trader this means the impact of two countries’ sentiments, data, events,
politics, and policies. Forex is a comparative market! So right away you
can see why I say these are important correlations to know about but that
they are secondary to the actual chart of the pair itself.
The quote on the cable represents how many dollars you need for each
pound sterling. In this case each “quid” will run you 1.4785 in U.S. dollars.
The downtrend of the cable on the chart shows the weakness of the quid
and the simultaneous demand (strength) for the dollar. In the example of
both the GBP/USD and the EUR/USD, you will notice that the pairs both
have the USD as the second currency. Within the pair you can switch the
placement of the symbol. In other words the GBP/USD is always going to
have the GBP first and the USD second. The GBP is the base or first cur-
rency in the pair in the forex world, always. This also means that when you
look at a chart of the cable and fiber the quote is telling you how many
dollars you need for each pound sterling or euro, respectively.
The USD/CHF or “swissy” has a sympathetic correlation to the dollar.
This pair has the U.S. dollar as the first or base currency so the quote in
Figure 8.4 is representative of how many dollars I will get for each Swiss
franc or how many francs I need in order to get one dollar.
Notice that these two markets have a sympathetic relationship. They
move together directionally. When the USD/CHF trends higher, this shows
dollar strength and franc weakness as it is doing in Figure 8.4.
Never let the charts or the data or any of the trappings of trading dis-
tract you from one simple truth: You are trading and watching opinion and
psychology unfold, and the representation of that is on the chart you are
watching. The minute that you forget that people’s emotions move the mar-
kets, you will continually be blindsided by the improbable and the unseen.
The markets can go to infinity and down to zero. Never believe anything is
too high, too strong, too weak, or too low.
Now since we are overlaying the dollar, it makes sense that there
should be some analysis made on the market cycle, support, and resistance
on that chart as well. In the case of the swissy, resistance on the dollar will
equate to resistance on the swissy. The key levels to watch on the dollar
are usually simplified if you watch the “00.” The double zeroes like 86.00
on these charts and 88.00 are ceilings in the uptrend of the dollar. These
P1: OTA
c08 JWBT185-Horner October 26, 2009 17:15 Printer: Yet to come
Market Pulse 103
(DX A0 - US DOLLAR INDEX FUTURES,D) Dynamic,0:00-24:00
(CHF A0-FX - SWITZERLAND FRANC COMPOSITE)
14 28 12 26 09 23 07 21 04 18 01 15 29 13 27 10 24 08 22 05 19 02
May Jun Jul Oct Nov Dec 2009 Feb
72.000
74.000
76.000
78.000
80.000
82.000
84.000
86.000
88.000
Aug Sep
85.346
1.1610
FIGURE 8.4 The U.S. Dollar and USD/CHF Directional Correlation
© eSignal, 2009.
ceilings translate to a ceiling on the swissy but floors on the fiber and ca-
ble. The amplitude on the swissy correlates nicely with the dollar as well,
but remember that the franc itself is subject to internal events, the events
within Switzerland, that can affect the pairs’ movements. Just because the
United States is open and the dominant force in terms of activity does not
excuse ignoring movement in the other country factored into the pair.
These last four pairs are generally considered the “majors,” although
the swissy is not always included in that group. I include it only because
it’s dollar-correlated and trades heavily enough to be considered among
the fiber, dollar-yen, and cable. I refer to them even more specifically as
the dollar-correlated majors because of their relationship back to the U.S.
dollar. There are however six other actively traded pairs that trade against
the dollar as well and have their own correlations back to the greenback.
These pairs are a little different, though; they are called “commodity cur-
rencies” which I feel is a little discriminatory since really all pairs have a
certain relationship back to commodities and therefore could all be consid-
ered commodity currencies or comm dolls. But that’s just my thinking, and
P1: OTA
c08 JWBT185-Horner October 26, 2009 17:15 Printer: Yet to come
104 FOREX ON FIVE HOURS A WEEK
as far as the general opinion goes, the USD/CAD, AUD/USD, and NZD/USD
are true comm dolls with correlations that still observe dollar movement
but also a commodity alongside. They can behave like spilt personalities,
and you have to add the USD/JPY to that behavior.
U.S. DOLLAR INDEX AND USD/CAD
Since the USD/CAD is the first comm doll, we’ll take a look at it. Don’t
forget that there are two market pulses that can move this pair: the dollar
and crude oil. Canada supplies some 9 percent of the world’s crude oil,
and that’s not an insignificant number. Because of this, Canada’s economy
and therefore a good degree of the loonies’ strength, comes from energy
exports. When crude oil is strong, the U.S. dollar weakens. The relationship
between these two market pulses is generally inverse. As I have shown with
the arrows in Figure 8.5, this is not necessarily a set relationship, but it is
fairly reliable nonetheless.
(DX A0 - US DOLLAR INDEX FUTURES,D) Dynamic,0:00-24:00
(CL #F - CRUDE OIL (LIGHT) FUTURES)
21 2804 1118 2501 0815 2229 0613 2027 0310 1724 0108 1522 2905 1219 2602
Oct Nov Dec 2009 Feb
72.000
74.000
76.000
78.000
80.000
82.000
84.000
86.000
88.000
Aug Sep
85.346
40.04
FIGURE 8.5 Market Pulse Correlations between the Dollar and Crude
© eSignal, 2009.
P1: OTA
c08 JWBT185-Horner October 26, 2009 17:15 Printer: Yet to come
Market Pulse 105
(DX A0 - US DOLLAR INDEX FUTURES,D) Dynamic,0:00-24:00
(CAD A0-FX - CANADA DOLLAR COMPOSITE)
14 28 12 26 09 23 07 21 04 18 01 15 29 13 27 10 24 08 22 05 19 02
May Jun Jul Oct Nov Dec 2009 Feb
72.000
74.000
76.000
78.000
80.000
82.000
86.000
88.000
Aug Sep
85.346
1.2187
FIGURE 8.6 As the Dollar Strengthens, the USD/CAD Trends Higher
© eSignal, 2009.
When you look at the U.S. Dollar Index and the USD/CAD, you will see
that the U.S. dollar is the first currency in the pair, and the quote represents
how many Canadian dollars (“loonies”) you will need for one U.S. dollar.
As this chart of the U.S. dollar trends higher, the chart of the USD/CAD
trends higher along with it, signifying that the stronger dollar yields more
loonies at exchange (see Figure 8.6). Inversely a downtrend signifies loonie
strength over the greenback. But what happens when the crude oil market
is strong?
When crude is strong, there is a double effect on the dollar-canada.
The strong crude oil market will reflect a weaker U.S. dollar, and this to-
gether not only is good for the loonie so it can gain against the greenback, it
also weakens the greenback so the net effect is a downtrend on the chart.
Now since the crude oil market was weak at the time of this screenshot
(moving from over $140/barrel to just over $40/barrel) and the U.S. dollar
is currently a safe haven currency that has increased its demand, you can
see that the chart of the USD/CAD is up, which means weak loonie versus
stronger dollar.
P1: OTA
c08 JWBT185-Horner October 26, 2009 17:15 Printer: Yet to come
106 FOREX ON FIVE HOURS A WEEK
(CL #F - CRUDE OIL (LIGHT) FUTURES,D) Dynamic,0:00-24:00
(CAD A0-FX - CANADA DOLLAR COMPOSITE)
1431 28 12 27 09 23 07 21 04 18 02 15 29 13 27 10 24 08 22 05 19 02
MayApr Jun Jul Oct Nov Dec 2009 Feb
60.00
80.00
100.00
120.00
140.00
Aug Sep
40.04
1.2187
FIGURE 8.7 As Crude Oil Strengthens, the USD/CAD Trends Higher
© eSignal, 2009.
What are some signals for a reversal? Look at crude oil. If it can rally,
that will strengthen the loonie and weaken the greenback and create a net
effect of a downtrend on the chart of the dollar-canada (see Figure 8.7).
Look for resistance in the U.S. Dollar Index. A weaker dollar reduces buy-
ing power and can increase the price paid for a barrel of crude oil. If the
economy in Canada improves, this can help the loonie as well. So you see
the market pulse has a way of getting you to not only think about the bigger
picture of this inter-related market, but it also allows you to measure it!
Strong crude oil means a strong Canadian economy or at least has a
bullish impact on it and thus the USD/CAD heads lower.
The USD/JPY was discussed as a dollar-correlated major earlier, and
although this is true there is another relationship that it follows with much
more reliable, sympathetic correlation. This makes the pair not necessarily
a comm doll, but it exhibits that split-personality behavior: in this case with
the Dow Jones Industrial Average. I want to give you a little background on
the yen and its place as the low-cost currency. The BOJ (Bank of Japan) has
kept the lending rate in Japan low for years and even as I write this the rate
is 0.10 percent—the lowest among the major central banks. It is the perfect
P1: OTA
c08 JWBT185-Horner October 26, 2009 17:15 Printer: Yet to come
Market Pulse 107
(SINDU - DOW JONES INDUSTRIAL AVERAGE,D) Dynamic,0:00-24:00
(JPY A0-FX-JAPAN YEN COMPOSITE)
21 2804 11 18 25 08 1522 2906 1320 2703 1017 01 08 15 22 05 12 26 02
Oct Nov Dec 2009 Feb
7500.00
8000.00
8500.00
9000.00
9500.00
10000.00
11500.00
12000.00
10500.00
11000.00
Aug Sep
8280.59
FIGURE 8.8 The USD/JPY Reflects Risk Appetite and Risk Aversion
© eSignal, 2009.
place to borrow from and thus yen are borrowed heavily. In fact, that’s the
foundation of the carry trade, which I will examine later.
The relationship between the dollar-yen and Dow tells us more about
trends in risk appetite (see Figure 8.8). Many traders believe that the yen
pairs, like the USD/JPY, are an accurate gauge for risk sentiment. The yen is
bought heavily when equities fall. That’s at the heart of this correlation. In
fact, for you stock traders out there, the yen can act as an indicator to fore-
cast equities movement. This is mainly due to the 24-hour trading time and
liquidity of the forex. The best way to determine whether the USD/JPY will
track with the Dollar Index or with the Dow has to do with risk aversion.
When there is little appetite for risk, the Dow will have better correlation.
When the equities volatility is low or there is less concern about the overall
safety of stocks, look to the U.S. dollar for correlation. Simply put: weak
Dow—stronger yen versus the dollar. The less appetite for risk the more
these two charts will correlate. When equities’ volatility decreases, the
correlation will as well. This is how the relationship between the dollar-
yen and Dow ebbs and flows.
P1: OTA
c08 JWBT185-Horner October 26, 2009 17:15 Printer: Yet to come
108 FOREX ON FIVE HOURS A WEEK
(GC #F - GOLD FUTURES,D) Dynamic,0:00-24:00
(DX A0 - US DOLLAR INDEX FUTURES)
800.00
750.00
700.00
850.00
900.00
914.3
85.346
950.00
1000.00
21 2814 041118 25 08 15 22 29 06 13 20 27 03 10 17 01 08 15 22 05 12 26 02
Oct Nov Dec 2009 FebAug Sep
FIGURE 8.9 Gold and the U.S. Dollar Can Change Their Relationship with One
Another
© eSignal, 2009.
Before we look at the last two comm dolls, the aussie and kiwi, let’s
take a look at the U.S. dollar versus gold and the U.S. dollar versus the con-
tinuous commodity index. These are the markets at the center of the aussie
and kiwi commodity currency relationship. Precious metals have long been
the markets for a flight to safety and therefore have a relationship back to
the U.S. dollar, but in recent years the dollar has represented a safe haven
as well, so the relationship has been a unique one and certainly not one that
has remained inverse. In the daily chart in Figure 8.9 you can see that the
relationship is inverse at times and sympathetic at others. The more you
examine these intermarket relationships, the more interesting they can be-
come, but there’s no value in delving into relationships just for the sake
of examination if there is no actionable idea that you can eventually put
to use. Far too much of the technical and fundamental analyses I see on
a regular basis loses sight of the fact that at the end of the analysis there
should be an actionable idea even if the message is “stay flat.”
The aussie and kiwi are typically considered commodity currencies
for their relationship back to precious metals. Therefore, since the pairs
P1: OTA
c08 JWBT185-Horner October 26, 2009 17:15 Printer: Yet to come
Market Pulse 109
(DX A0 - US DOLLAR INDEX FUTURES,D) Dynamic,0:00-24:00
(CI #F - CCI FUTURES)
21 28 1104 1825 01 08 15 22 29 0613 20 2703 1017 2401 08 15 22 29 05 1219 26 02
Oct Nov Dec 2009 FebAug Sep
72.000
74.000
76.000
78.000
80.000
82.000
84.000
86.000
88.000
85.346
374.50
FIGURE 8.10 The CI Symbol Shows Strength and Weakness in Commodities
© eSignal, 2009.
trade against the U.S. dollar, it would make sense that as I look at the
aussie and kiwi for gold correlation, it would further make sense that I
look at gold’s correlation back to the dollar. The problem is that the best
correlation for these two comm dolls is not gold alone or even simply pre-
cious metals. It is the entire commodities complex, and because of that
it’s better to look for correlations between the dollar and commodities
(see Figure 8.10).
The relationship between the continuous commodities index and the
dollar is an inverse one, and when you stop for a moment to consider what
the chart implies, it makes complete sense. A strong dollar means purchas-
ing power, and it’s this purchasing power that allows us to get more com-
modities per dollar. A strong dollar pushed the commodities index lower
just as it pushes the crude oil market lower. This is a cause and effect
relationship, but it is not the only reason that crude, not commodities,
moves off course. Regardless, if the relationship is inverse between the
commodities index and the dollar, let’s now take a look at each comm doll
and their relationship back to the U.S. Dollar Index.
P1: OTA
c08 JWBT185-Horner October 26, 2009 17:15 Printer: Yet to come
110 FOREX ON FIVE HOURS A WEEK
U.S. DOLLAR INDEX AND AUD/USD
The aussie and the dollar have an inverse relationship. As the U.S. dol-
lar weakens, the Australian dollar gains against it, and the chart of the
AUD/USD trades higher. The quote of the aussie in Figure 8.11 is 85.34,
which means in order to get one Australian dollar, $0.8534 U.S. dollars are
needed. A higher trending aussie chart indicates that the aussie is gaining
on the dollar or that the dollar is weakening versus the aussie. I also want
to mention that both currencies in the pair do not have to be moving to
indicate strength or weakness. It’s sentiment as well, and there are going
to be times when one currency could not be increasing or decreasing in
value, but the other is moving higher or lower against it. Do not assume
that a trend in any pair means that both currencies are moving.
The aussie has long been considered a comm doll due to its relation-
ship with precious metals, namely gold. But this is an incomplete assess-
ment. Looking at the overlay of the aussie and gold in Figure 8.12 it is clear
that there is not always a strong correlation between these two markets.
(DX A0 - US DOLLAR INDEX FUTURES,D) Dynamic,0:00-24:00
(AUD A0-FX - AUSTRALIAN DOLLAR COMPOSITE)
14 28 12 26 09 23 07 21 04 18 01 15 29 13 27 10 24 08 22 05 19 02
May Jun Jul Oct Nov Dec 2009 Feb
72.000
0.6752
74.000
76.000
78.000
80.000
82.000
84.000
86.000
88.000
Aug Sep
85.346
FIGURE 8.11 The U.S. Dollar Moves Inverse to the AUD/USD
© eSignal, 2009.
P1: OTA
c08 JWBT185-Horner October 26, 2009 17:15 Printer: Yet to come
Market Pulse 111
(YG #F - GOLD MINI FUTURES,D) Dynamic,0:00-24:00
(AUD A0-FX - AUSTRALIAN DOLLAR COMPOSITE)
800.00
750.00
700.00
850.00
900.00
914.0
950.00
1000.00
21 2814 0411 18 25 08 15 22 29 06 13 20 27 03 10 17 01 08 15 22 05 12 26 02
Oct Nov Dec 2009 FebAug Sep
0.6752
FIGURE 8.12 Gold and the AUD/USD Have Changed Their Relationship
© eSignal, 2009.
While the relationship has historically been inverse, that does not mean
that there will not be times that gold and the aussie will move together.
Looking at the daily chart of the aussie and gold shows this relation-
ship as one that over short periods of time can shift between being sym-
pathetic and inverse. But zooming out to a much longer time frame, the
monthly chart where each candle represents the open/high/low/close of
one month’s worth of trading shows that the inverse relationship is the one
that is most common and that sympathetic movement between the two is
short-lived (see Figure 8.13).
What applies to the AUD/USD generally applies to the NZD/USD, so I
will share the chart overlays here, but they don’t need further explanation
other than to say that the kiwi moves with and when the aussie does (see
Figures 8.14 and 8.15).
Even the gold market, over a much longer time frame like the weekly or
monthly, shows a steady relationship. But for trading purposes and for the
sake of affordable risk/reward ratios, the daily is as long a time frame that
I will enter a trade. So a chart with better, more reliable, and shorter-term
P1: OTA
c08 JWBT185-Horner October 26, 2009 17:15 Printer: Yet to come
112 FOREX ON FIVE HOURS A WEEK
(DX A0 - US DOLLAR INDEX FUTURES,M) Dynamic,0:00-24:00
(AUD A0-FX - AUSTRALIAN DOLLAR COMPOSITE)
90.000
80.000
70.000
100.000
914.0
110.000
120.000
1998 1999 2000 2001 2002 2003 2004 2005 2006 2007
2008 2009
85.346
0.6744
FIGURE 8.13 A Monthly Chart of the Relationship between the Dollar and the
Aussie
© eSignal, 2009.
correlation accuracy is required. Enter the continuous commodity index.
The sympathetic correlation is indicative of the greenback’s strength and
hence lower commodity prices and how these lower commodity prices pull
the chart of the aussie (and kiwi) lower. This is how the two comm dolls,
the aussie and the kiwi, move (see Figures 8.16 and 8.17).
Trading forex—you by now know—means understanding where the
U.S. dollar is heading. This may not apply to all pairs but certainly to the
six or seven most-traded pairs as they all trade against the dollar. There is
no more important a factor when determining any country’s currency than
the one that comes from raising or dropping central bank rates.
In order to understand what the Fed is going to do with interest rates,
look no further than the Fed Funds futures contract. I update my blog with
Fed Funds math in front of rate decisions, and you can check this out at
ragheehorner.com. The idea here is that if you pull up the contract month
specific to the rate decision you see where traders believe the rate will
be. In other words, you would look at the March contract for where the
expected Fed Funds rate will be in March. Figure 8.18, which is a continu-
ous contract, is representing the current front month, it shows 99.76. The
P1: OTA
c08 JWBT185-Horner October 26, 2009 17:15 Printer: Yet to come
(CI #F - CCI FUTURES,D) Dynamic,0:00-24:00
(AUD A0-FX - AUSTRALIA DOLLAR COMPOSITE)
400.00
350.00
374.50
450.00
500.00
550.00
600.00
21 28 04 18 26 0815 22 2906 13 202703 10 1724 01 0815 22 05 12 26 02
Oct Nov Dec 2009 FebAug Sep
FIGURE 8.14 The Commodity Index and the AUD/USD Correlate Strongly
© eSignal, 2009.
(DX A0 - US DOLLAR INDEX FUTURES,D) Dynamic,0:00-24:00
(NZD A0-FX - NEW ZEALAND DOLLAR COMPOSITE)
21 28 0411 18 2501 0815 22 2906 13 2027 0310 17 2401 0815 22 2905 1219 26 02
Oct Nov Dec 2009 Feb
72.000
74.000
76.000
78.000
80.000
82.000
84.000
86.000
88.000
Aug Sep
85.346
0.5318
FIGURE 8.15 The Dollar Index and the NZD/USD Move Inverse to One Another
© eSignal, 2009.
113
P1: OTA
c08 JWBT185-Horner October 26, 2009 17:15 Printer: Yet to come
(YG #F - GOLD MINI FUTURES,D) Dynamic,0:00-24:00
(NZD A0-FX - NEW ZEALAND DOLLAR COMPOSITE)
800.0
750.0
700.0
0.5318
850.0
900.0
914.0
85.346
950.0
1000.0
21 2814 04 18 2511 08 15 22 29 06 13 20 27 03 10 17 01 08 15 22 05 12 26 02
Oct Nov Dec 2009 FebAug Sep
FIGURE 8.16 Gold and the NZD/USD Have Changed Their Relationship
© eSignal, 2009.
(CI #F - CCI FUTURES,D) Dynamic,0:00-24:00
(NZD A0-FX - NEW ZEALAND DOLLAR COMPOSITE)
400.00
374.50
350.00
0.5318
450.00
500.00
550.00
600.00
21 2814 04 18 2611 08 15 22 29 06 13 20 2703 101724 01 08 15 22 05 12 26 02
Oct Nov Dec 2009 FebAug Sep
FIGURE 8.17 The Commodity Index Correlates Better with the NZD/USD and
AUD/USD
© eSignal, 2009.
114
P1: OTA
c08 JWBT185-Horner October 26, 2009 17:15 Printer: Yet to come
Market Pulse 115
(FF #F - 30-DAY INTEREST RATE FUTURES,D) Dynamic,0:00-24:00
98.2500
98.0000
98.5000
98.7500
99.0000
99.2500
99.5000
99.7600
04 18 2511 08 15 22 29 06 13 20 27 03 10 17 01 08 15 22 05 12 26 02
Oct Nov Dec 2009 FebAug Sep
FIGURE 8.18 Fed Funds Futures Indicate Where Traders Think Rates are Heading
© eSignal, 2009.
current front month should represent where traders feel the rate should be.
Since the current rate in the U.S. is 0.25 percent, traders feel there will be
no change to this rate higher or lower. Here’s how I know this: Follow along
with me for a little Fed Funds math. Take the current trading price of the FF
contract as I have now, 99.76. Subtract 99.76 from 100.00. 100.00 is repre-
sentative of a 0 percent. 100.00 minus 99.76 equals 0.24. The 0.24 indicates
that there is a “no change” opinion, but why isn’t it 0.25? The .01 difference
between the current rate of 0.25 and the Fed Fund price reflects a very, very
slight opinion from traders that there could be another cut. But it’s cer-
tainly not a widely-held opinion. If it were, the rate would be closer to 0.15
or below 0.10. The closer it trades to 0.00 the more likely traders feel there
will be another cut. How about a 0.30 or 0.40? That would indicate that a
percentage of traders felt there will be a hike. When the price is sitting on
0.50, that means a 25 basis point hike has been fully discounted or baked
into the cake and is what traders expect to see at the next rate decision.
Now you know how to factor in futures changes in the U.S. central
bank rate and this is the best indication for overall strength and weakness
in the U.S. dollar.
P1: OTA
c08 JWBT185-Horner October 26, 2009 17:15 Printer: Yet to come
116