Forex on Five Hours a Week: How to Make Money Trading on Your Own Time _8 potx
Bạn đang xem bản rút gọn của tài liệu. Xem và tải ngay bản đầy đủ của tài liệu tại đây (1.05 MB, 22 trang )
P1: OTA
c11 JWBT185-Horner October 24, 2009 19:41 Printer: Yet to come
Trading Edge 139
If you have tried using chart patterns in the past, you may have had
hit or miss luck with them. That’s mainly the reason why anyone discards
anything. It doesn’t work. The remainder of the reason lies in a basic human
trait: the search for something better. This unknown may exist on some
levels of living, but not in trading. What’s best for you may not be best for
me. “Best” is relative.
Remember a couple basic ideas of price:
1. News and fundamentals are built into price action.
2. Price action reflects the psychology (think: fear and greed) of the
market.
I am not a technician (technicians rely more on indicators, which are
always lagging), but rather I am a chartist who focuses on price. Nothing
leads price. Some tools like pivot points and Fibonacci levels may forecast,
but this is not predicting.
The other aspect of price that no one seems to tell anyone—so I’m
going to tell you now—is that price can only be interpreted effectively if the
underlying market direction is identified. It was reading article after article
written by Charles Dow that crystallized this for me. The market currently
is in one of four market cycles: accumulation, mark up, distribution, mark
down. A market, you have learned, can only travel up, down, or sideways.
This is not enough, though. We must know how to identify the current cycle
in real time.
Now take this concept back to what may have been a hit or miss re-
lationship with chart pattern–based entries. Occasionally, I can imagine,
they worked, and occasionally they did not. In all likelihood you were by
chance pairing trending patterns with a trending market and sideways pat-
terns with sideways markets. Eventually the frustration of this haphazard
winning and losing made you drop chart patterns and move on. They’re for
newbies after all, you may have huffed as you went to Google to search
out your next trading strategy.
So what do we know now? Chart patterns must be paired with the
correct market cycle. Here’s how you can use a simple trio of three
Fibonacci–based moving averages to accomplish this. I call it the “Wave,”
as you now know. The Wave, to recap, is three 34-period exponential mov-
ing averages, one set on the high, one set on the close, and one set on the
low. These lines will travel up, down, and sideways across your charts.
When they are used in the proper reference, you will have what I call a
clock angle. For example, if you are trading off a daily chart (also known
as an “end of day” chart), ideally you should be looking at a year’s worth
of data. This amount of data does a few things for you. First, it will put
P1: OTA
c11 JWBT185-Horner October 24, 2009 19:41 Printer: Yet to come
140 FOREX ON FIVE HOURS A WEEK
all relevant price action front and center: recent trends, 52-week highs and
lows, and reversals. Second, it will allow you to take a proper clock angle
reading, which means that the year’s worth of data compresses price action
into the right scale so that when you look at the angle of the three lines, it’s
an accurate reading of the cycle the market is currently in.
Let me mention right now that while I will be using chart patterns,
there is not a trader alive who couldn’t benefit from an accurate and real-
time reading of the current cycle of the market. It’s not limited to any style
of trading. In fact, it’s the very reason you should be utilizing one type of
entry over another. All entry styles currently are designed for trending, re-
versal, breakout/breakdown, or range-bound cycles—whether you know it
or not! So the first thing you must determine about your current stable of
entry strategies is what cycle was it meant to capitalize on. No single entry
strategy can capitalize on every cycle. That’s a fact.
When it comes to trending versus nontrending patterns, it’s fairly easy
to determine this with the chart pattern name. Falling wedges and down
channels are, as their name implies, downtrending patterns. Rising wedges
and up channels are uptrending patterns. I mention this because many
times traders find the lines and levels that form a pattern and then go
straight to entering a trade based upon those boundaries. The problem with
that is the missing step. In order to use a trending chart pattern set-up cor-
rectly, the underlying market must be in a trend. Except for the Wave, I
know of no other way to do this in real time.
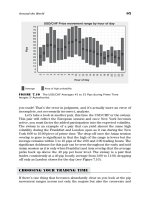
As shown in Figure 11.1, the 15-minute USD/CAD is heading down at
what I would call a four to six o’clock angle. This is also a mark down
or downtrend. The downtrend would be a perfect pairing for a downtrend
chart pattern like a falling wedge or down channel: not however for a tri-
angle, rectangle, double or triple top or bottom, as these are examples of
sideways or range-bound patterns better suited to an accumulation or dis-
tribution cycle. See Figure 11.2.
This is not limited to short-term intraday chart analysis. How about a
longer-term, end-of-day chart of the EUR/USD? See Figure 11.3.
As shown in Figure 11.4, this is a down channel and must be traded
in a downtrending market. So finding the pattern is step one. Confirm-
ing that this pattern is occurring in the correct market cycle is step two.
Now realize that chart patterns are simply the combination of downtrend
lines, uptrend lines, horizontal support, and resistance. This channel is two
downtrend lines. Has it formed in a mark down cycle? Use the clock angle
of the Wave to determine.
This market cycle filter or confirmation step can be applied to any type
of trading as long as you know which market cycle your strategy was de-
signed for. This is something that most traders don’t consider, mainly be-
cause they are seldom told to. Traders usually define themselves by their
P1: OTA
c11 JWBT185-Horner October 24, 2009 19:41 Printer: Yet to come
Trading Edge 141
1.1600
1.1550
1.1500
1.1450
1.1400
1.1350
1.1300
1.1250
1.1233
1.1188
04:00
05/20/09 05/21/09 05/22/09
(CAD A0-FX - CANADIAN DOLLAR,15) Dynamic,0:00-0:00
09:00 14:00 19:00 00:00 05:00 10:00 15:00 20:00 01:00 06:00 11:00 16:00
1
.
1223
1
.
1213
1.1200
FIGURE 11.1 Confirmed Downtrend with the Four to Six O’clock Wave Angle
© eSignal, 2009.
1.1600
1.1550
1.1500
1.1450
1.1400
1.1350
1.1300
1.1250
1.1233
1.1188
04:00
05/20/09 05/21/09 05/22/09
(CAD A0-FX - CANADIAN DOLLAR,15) Dynamic,0:00-0:00
09:00 14:00 19:00 00:00 05:00 10:00 15:00 20:00 01:00 06:00 11:00 16:00
1
.
1223
1
.
1213
1.1200
FIGURE 11.2 The Falling Wedge Pattern Should Only Be Traded in a Downtrend
© eSignal, 2009.
P1: OTA
c11 JWBT185-Horner October 24, 2009 19:41 Printer: Yet to come
142 FOREX ON FIVE HOURS A WEEK
1.6000
1.5500
1.5000
1.4509
1.4364
1.4000
1.3632
1.3500
11 18 25 03 10 17 24 31 07 14 21 28 05 12 19 26 02 09 16 23 30 07 14 21 28 04 11 18 25 01 08 15 22 29 06
Mar Apr May Jun Jul Aug Sep Oct
(EUR A0-FX - EURO,D) Dynamic,0:00-24:00
MA(34,H)e
MA(34,C)e
MA(34,L)e
1
.
4275
FIGURE 11.3 Two Parallel Downtrend Lines Form a Down Channel
© eSignal, 2009.
1.6000
1.5500
1.5000
1.4509
1.4364
1.4000
1.3632
1.3500
11 18 25 03 10 17 24 31 07 14 21 28 05 12 19 26 02 09 16 23 30 07 14 21 28 04 11 18 25 01 08 15 22 29 06
Mar Apr May Jun Jul Aug Sep Oct
(EUR A0-FX - EURO,D) Dynamic,0:00-24:00
MA(34,H)e
MA(34,C)e
MA(34,L)e
1
.
4275
FIGURE 11.4 The Down Channel Is Only Valid in a Downtrend
© eSignal, 2009.
P1: OTA
c11 JWBT185-Horner October 24, 2009 19:41 Printer: Yet to come
Trading Edge 143
2.1000
2.0500
2.0000
1.9892
1.9711
1.9571
1.9319
1.9000
1.8500
15 22 29 05 12 19 26 02 09 16 23 02 09 16 23
2009 Feb Mar
(EUR/AUD A0-FX - EURO/AUSTRALIA DOLLAR COMPOSITE,D) Dynamic,0:00-24:00
MA(34,H)e
MA(34,C)e
MA(34,L)e
1
.
9500
FIGURE 11.5 Rectangles Are Consolidation Patterns
© eSignal, 2009.
trading entry style: “I’m a swing trader” or “I’m a momentum trader.” This
is only half true. When the market cycle is sideways, only then should you
be a momentum trader. When the market is trending, you should look for
swing entries and trending patterns. Let the cycle dictate your entry!
Let’s look at a sideways pattern. This one is an interesting look at what
could be one of two choices. A few things to take note of: Do you see
the width of the pattern? The range from the horizontal resistance to the
horizontal support is wide enough to merit trading within the range. See
Figure 11.5.
Inside the range trading is a strategy that takes advantage of wide side-
ways patterns like this, with static (horizontal) levels that can be shorted
at the ceiling and bought at the floor. Alternatively, a breakout/breakdown
play can be set-up that would entail waiting for price breaking up through
the ceiling or down through the floor. Of course, this pattern must be con-
firmed by a sideways market cycle. See Figure 11.6.
In each of these examples, the chart pattern was only considered a
potential entry after the market cycle confirmed that the pattern was oc-
curring in the appropriate cycle. Without this confirmation, the lines and
levels of the pattern could potentially be acted upon incorrectly. No mat-
ter what your trading style, understanding which cycle your strategies are
most likely to succeed in will increase the chances that you’ll be on the
right side of price action. See Figures 11.7 and 11.8.
P1: OTA
c11 JWBT185-Horner October 24, 2009 19:41 Printer: Yet to come
144 FOREX ON FIVE HOURS A WEEK
2.1000
1.9892
1.9711
1.9319
1.9000
1.8000
1.7000
1.6000
24 07 21 05 19 02 16 30 14 28 11 25
08
22
06
20 03
17
01
15
29
12
26
09
23
09
23
MarFebDecNovOctSepAugJulJunMayApr 2009
(EUR/AUD A0-FX - EURO/AUSTRALIA DOLLAR COMPOSITE,D) Dynamic,0:00-24:00
MA(34,H)e
MA(34,C)e
MA(34,L)e
1
.
9511
2 0000
FIGURE 11.6 The Wave Indicates a Sideways Market on the Daily EUR/AUD
© eSignal, 2009.
12/10/2008 09/11/2008
FOREX:EUR/AUD (Daily) - Continuation Rectangle
07/12/2008 04/01/2009 01/02/2009
1.7686
1.8186
1.8686
1.9186
1.9686
2.0186
2.0686
2.2186
FIGURE 11.7 Chart Pattern Identification Automated by Autochartist Software
Images © Autochartist.
P1: OTA
c11 JWBT185-Horner October 24, 2009 19:41 Printer: Yet to come
Trading Edge 145
2.1000
1.9995
1.9622
1.9000
1.8000
1.7000
18 25 01 08 15 22 29 06 13 20 27 03 10 17 24 01 08 15 22 29 05 12 19 26 02
FebDecNovOctSep 2009
(EUR/AUD A0-FX - EURO/AUSTRALIA DOLLAR COMPOSITE,D) Dynamic,0:00-24:00
GRaB
FIGURE 11.8 Confirm the Rectangle with a Sideways Wave
© eSignal, 2009.
THE RIGHT SIDE OF THE CHART
As traders, the only reason we need to know what has happened (the left
side of the chart) is to determine what will happen, and that’s the right
side of the chart. Too often we get caught up in discussions of why some-
thing happened. But when it is not balanced out with a discussion of how
this will help us figure out what will happen, it’s simply a mental exer-
cise and not trading. I see plenty of cocktail party analysis on the Web. I
strive to join their party because even if I go off on some fundamentals-
based discussion of the market I hope my better angels will bring me back
to what is actionable about it. Actionable analysis is something that is
not commonly found. Actionable analysis is about telling the reader what
you think will happen, how, and why. It takes guts to be specific about
set-ups and price. That’s what it means to focus on the right side of the
chart.
Cocktail party analysis is almost always either very long term (at least
a one- to two-year time horizon) or refers to the left side of the chart. Fun-
damentals are almost always left side because data is backwards-looking.
There is no piece of data—Non Farm Payroll, Unemployment, Retail Sales,
Gross Domestic Product—nothing, that will lead the charts. If you know of
a fundamental that is bullish in nature, you can be assured that it is not the
only one—not that there isn’t a bearish piece of data out there, too. The
trick is to understand what is actively being discounted at the moment.
P1: OTA
c11 JWBT185-Horner October 24, 2009 19:41 Printer: Yet to come
146 FOREX ON FIVE HOURS A WEEK
There are certain relationships that the market will look at. The Dow and
USD/JPY is one such relationship.
CONSUMER CONFIDENCE
Has all the negativity of the stimulus plan been reacted to? Has it— at
this point in the media and public— been fully discounted into price? It
can be agreed that we’re going to spend over a trillion dollars of tax-
payer money and we’re going to do something versus nothing. There are
two things that can be of benefit and that is to not do more damage to
the economy and inject optimism via capital into the economy, but more
specifically, the U.S. consumer. If consumers think the economy is turn-
ing around, they will buy, and that’s what’s going to improve the econ-
omy. Not better data. Data is lagging. Consumer psychology will be lead-
ing. Because of this, the consumer will feel better before the data looks
better.
I was speaking to a friend of mine who works for a fund and decided
that in an “alternate universe” Treasury Secretary Timothy F. Geithner an-
nounced every last detail of the plan and the equities market sold off all the
same. The reason is that Wall Street ran the market up (discounted the an-
nouncement) and the only surprise would have been (1) no announcement
or (2) that the United States won some intergalactic lottery and thus paid
off the debt. In other words, no matter what, the equities markets were
going to sell off.
I mention all this because it has a direct effect on the USD/JPY. Is the
current price action the beginning of a sideways/bottoming cycle? Let’s dis-
sect the daily chart. Starting with the green, red, and blue or GRaB charts,
there is confirmation of the sideways cycle transition on the daily with the
34 EMA Wave indicator moving sideways, indicating a transition to an ac-
cumulation or distribution market cycle. See Figure 11.9.
Currently the Fibonacci levels on the daily USD/JPY showcase a solid
double bottom at 87.10 to 87.12, which can at very least establish a short
term floor. The ceilings are identified by the 25 percent, 38.2 percent, and
50 percent Fibonacci retracement levels. See Figure 11.10.
One floor and multiple ceilings could contain both further upside and
downside on the USD/JPY as there are significant arguments that the
negativity in the Dow has been fully discounted. If the 87.10 to 92.25/93.83
area is going to be in the consolidation range going forward, then that indi-
cates that the Dow will consolidate here as well.
P1: OTA
c11 JWBT185-Horner October 24, 2009 19:41 Printer: Yet to come
Trading Edge 147
3 Feb 2008 18 Apr 2008 3 Jul 2008 16 Sep 2008
110.50
107.10
103.70
100.30
96.90
93.50
90.33
86.70
USD/JPY,Daily 90.43 90.75 89.69 90.33
FIGURE 11.9 A Transitional Market Cycle on the Daily USD/JPY
13 Nov 2008 2 Dec 2008
21 Dec 2008
27 Jan 2009
8 Jan 2009
98.15
96.55
94.95
93.35
91.70
90.35
86.90
88.50
USD/JPY,Daily 90.43 90.75 89.69 90.35
FIGURE 11.10 Fibonacci Identifies Potential Floors and Ceilings on the Daily
USD/JPY
P1: OTA
c11 JWBT185-Horner October 24, 2009 19:41 Printer: Yet to come
148 FOREX ON FIVE HOURS A WEEK
/10/2008 07/11/2008 02/12/2008 26/12/2008 20/01/2009 12/02/2009
103.33
102.33
101.33
100.33
99.33
98.33
97.33
96.33
95.33
94.33
93.33
92.33
91.33
90.33
89.33
88.33
87.33
FIGURE 11.11 An Autochartist Symmetrial Triangle on the Daily USD/JPY
Images © Autochartist.
RISK APPETITE
The USD/JPY is approximately six days into a market cycle shift into ac-
cumulation. There is now a chart pattern alert to reinforce this shift, and
while it may not immediately usher in a return of risk appetite, investors’
stomachs are beginning to growl. See Figure 11.11.
The trendline to keep an eye on is the downtrend line (the green resis-
tance line) on the asymmetrical triangle pattern. This congestion pattern
is currently trading near the downtrend line with the breakout level just
below the 92.00 major psychological level at 91.84. See Figure 11.12.
The bias for a breakout can be tempered with the fact that the Dow is
still below 8,000 but, focus on the signals from the daily USD/JPY. There
are reasons to look for higher highs, but the bullish engulfing is one. See
Figure 11.13.
This all means that there are still ceilings that the USD/JPY must trade
up through before the sideways market cycle can transition into proof
that risk appetite has returned in equities and that the USD/JPY will trend
higher to reflect that. It’s a major shift in investor psychology we’re waiting
on now.
SELL THE NEWS
The Dow is currently down significantly mainly on a “buy the rumor, sell
the news” response to the release of the stimulus package on what seems
P1: OTA
c11 JWBT185-Horner October 24, 2009 19:41 Printer: Yet to come
Trading Edge 149
28 Oct 2008 16 Nov 2008 4 Dec 2008 23 Dec 2008 29 Jan 200911 Jan 2009
100.45
98.50
96.55
94.60
92.65
90.70
91.84
86.80
88.75
USD/JPY,Daily 90.68 92.02 90.53 91.84
FIGURE 11.12 Re-creating the Pattern Lines and Levels on the Live Chart of the
USD/JPY
28 Oct 2008
IBFX - CPR
EXPERT COMMENTARY
Bullish Color
Last Candlestick Pattern found:
1 bars ago
This is a confirmed Bullish Engulfing
Check to see if you are at a support level
Place a Buy order
SL: 89.91
PT: 93.96
Bearish Color
Morning/Evening
Soldiers/Crows
3 Inside
3 Outside
16 Nov 2008 4 Dec 2008
23 Dec 2008
29 Jan 2009
11 Jan 2009
97.50
100
0
91.91
87.00
USD/JPY,Daily 90.68 92.02 90.53 91.91
FIGURE 11.13 Using MT4 Plug-ins to Find Candlestick Patterns
P1: OTA
c11 JWBT185-Horner October 24, 2009 19:41 Printer: Yet to come
150 FOREX ON FIVE HOURS A WEEK
(DX A0 - US DOLLAR INDEX FUTURES,30) Dynamic, 0:00-24:00
GRaB
02/08 02/09 02/10
84.500
85.000
85.226
85.336
85.737
86.000
85 424
85 500
FIGURE 11.14 An Intraday, 30-Minute Chart of the U.S. Dollar Index Futures
Contract
© eSignal, 2009.
to be a calculated lack of specifics from Treasury Secretary Timothy F.
Geithner for how the plan will be executed. The street hates uncertainty
more than bad news, and there are plenty of questions, leaving traders ral-
lying the dollar in a continued safe haven play. See Figure 11.14.
With a dramatically weaker Dow and U.S. Dollar Index rallying from
below 85.00, the dollar-yen is trading lower breaking out of an earlier tri-
angle pattern that had formed during Tuesday’s Asian session and broke
down with the Frankfurt and London open. See Figure 11.15.
The USD/JPY broke higher last week as equities rallied in front of to-
day’s news. The process of discounting (otherwise known as “baking into
the cake”) is vital when trading yen pairs when there are events that will
affect the U.S. equities markets. The breakout higher did follow through
to the forecast region as plotted by Autochartist in Figure 11.16. Forecast
regions can be valuable support and resistance areas that traders can take
cues from to identify potential reversal or stall points on a chart.
The very ceiling the forecast region plotted was where the 30-minute
chart began consolidating and where the triangle pattern developed. As a
general rule, the USD/JPY will continue to fall as long as the risk aversion
that permeates the equities market continues. Furthermore, this lack
of risk appetite will continue to make the U.S. dollar the world’s safe
haven currency. The stimulus plan put an exclamation point on the feeling
investors have about U.S. stocks and their fear of further decline. Gold has
P1: OTA
c11 JWBT185-Horner October 24, 2009 19:41 Printer: Yet to come
Trading Edge 151
9/2 19:00 9/2 22:30 10/2 02:30 10/2 06:30 10/2 10:30
USD/JPY 30MIN
91.62
91.52
91.42
91.32
91.22
91.12
91.02
90.92
90.82
90.72
90.62
90.52
90.42
90.32
90.22
90.12
91.72
FIGURE 11.15 Autochartist Identifies a Triangle Pattern on the 30-Minute
USD/JPY
Images © Autochartist.
20/01/2009 25/01/2009 30/01/2009 05/02/2009
USD/JPY Daily
93.26
92.76
92.26
91.76
91.26
90.76
90.26
89.76
89.26
88.76
88.26
87.76
87.26
FIGURE 11.16 A Triangle Breakout Follows Through to the Ceiling (Shaded) on
the Daily USD/JPY
Images © Autochartist.
P1: OTA
c11 JWBT185-Horner October 24, 2009 19:41 Printer: Yet to come
152 FOREX ON FIVE HOURS A WEEK
Average bearish movement of consecutive bearish bars
3,500
3,000
2,500
2,000
1,500
1,000
500
0
Currency
AUDCAD
AUDCHF
AUDJPY
AUDUSD
CHFJPY
EURAUD
EURCAD
EURCHF
EURDKK
EURGBP
EURJPY
EURNZD
EURUSD
GBPCHF
GBPJPY
GBPNZD
GBPUSD
NZDCHF
NZDJPY
NZDUSD
USDCAD
USDCHF
USDCZK
USDJPY
USDPLN
USDSGN
USDZAR
FIGURE 11.17 Using PowerStats to Gauge Expectation for USD/JPY Movement
rallied up to $920/oz. as an indication of continued concerns and disap-
pointment in the plan’s overgeneralized unveiling.
On an interesting note, daily bars on the USD/JPY average approxi-
mately 300 pips. See Figure 11.17.
Today is the second bar of bearish price movement. With a high of
yesterday’s session of 92.42 and today’s current low of 90.10, the number
of total pips lower is 232 pips.
P1: OTA
c12 JWBT185-Horner October 26, 2009 17:24 Printer: Yet to come
CHAPTER 12
Is My Broker
Friend or Foe?
Sometimes the best position in the market is not having one.
Learning to walk away from a difficult market, a bad mood,
or a tough day is often the best lesson a trader can learn.
2007 “Fxstreet.com. The Forex Market.” All Rights Reserved.
O
ne of the most common questions I get is whether brokers run stops.
I’m not a broker, but I have to say that sometimes this question
starts to take on a mythology like an XFilesconspiracy theory.
Stops are run in any market where market makers or pit traders or who-
ever can anticipate a large number of orders sitting at a fairly predictable
price level or area. It’s like shooting ducks in a barrel not that I have
anything against ducks.
153
P1: OTA
c12 JWBT185-Horner October 26, 2009 17:24 Printer: Yet to come
154 FOREX ON FIVE HOURS A WEEK
What’s interesting is that many traders feel that someone is out to get
them. In a zero sum game, that feeling of suspicion is not entirely mis-
placed. Someone is on the other side of all trades because for every buyer
you need a seller. In forex, since there is not a centralized exchange, your
broker is your liquidity provider and therefore is taking the other side of
your trade. I am simplifying this, but that’s the gist of it. Now if your broker
gives access to a large pool of liquidity providers as there is a new breed
of brokers that don’t take the other side of your trade but rather routes
your order to a larger pool, it is someone else who will take the other side
of your trade. Many traders feel more comfortable with this arrangement,
where the broker doesn’t have a trading desk. Either way, someone out
there is trading against you.
I hear of lot of traders saying, “When I buy, the market automatically
goes down” or “They are moving the market to take me out.”
“Okay, so what kind of size are you trading?”
“Two mini lots.”
Right, they are paying people to trade against your two minis. What is
more likely the case is that the entry is coinciding with the herd and it’s
your two mini lots plus the herd that comprises a reason for the market
to fade the move. Perhaps the orders are sitting at a psychological “00” or
“50” level. There are a number of reasons that particular price level can
and will cause reversals, especially when the level is thick with orders. In
those cases, it could be considered running stops. I won’t argue with that.
But I will say that it is our job as traders to know where our orders are in
relation to the herd!
So what’s a trader to do? First, recognize where you are in relation
to economic report releases. Time is the most overlooked aspect of forex
trading. The assumption that all 24 hours are created equal, that somehow
you can belly up to your computer screen at any time of day and begin trad-
ing is wrong! Price is another misunderstood aspect; there is a psychology
to price itself and price action. Always know where you are in relation to
the “00” or “50” pip levels as well as the “20” and “80.” Another error is trad-
ing news. I tell traders that if you are going to trade a release or if your trade
will be open during a release, you’re going to have to do one of two things:
either get out of the trade or use a time-based stop instead of a price-based
stop that can potentially be hit during the volatility. Some brokers will re-
ally milk news releases with terrible spreads and/or late quote updates.
News can create volatility. You should know that. Time-based stops allow
for the craziness to subside and the price action to normalize. I call time-
based stops, “60 second stops” because for 60 seconds after the release, I
take my stop out of the market. These are the most common oversights.
Now some people may dismiss this as my sticking up for brokers. I’m not.
I do think that they know what typical habits are of traders. I think they
P1: OTA
c12 JWBT185-Horner October 26, 2009 17:24 Printer: Yet to come
Is My Broker Friend or Foe? 155
understand order flow and price action and the psychology behind them
well enough to simply capitalize on the stupid things that many, many
traders do. The only way we traders won’t do those things is to first rec-
ognize what those things are and then have the discipline to avoid them. I
do think that many traders simply want someone to blame brokers for their
bad trading. Don’t be one of them. Take responsibility for your actions and
focus on those things that you can control. Buying into the conspiracy the-
ory mentality will only make you trade like a victim, and that is not how
you want to trade!
THE 2 PERCENT QUESTION
Hello, Raghee, could you give me your comments and suggestion
on risk management? What is your position on the rule that many
traders have, that at one given point you should not risk more than
1 to 2 percent of your total account value? Is it true that if I have a
$10,000 account I should not risk more than $100 to $200 in a trade?
And what about placing orders on correlated pairs like the USD/CHF
and EUR/USD at the same time if the conditions on the wave, support
and resistance are good?
Thanks,
Luis
These are great questions. A lot of traders have the same ones. You
know by now that I believe risk management is more of a psychological
issue. I think that following a stop loss has everything to do with discipline
and little to nothing to do with a percentage or number of pips. Most traders
do not follow their “formula”–based stop losses because they frankly don’t
mean anything. It’s easy to move the placement or ignore it when there is
no meaning attached to why the stop loss was placed at a particular price
point. How about using a 30 pips–based stop? Why not 35? It’s just too easy
to move when they are arbitrary or based on a number or percent. This is
taken from years and years of self-observation and teaching hundreds of
students up close.
I also don’t like the idea because it somehow insinuates that trading
is like gambling or craps, which in some ways I acknowledge it is, but
I believe there is less left to chance when trading. Friends of mine who
are great traders and gamblers succeed because of discipline and knowing
when to vary their bet size. That’s not luck or a formula; that comes from
identifying when the momentum is on your side.
P1: OTA
c12 JWBT185-Horner October 26, 2009 17:24 Printer: Yet to come
156 FOREX ON FIVE HOURS A WEEK
Now, contrast that to determining a stop loss there’s an approach
there. It’s one that involves the idea that every trade has a point at which
it is invalid. The point of validity is the point at which to buy or sell is no
longer a trade worth holding because something has changed great enough
in price to change the reasoning for the entry. Notice I did not mention a
percent or number (of pips).
Now, I agree the 1or 2 percent can be a threshold. Certainly there are
entries that when considering where the point of validity is, could rep-
resent too great a risk (potential loss) to your account, and those trades
should not be taken.
Somehow, though, 1 to 2 percent morphed from a “threshold” to a “stop
loss,” I think that is incorrect. I think that when a triangle breaks, 1 to 2 per-
cent can be considered as the threshold but that the stop loss is determined
by the point of validity (POV). The POV in this case would be the other side
of the triangle pattern. How could a triangle breakout through resistance
still be valid if prices break down through the uptrend line support? It can’t,
and that’s why for this set-up, the opposite side of the trade is the validity.
The other side of the triangle is not a percentage or pip consideration;
it is support and resistance. If this POV represents 1 to 2 percent of your
account size, then, sure, it’s likely the trade presents too much risk. In other
words, different trades will be appropriate for some accounts and not ap-
propriate for others.
As to the second question, I don’t have a problem with being long the
EUR/USD and short the USD/CHF simultaneously. Each must have their
own set-ups because merely being long on one does not justify being short
the other in my opinion. And from the way the question was phrased, I
would say you got that.
This also brings up a great point, harmony. I look for trades, when tak-
ing positions across different pairs, to have harmony. I don’t want to hedge,
and I don’t want to take entries on the same time frame on different pairs
that would require, for example, conflicting U.S. Dollar Index movement.
STOP LOSS PLACEMENT
Stop loss placement is much more about using and understanding internal
and external psychology, which is to say you must know where the herd
will shift opinion and how you will react to it.
Trading can trigger the ego like any activity where your opinion and
skill are tested. No one likes being wrong. We will put that feeling off, the
feeling of admitting we are wrong, as much as we can. But what if being
stopped out is a process of being right? What if the part of the trading plan
P1: OTA
c12 JWBT185-Horner October 26, 2009 17:24 Printer: Yet to come
Is My Broker Friend or Foe? 157
that shows the trade is no longer valid is also a way to pat yourself on the
back?
Most traders do not follow their risk management plan (think stop loss
placement) because they are not actively a part of the decision. Rather
the placement is often dictated by a percent or pip or some such equally
unengaging and random number. It’s easy to ignore your stop loss when
you are not actively part of the decision. Using a fixed level is not activity;
you are not attached nor have you made analysis to the decision. These
are easy mental traps to ignore. I think risk management in general is more
psychological than it is technical or fundamental analysis. First of all, the
decision to enter a trade is based upon some sort of analysis. Regardless
of what yours is, there was a reason the trade was valid. The concept of
validity is important because stop losses should not be based on a percent
or dollar amount but rather where the trade is no longer valid.
I had a student who just absolutely could not, would not follow his
stops. The problem was the stop simply meant nothing. If the level was a 20
pip stop, then it is usually pushed back to 25, or 30, or 45 pips. The number
means nothing to validity so it is easy to manipulate. How about dollars?
If a stop is based on a $50, $100, $500 level, whatever your pain threshold
allows, then it’s easy to push it back as you rationalize why a $100 loss is
more or less the same as a $125 loss and on and on it goes. Once we had
worked the concept of validity into the risk management plan and made
being stopped out a positive not a negative by redefining what it meant, the
student no longer had this problem.
The 2 percent rule, if for no other reason, can help cap your loss if
you accept that 2 percent is as much as you should risk. It’s not what you
should risk but rather the limit of what you can afford to risk. That assumes
you know your risk before taking the trade and you make a decision about
whether you can afford it or not. The validity argument stands up to these
completely random fixed pips, percentages, and dollars because it injects
some common sense into the process and engages you, the trader, in the
decision making.
Validity means that there is a point at which your entry is no longer
valid. In other words, staying in a trade should be measured by the level at
which the breakout or trend or ceiling is still a reason to be in the trade.
Why are you taking any trade? Certain conditions were right, certain crite-
ria were met, and finally at some point, you saw the price you wanted to
get, and that confirmed all your analysis. That is more or less the process,
regardless of your strategy. So if all that work went into the entry, then
how come we throw that out the window for some random risk manage-
ment stop loss?
First of all, it stems from the fact that most traders don’t consider va-
lidity a risk management strategy. It should be the only consideration! Why
P1: OTA
c12 JWBT185-Horner October 26, 2009 17:24 Printer: Yet to come
158 FOREX ON FIVE HOURS A WEEK
would I hold on to a buy beyond the reason I first got into the trade? The
reason traders don’t use validity is they often don’t even know what it is.
How many traders know when their entry is no longer valid?
More and more should see that if stop losses are so habitually ignored
that pain has become the most widely used strategy, then no wonder no one
wants to follow their stop loss plan! Now what if your stop loss plan was
a way to be right? What if you could have the confidence to turn common
thinking on its head and say, I know exactly why this trade is no longer
working? There is a “rightness” to taking a loss when it is part of your plan.
There is a switch in thinking you’re going to have to make. This switch
is easy when you associate taking the loss at your predetermined validity
point as control and being right. Is it a mental game? Sure. Call it what you
want, but it is the only way to win at losing.
TRIAGE
Decisions are made by asking the right questions. I am going to assume
that most of us don’t necessarily think about prioritizing trading opportu-
nities in a systematic manner. Now I know this is not true for everyone, but
humor me. I think that most beginning traders get so excited when they
see a set-up on their charts that they fail to consider that (1) it may not
be a suitable risk/reward for their account size and (2) there may be other
set-ups that are occurring. One of the most intimidating aspects of trading
for novices is simply getting through the chart before making a trading de-
cision. This is really where most traders fail, and there is no other way to
compare set-ups unless you know what all the available ones are. How can
I get through all the time frames and pairs without missing a trade? What
if it already triggered before I had time to analyze it? Here’s the answer
no one wants to hear. You’re going to miss trades. Often! This is a 24-hour
market. You’re not going to be awake and at your desk for all of them. I
would rather miss trades than take bad ones. Many times for new traders,
since their analysis initially is slow, they end up taking the trade that is
left. In other words, it’s not a choice but a lack of options. You’re going to
end up with weak trades if you don’t understand the importance of triage
and analyzing all the potential opportunities available before entering
a trade.
TRADING TRUTHS
Over the years that I have been trading, observing others trade, and watch-
ing the markets, a few things have instinctively dawned on me. My guess
P1: OTA
c12 JWBT185-Horner October 26, 2009 17:24 Printer: Yet to come
Is My Broker Friend or Foe? 159
is that there are observations you’ve made too. More often than not, we
don’t follow our instincts to question the conventional wisdom of trading.
It’s handed down to us as fortune cookie wisdom: one liners with no in-
structions.
I think we give away our power and undermine our abilities because
we think someone knows better or that the experts should be followed
blindly. There’s a fine line between thinking outside the box and trying
ideas without merit or testing. At the same time, not all experts are truly
experts, are they?
I’ll give you an example, probably the most important one in my trad-
ing life. The idea of market cycles has been the single largest distinction I
have made in my trading. The concept of market cycle isn’t one I found or
even invented. It was just a concept that I had simply read about. I had to
find a way to determine what the cycles were, but there were no studies
or techniques I could find that explained how to do this. So the experts
had no answers for me. Too often this kind of frustration discourages us
and we walk away—tail between our legs. Thinking outside the box—to
me—means that having no answer is not acceptable. I don’t mind saying, “I
don’t know,” but I follow that up with “but I’ll find out.” I think most if not
all the trading truths that are outlined below are to varying degrees fairly
common. What’s uncommon is that I’ve ventured outside the box to make
the concepts actionable.
There’s also a mindset that you’re going to have to embrace: playing the
odds. If most traders lose, then why follow what most traders do? Yet that
seems to be what far too many traders do. We’re after the 10 percent. The
10 percent is the minority. What do the few do that the many do not? Well,
first they do not accept accepted trading wisdom at face value, especially
when observations and practice show it doesn’t necessarily work.
I could leave you with the following: “Be good, get good, or give up.”
But that would be selling both of us short. Let’s talk about how to “get
good.” Let’s start changing our own minds and being our own experts. Be-
sides, no one knows what you think they know. And I guess I would have
to include myself in that, too. Learn from everyone, but trust yourself .
Let the Market Cycle Dictate Entry Style
The one thing I want to communicate to any trader I meet is this: Let the
market direction tell you how to enter the trade. Now this is not a common
thought or consideration, mainly because there aren’t that many tools that
traders can use to determine what the market cycle is. The Wave is what
I use, and while I am biased, I do believe a combination of the Wave and
market memory is the best way to identify the cycle of the market.
P1: OTA
c12 JWBT185-Horner October 26, 2009 17:24 Printer: Yet to come
160 FOREX ON FIVE HOURS A WEEK
Don’t Let a Winner Turn into a Loser: Ratchet
Your Stops
It’s a trading truism that is seldom accompanied by any insight into how
to actually accomplish this balancing act. There is a fine line between giv-
ing a trade the wiggle room it needs and moving beyond the reason you
took the trade in the first place. The reason that most traders do not suc-
cessfully find this balance is that there needs to be some definition of what
trade validity is. Usually, the reason to stay in a trade and stop loss place-
ment are based upon some arbitrary figure, typically a percentage or dollar
amount or number of pips. A winner is easily defined as a point at which
a profit target is reached, but the stop loss placement is far more impor-
tant and must be defined by this and this alone. At what price is the rea-
son to enter the trade no longer valid? This is risk management because a
stop loss represents a risk-based exit. The two other exit types are break
even and trailing. All three must be based upon support, resistance, and
price levels.
Place Stop Orders at the Point of Validity or
Logical Support/Resistance Level—Not Dollar
Amounts, Not Percentages, Not Boredom
The first point to establish here is that each trade has a point at which a
trader sees the reason to enter a trade. The flip side of that is knowing
when the reason to get in is no longer valid. This is often a foreign concept
to many traders, because it is seldom discussed. Traders most commonly
use dollars as more of a pain threshold to be reached before exiting a trade.
Let’s take a chart pattern entry to make the point here. A triangle is a chart
pattern that triggers an entry when price pierces support or resistance. A
break up through resistance triggers a buy, but can that buy still be valid
if price trades lower through the support of the pattern? Of course not,
and this is precisely the thinking behind using a point of validity to place
stop losses. If you don’t know the point of validity for an entry, then you
must ask yourself why you entered the trade, the reason, and then look for
where that reason would no longer be valid.
Never Treat a Trade Gone Bad as an Investment
or Position Trade
The thought of being wrong is not a comfortable one, and as human beings
we will do and say anything to avoid it. This includes the conversations we
have with ourselves when a trade is going against us. It’s a feeling that only
traders can share with one another: the self talk, the denial, the bargaining.
The problem is that this behavior can finally manifest itself as a reason to