Forex on Five Hours a Week: How to Make Money Trading on Your Own Time _9 pot
Bạn đang xem bản rút gọn của tài liệu. Xem và tải ngay bản đầy đủ của tài liệu tại đây (1.05 MB, 22 trang )
P1: OTA
c12 JWBT185-Horner October 26, 2009 17:24 Printer: Yet to come
Is My Broker Friend or Foe? 161
stay in a trade, even though the reason to do so is long gone. Traders will
then redefine the trade, often turning it into a longer-term position trade or
investment because the longer outlook buys them time but more accurately
allows them to postpone what is the inevitable: admitting the trade is no
longer valid and therefore that they were wrong. The fix is to treat validity
as a decision that is as important as the entry. If the stop loss can be an
active decision, the exit can be proactive, allowing a trader a feeling of
control and therefore a certain “rightness” can be found even when the
trade is a loser.
Go Long Because They Are Bullish Instead of
Being Bullish Because They Are Long (Think
about It!)
There is a mental trap in analysis because the ego is involved in our de-
cision making. Analysis is personal; it’s our work, our skill, and opinion
on the line when we put in a trade. As in an individual sport, there is a
certain confidence we must have in ourselves. In order to protect ourselves
or most accurately our sense of being correct, we will look for reasons that
back up our opinion. This is where we look to darn near do anything to
back up our thinking rather than reassess. The only reason to buy is bullish
analysis. The trap is that our position in the market will create bias that
causes us to see what we want to see.
“Oh Crap” Is Never a Reason to Get
In or Out of a Trade
The fact that order entry platforms look more and more like Las Vegas slot
machines with their flashing prices and pretty color points is what brokers
know: There is a certain impulse to trade when sitting in front of your com-
puter. The impulse to trade comes from when trading becomes more reac-
tive rather than the execution of a well-laid plan. The culprit most often is
the “buy” or “sell” button, the market order, because this is the order entry
that can encourage reactive trade entries and exits. They are the “now” but-
ton. Very few if any trades should be executed this way. If you find yourself
hitting the market order button on a regular basis, then something is being
missed in your trading set-ups. or you likely don’t have a trade set-up at all.
The “oh crap” entry or exit is the knee-jerk reaction that we want to avoid.
Enter Trades Based on Price Action
Price is only a level playing field. Trading news doesn’t work consistently
on a short-term intraday basis. Price is the measuring stick. Price creates
support, resistance, chart patterns, highs, lows, and market cycles. News
P1: OTA
c12 JWBT185-Horner October 26, 2009 17:24 Printer: Yet to come
162 FOREX ON FIVE HOURS A WEEK
and fundamentals are reflected in price, not the other way around. The
process of discounting assures this. Remember that price measures the
psychology of the market. Fear and greed make the market move, and price
is the best way to measure this.
Top and Bottom Picking Is Only about Ego
Discussing trading and trading psychology without talking ego is impossi-
ble. Ego drives most of our bad decisions in trading. Ego is what drives us
to want to pick the top of a market or the bottom. It’s the thrill of being
right. Picking tops and bottoms in many ways is also encouraged by what
is on television and by analysts because this is the glory trade: Who doesn’t
want to be the one who called a top or bottom in a market? There are set-
ups that can help us identify tops and bottoms. Dow 1-2-3s and double bot-
toms/tops are common chart patterns that can help identify these turning
points. The main reason any of us looks for a top in an uptrend or a low in a
downtrend is that we are not already in the trend. The only traders looking
for tops and bottoms are the same traders that are not already riding the
trend. This also makes top and bottom picking the ultimate revenge trade.
All Indicators Are Based on Price and Therefore
There’s No Such Thing as a Leading Indicator
Most people love the idea of telling the future. Traders are no different. The
idea that we can find that one indicator or setting that can “tell the future” is
too tempting a fairy tale to stop believing in. First, let’s consider that lead-
ing is simply the wrong word, because more accurately the word should be
projecting. Think about indicators as projecting where price could go. The
idea that an indicator that needs price in order to be plotted can be leading
price as well is not logical and wrong. Nothing leads price.
No Single Entry Strategy Will Work
for All Market Cycles
The idea that one strategy will allow us to trade all market moves is one
that we must admit is impossible. The market can trend, move in a range,
and reverse; so we need a strategy for each one at a minimum. We can
have more than one for each cycle but in the end, whatever strategies
you now have were designed to capitalize on certain price movement. Of-
ten this is the part of the explanation that seems to be left out. This results
in traders applying entry strategies in a random manner or waiting for a
set-up to appear regardless of whether it is happening in the correct mar-
ket environment.
P1: OTA
c13 JWBT185-Horner October 26, 2009 17:26 Printer: Yet to come
CHAPTER 13
Embracing
Automation
Don’t get buried in analysis.
2007 “Fxstreet.com. The Forex Market.” All Rights Reserved.
S
ince I am writing about Forex in Five, there is a chance that people
will insinuate that forex trading or any trading for that matter can be
or is a part-time endeavor. That’s not true. “Full-time trading” should
mean that it replaces the income that you would have from a full-time job.
“Full-time trading,” though, has somehow been turned into 12- to 16-hour
pursuits of insomnia driven, get-up-in-the-middle-of-the-night trading.
So let’s agree that “full-time trading” is about having the type of income
you would have from a full-time job. If your bills are paid through your
163
P1: OTA
c13 JWBT185-Horner October 26, 2009 17:26 Printer: Yet to come
164 FOREX ON FIVE HOURS A WEEK
trading activities, you could in fact be a full-time trader regardless of the
time spent in front of your computer screen.
I bring this up because at some point you will wander into the forest of
the World Wide Web and come across forums and chat rooms all touting
a mechanical system that works. I’m sure some of it does for some peo-
ple and I’m certain most of it doesn’t work for most people. Think about
this: If you had a system that was 100% mechanical (think “set it and for-
get it”) and generated consistent profits, would you share it? If you said
“yes” you are a liar. If it worked you would very quietly make that profit
for as long as it did. Period. And that’s precisely what most traders that
you will never hear of that have a mechanical system do. I am referring
to 100% mechanical systems. I will say the same of forex analysts. Peo-
ple who are hired as analysts by and large do not trade. They look good
in front of a camera and have some nice university pedigree. Some and
it’s rare, do both, they trade and talk about trading. Their writing is fo-
cused on the “right side of the chart.” That is how they position them-
selves for what is going to happen next not a report about what has
happened!
The problem with most systems is that once they are sold, once they
have gone public you can count on two things: (1) The days are numbered
for profitable trade results, or (2) the system does not or no longer works.
It reminds me of a system that is hugely popular right now. I won’t name it
because honestly it doesn’t matter, and even if you pick up this book five
years from when it is published, another 10 hot systems will have come
and gone, and the story is generally the same. But I want to use a real
example here because I don’t want you to think I am simply just dismissing
all systems. That would be stupid as many work, but you will never be able
to buy it and you likely will never even know about it in the first place. The
best and pretty much the only mechanical systems that work are owned
and operated by hedge funds.
This system I am referring to has the unique distinction of being one
that worked. Notice I use the past tense because—and here’s where it gets
interesting—the creators of the system decided to sell it. By doing so they
strangled the golden goose. This system was not exactly a system as much
as it was a “gimmick” for lack of a better word.
Let me tell you about the Small Order Execution System (SOES) ban-
dits. Maybe you’ve heard of them? They were the early adaptors of direct
order execution and electronic communication networks in 1994–1995.
This is when the Internet was still new, and entering your stock trades was
beginning to bypass the traditional phone call to your broker and instead
was being routed through SOES. Had direct order entry never taken off as
it has now with the proliferation of online brokerages, these SOES bandits,
as long as they were small in number, would probably have kept right on
doing what they were doing.
P1: OTA
c13 JWBT185-Horner October 26, 2009 17:26 Printer: Yet to come
Embracing Automation 165
What they were doing was taking advantage of when the “Big Boys”
were letting their guard down and updating the bid and ask on stocks.
These SOES bandits with their new access into the markets and trans-
parency that came with directing your own order flow would capitalize
on difference in price from one brokerage to the other and basically scalp.
It worked, too!
We knew our days were numbered though. As soon as the Big Boys
realized what the SOES bandits were doing and that it cost them money
while the bandits multiplied like bunnies, the party was over. There was
nothing illegal with what the bandits were doing. With transparency to see
the late updating of price and the ability to route their orders to this lagging
bid or ask price they were free to do this. In fact, the very growth of the
number of bandits is what woke the Big Boys (the market makers) up.
The market makers never had worried about this level of transparency and
access before—until the SOES bandits. Fast forward to the forex and to
the system that actually worked.
This system, as I said, reminds me of the bandits. The bandits were
not taking trades on trends or any kind or price action. They were taking
advantage of a particular event (late bid/ask updates), and soon as the mar-
ket makers wised up, the game was over. It was a gimmick in this regard.
Not sustainable. This popular forex system is exactly the same. It takes ad-
vantage of a widening of bank rates and the fact that many brokerages will,
for the sake of keeping a steady three to five pips spread across the majors,
not adjust for the widening bank spread during daily reconciliation. The
story is going to end the same way. If the creators kept quiet and simply
went about capitalizing on this discovery they had turned into a system, I
would never be talking about it because I would never know! Instead they
sold the system, just as many SOES bandits began writing books and giving
seminars. Once everyone knows, the game was over.
If you have a system that you are playing with in the hopes that it is
your very own ATM machine, enjoy it while it lasts. If you bought it from
a website and it works, count your lucky stars and count the days before
it stops working. I have been at this game far too long and seen every type
of system and gimmick come and go. My trading is discretionary, which
is to say I trade by interpreting what I see in price action. Interpretation
is subjective, and no matter how many people I teach it is not likely to be
systematized.
No matter how tempted you are to let a system do the work for you,
use some common sense. Trading is not set it and forget it. Even systems
traders have to tweak their systems from time to time.
Automating your trading analysis is not the same as systematizing it.
Automation is what I do. I try and automate as much of my homework as
possible, and you should too. Here’s how to start, and it begins with your
charting.
P1: OTA
c13 JWBT185-Horner October 26, 2009 17:26 Printer: Yet to come
166 FOREX ON FIVE HOURS A WEEK
CHARTING TOOLS
You need to find low-cost charting tools, especially as a beginner. This is
not because I think you should begin your trading career as a miser, but I
would like to see you put your hard-earned dollars where they will do the
most good. The first consideration is funding your account. That will be
your largest cost. There are a number of tools I use that I have found are
continually great and low-cost assets to my trading. While I do use eSignal,
it may not be the best place to start if you are a brand-new trader. I am a
big fan of the Metatrader 4 (MT4) platform since it is free and can accept
automated plug-ins for technical and charting tools. You can try eSignal for
30 days free at eSignal.com. My personal rep there is Scott Wilks, and you
can reach him at 800-322-1819. You can download MT4 through a number
of brokerages or directly from metaquotes.net. I also make my GRaB plug
in for MT4 available free at my blog.
MT4 is free, and as you begin trading it is a great way to learn charting
and order entry through the demo version. Eventually you can graduate to
mini lots (some brokers even have micro lots), and I recommend you do
that as soon as you are comfortable with the mechanics of your trading
methodology and the mechanics of the platform.
PROFIT TARGETS
I am going to share with you one of the best, low-cost tools that will help
you automate much of your homework. It’s called Autochartist. With Au-
tochartist and the MT4 platform you’ll see with a few free plug-ins and
the entry styles you have already learned earlier in the book that you can
put trades together with ease. We’ve already discussed Lazy Days Lines,
and they are great, but there are other ways to find decision levels on your
chart. I am going to explain an effective way to use short-term profit targets
(aka forecast areas) to set-up longer-term moves.
In this example we’ll look at static levels (ceilings) and how to con-
firm these price points with a shorter-term chart follow-through and profit
target. Often you see what I call a “one thing leads to another” play
where short-term charts follow-through leads into a new position in the
same pair but on another time frame. In the example below, the ques-
tion to be asked is: Will the U.S. dollar continue to strengthen? That’s
the answer needed to determine whether the USD/CHF will find resis-
tance once again at the soft double top formed at 1.1715 and 1.1740 (see
Figure 13.1).
P1: OTA
c13 JWBT185-Horner October 26, 2009 17:26 Printer: Yet to come
Embracing Automation 167
FIGURE 13.1 USD/CHF Four Hour Chart with GRaB MT4 Plug-In
The older uptrend line from the asymmetrical triangle has been up-
dated with a new uptrend line created by initial weakness after the pattern
formed. Same pattern, new support, but it’s the strength of the resistance
we’re interested in here.
The market cycle is arguably even better now as prices have contin-
ued to consolidate and with U.S. Dollar Index strength, the franc is falling
against the dollar. A ceiling in the dollar will be the key to whether traders
will once again shift to bears in the 1.1715 to 1.1740 price range. This level
is further helped by the 1.1750 psychological level, which will be near-term
resistance.
Zooming into the 60-minute time frame, there is a rising wedge that has
formed and is following through in the swissy rally. The pattern itself and
the breakout confirm what we already know: the dollar is gaining on the
franc. It’s the forecast region here that can help with the 240 chart pattern
set-up (see Figure 13.2). Rising wedge pattern breakouts with forecast area
are highlighted.
The forecast region of the rising wedge pattern is between 1.1720 and
1.1740. This is where a near -term ceiling is likely to form according to the
expected follow-through. This equates to resistance, and this resistance
falls in line with the soft double top on the 240-minute time frame.
How about another example of this “one thing leads to another” set-
up at work? In Figure 13.3, crude oil broke the $40/barrel support it has
been bouncing along since January 20. Under a normal or typical market
P1: OTA
c13 JWBT185-Horner October 26, 2009 17:26 Printer: Yet to come
168 FOREX ON FIVE HOURS A WEEK
FIGURE 13.2 USD/CHF 60-Minute Time Frame
Images © Autochartist.
FIGURE 13.3 Crude Oil and U.S. Dollar Index
© eSignal, 2009.
P1: OTA
c13 JWBT185-Horner October 26, 2009 17:26 Printer: Yet to come
Embracing Automation 169
environment, the U.S. Dollar Index and crude oil futures would move in an
inverse correlation. However, this is anything but a normal market, and so
we see the correlation between the U.S. dollar and crude oil not syncing as
it usually would. This is an important note for USD/CAD traders.
This chart shows the past correlation that the dollar and crude had
traded in and the current state of that correlation as the crude oil market
is flattening and the dollar continues higher in the safe haven play. Realize
that the dollar is traveling in an upward direction that would point to a
neutral to weak crude oil market cycle.
There are a number of pairs that are affected by crude oil; the com-
modity currency USD/CAD is the first on that list. The idea of a commodity
currency or “comm doll” can be slightly misleading when you consider that
most currency pairs are either directly or indirectly affected by markets
such as the dollar index, crude oil, gold, commodity index, Dow, and Fed
Funds futures.
The short-term, 15-minute chart breakout of the USD/CAD reflects
Tuesday’s break below $40/barrel in the front month of crude oil. The set-
up to be discussed extends past the chart pattern alert itself and focuses
on the forecast region that the PRS program includes on “complete pat-
terns,” that is, patterns that have broken out of the pattern’s boundary (see
Figure 13.4).
FIGURE 13.4 USD/CAD 15-Minute Chart
Images © Autochartist.
P1: OTA
c13 JWBT185-Horner October 26, 2009 17:26 Printer: Yet to come
170 FOREX ON FIVE HOURS A WEEK
FIGURE 13.5 USD/CAD Daily
Images © Autochartist.
Upon breakout the “complete patterns” section of Autochartist will
plot a shaded area on the chart indicating what is called a “forecast” or
a likely area of resistance in a breakout (conversely this would be a likely
area of support in a breakdown). There are ways to use this forecast area
plotted by the PRS to aid in determining where the pair will travel to next.
In this case, the current support and stall just above the forecast region
would suggest further strength on the daily chart; however, a break below
this support region would suggest weakness (see Figure 13.5).
The Canadian dollar will likely continue to weaken against the U.S.
dollar if 40.00 becomes resistance in crude and if the dollar index trades
higher towards 86.00. Together, if the current direction persists, these two
markets could nudge the USD/CAD through the downtrend resistance of
the triangle pattern on the daily chart. Add to that the support of forecast
region identified by PRS and the breakout has the buying support it would
need to potentially push the USD/CAD higher.
FIFTEEN-MINUTE SET-UPS
When the market is especially volatile and you need a low-risk, short-term
entry, the 15- and 30-minute charts will be the best place to look. While you
P1: OTA
c13 JWBT185-Horner October 26, 2009 17:26 Printer: Yet to come
Embracing Automation 171
don’t want to favor certain time frames with no reason, a market that is not
following through on longer time frames (such as the case when the U.S.
Dollar Index consolidated) is a good time to adopt a shorter-term view of
the markets. Short-term chart patterns on the 15-minute chart can be key
to early and sometimes more aggressive entries.
I usually don’t make a habit of choosing one time frame over another.
The set-up itself should be the primary consideration, not the time frame.
Often, though, if the market is range-bound on the larger time frames or if
there is a trend that I want to find a more aggressive correction on, I will
often focus on the 15-minute time frame.
And that’s not to say that momentum set-ups aren’t effective on the 15-
minute; they are! In fact when the 30- or 60-minute doesn’t give me a con-
solidation/congestion cycles, it’s the 15-minute that will be the time frame
that is the only way to enter the breakout/breakdown.
I usually feel that 15-minute charts are aggressive in momentum and
swing entries because they are the alerts that will show up first and
that’s both the strength and weakness of the short term. You may be
getting in with the only opportunity, or you may be getting in too soon
or too aggressively.
The key is to know this!
Here are some great 15-minute set-ups from Autochartist.
Figure 13.6 is a set-up that has already followed through, but the reason
I think it will be one to watch is because it’s trading inside the forecast
FIGURE 13.6 GBP/USD 15-Minute
Images © Autochartist.
P1: OTA
c13 JWBT185-Horner October 26, 2009 17:26 Printer: Yet to come
172 FOREX ON FIVE HOURS A WEEK
FIGURE 13.7 USD/CAD 15-Minute
Images © Autochartist.
region, which will be resistance. If this time frame begins to pull back, there
could be some corrective opportunities on the 30 or 60.
I love this look because in any trending set-up there are three possible
entries and two that I look for in particular. First, and this should be the
first consideration, is the trend follow. Look for weakness and selling pres-
sure at the downtrend line resistance line (green). The other consideration
will be a breakout through the green line as a trend reversal as shown in
Figure 13.7.
As Figure 13.8 shows, the aussie is setting-up a similar set-up to the
canada. Instead it’s an uptrend, and the support line (blue) is where buying
support would be expected to step in.
The set-up in Figures 13.9 and 13.10 is a short-term (15 min) chart
pattern. Bear flags are upward angling, short channels. The trigger for the
short occurs when the uptrend line support is broken. These patterns can
set-up in both an accumulation or distribution cycle; this is occurring in the
distribution. The trigger for a flag is always in the opposite direction of the
angle. Bear flags angle up, while bull flags angle down.
In Figures 13.11 and 13.12 we pick up from where the 15-minute bear
flag formation has followed through, but is there another set-up now that
the trend has established itself? The downtrend that has initiated from the
breakdown has formed a four to six o’clock mark down cycle and an op-
portunity to set-up swing shorts within a down channel.
P1: OTA
c13 JWBT185-Horner October 26, 2009 17:26 Printer: Yet to come
Embracing Automation 173
FIGURE 13.8 AUD/USD 15-Minute
Images © Autochartist.
FIGURE 13.9 GBP/USD 15-Minute
Images © Autochartist.
P1: OTA
c13 JWBT185-Horner October 26, 2009 17:26 Printer: Yet to come
174 FOREX ON FIVE HOURS A WEEK
6 Feb 2009 9 Feb 01:45 9 Feb 05:45
GBP/USD,M15 1.4910 1.4911 1.4910 1.4911
9 Feb 09:45 9 Feb 13:45 9 Feb 17:45
1.4695
1.4740
1.4785
1.4830
1.4875
1.4920
1.4911
1.4965
FIGURE 13.10 GBP/USD M15
5 Feb 2009 6 Feb 06:30 9 Feb 00:30
GBP/USD,M30 1.4390 1.4427 1.4390 1.4401
9 Feb 16:30 10 Feb 08:3011 Feb 00:30
1.4325
1.4420
1.4515
1.4610
1.4705
1.4800
1.4895
1.4990
1.4401
FIGURE 13.11 GBP/USD 30-Minute
P1: OTA
c13 JWBT185-Horner October 26, 2009 17:26 Printer: Yet to come
Embracing Automation 175
FIGURE 13.12 GBP/USD 30-Minute
Images © Autochartist.
The downtrend is best capitalized on shorter-term, intraday charts
right now as the longer-term trend (daily chart) is sideways. Follow-
through in this environment of uncertainty is difficult to come by on longer-
term intraday (180- or 240-minute) charts.
Look for short triggers between 4435 and 4450 on the 30-minute chart.
The downtrend will be intact on this time frame until the cycle flattens
(keep an eye on the Wave) or prices find their way north of 4500.
Playing trending patterns is the best way to play trends, but what do
you do with the trend reverses? How do you know when to keep follow-
ing the trend? Those same trending patterns can help you set-up reversals
just as effectively as they helped you set-up swing trades. In the following
example, I’ll take the GBP/USD on the 60-minute time frame and show you
two scenarios of actual trades (see Figures 13.13 and 13.14). First is the
rising wedge continuation play.
The cable on the 60-minute chart is climbing within the rising wedge
pattern on the intraday uptrend—exactly the type of play I’m looking for
when I want to trend follow.
The green candles indicate that prices are trading above the Wave, and,
of course, you wouldn’t need that visual cue in this situation because the
higher lows (support) are obvious.
The play here is to wait for the pullback and trigger a long with that.
A pullback to where? The support of the top line of the Wave would be on
spot, but the problem with that is that it is far, far south of where prices
P1: OTA
c13 JWBT185-Horner October 26, 2009 17:26 Printer: Yet to come
176 FOREX ON FIVE HOURS A WEEK
FIGURE 13.13 GBP/USD 60-Minute
Images © Autochartist.
FIGURE 13.14 GBP/UK Sterling
© eSignal, 2008.
P1: OTA
c13 JWBT185-Horner October 26, 2009 17:26 Printer: Yet to come
Embracing Automation 177
FIGURE 13.15 GBP/UK Sterling
© eSignal, 2008.
FIGURE 13.16 GBP/UK Sterling
© eSignal, 2008.
P1: OTA
c13 JWBT185-Horner October 26, 2009 17:26 Printer: Yet to come
178 FOREX ON FIVE HOURS A WEEK
are now. The other option is to use the last major move and pull a Fibo off
it (see Figure 13.15).
I’m not usually a fan of a .25 correction for an entry (too shallow) so
the .382 is what I’d be watching plus it’s got the support of the 1.5100 “00”
behind it, which is always good.
But what happens when the trend weakens and reverses; how do we
know to get out of trend follow thinking and set-up a reversal? The uptrend
lines I drew here were one part manual uptrend line and one part rising
wedge support line. See Figure 13.16.
As you can see with the cable selling off sharply through the support
of the rising wedge, you must be asking, Now what?
The two uptrend lines I have drawn are representative of the reversal
and sell-off, and they represent the reversal play from the breakdown of
the wedge pattern.
Remember, every trending pattern can be played as either trend follow
or trend reversal. In this case there was opportunity for both.
P1: OTA
c14 JWBT185-Horner October 24, 2009 20:39 Printer: Yet to come
CHAPTER 14
Raghee
Recommends
T
he Internet is a big place, and finding the sites that will not distract
you is a constant challenge. I am going to list some of my favorite
sites in no particular order and tell you why and when I use them.
Mobile trading is all about the equipment that will let you escape the office
and the sites that will keep you from being out of touch.
This works into my mobile lifestyle because I feel like a self-contained
unit when I have my MacBook and an Internet connection. Now let me add
that if you are going to run out and get a netbook, I caution you because
they are good for little more than e-mails and surfing. If you are going to run
out and get a MacBook, remember that trader-friendly software is far and
few between. You will need to get software like VM Fusion to run Windows
and your charting platform. I try to get my trading entries in the market in
the morning when I am at my home office and then I am free to head out
and manage positions with my MacBook and iPhone on the road. I’m not
trying to encourage anyone to trade from a Mac as much as I love mine. I’ll
be candid, I got a MacBook because I bought one as a gift for one of my
best friends and loved it so much that I purchased one for myself as well.
You’re better off (as of now) on Windows. My home office desktop is a Dell
XPS, which runs Vista on four vertical-set monitors.
The sites that I have access to, they make a huge impact on my gauge
of the market. The first site I visit each morning is Forex Factory (forex
factory.com) for their economic calendar, which is the best on the Internet.
I look at the timing and projected impact of the reports across multiple
financial centers. One of the more attractive features to the calendar at
this site is that there are excellent descriptions of the reports as well as a
179
P1: OTA
c14 JWBT185-Horner October 24, 2009 20:39 Printer: Yet to come
180 FOREX ON FIVE HOURS A WEEK
historical result chart that allows you to see past results, pick up on trends,
and see the month-to-month impact.
I also like to check out Bloomberg’s currencies section for recent news
analysis of the world’s currency pairs. There are concise articles about ev-
erything from the euro to the yuan, and for someone like me who is not
going to set-up trades with news or data, having this information makes
sure that I am not up against some soft or fundamentally driven tsunami.
So if Forex Factory helps cue me to data releases and expected impact,
Bloomberg gives me a bigger picture of stories as currencies trade through
the financial centers.
I also have to mention that I love reading The Kirk Report (thekirk
report.com). Even though it is a stock trading–driven site, the links that
Charles Kirk puts together by scouring the Internet are among the most in-
sightful, entertaining, and thoughtful collection of links you will find. Check
it out daily, it will be worth your while. I’m a big Kirk Report fan!
I will also recommend Quote.com, which is an eSignal site that will give
you access to charts and quotes. Now I run eSignal so I will use that. I pay
for access to most futures exchanges, but I know not everyone wants to
have that expense each month. I have also been using Pro Real Time (pro-
realtime.com) recently, and while I am still getting to know the software,
their browser-based charting allows me to run charts on the Mac side of my
MacBook rather than running Windows in order to access eSignal or MT4.
Since I also have the Forex on the Go app, I can get live charts, quotes, and
access my MT4 trading account right through my iPhone.
There are sites that I recommend to traders especially if they are in the
beginning stages of their forex journey. The first and one of my favorites
is Baby Pips (babypips.com). Baby Pips is exactly as the name suggests; a
haven for new traders. You can learn all the basics about forex (free!) at the
School of Pipsology and read some excellent blogs (I’m Queen Cleopiptra
there). The good folks of Baby Pips have also developed a sort of Facebook
for forex traders called Meet Pips (meetpips.com), and if you think that
trading isn’t lonely and isolating at times, think again. Community websites
continue to grow in popularity.
Another site that is a terrific resource is Daily Motion (dailymo-
tion.com/ez2tradesoftware). It’s a video site like You Tube but can host
much longer videos. I use this site to upload educational videos, and there
are dozens of lessons available for replay. You will find shorter lessons as
well as full 30-minute plus webinar playbacks. It’s a collection of webinars
you can watch right on your desktop! I am also proud of the fact that my
content there has been authorized as “Official Content” by Daily Motion.
Another site with a very unique tool is Autochartist (autochartist.com).
The team over at Autochartist has developed some price movement tools;
the one they allow free access to is the PowerStats Basic. This tool allows
P1: OTA
c14 JWBT185-Horner October 24, 2009 20:39 Printer: Yet to come
Raghee Recommends 181
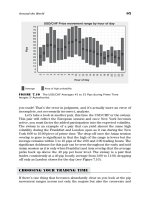
you to see the pip movement in individual pairs. You can see the average
price movement by day of week, by hour of day, and many other interesting
categories. What this site will do is give you a crash course in the person-
ality of the pair you are trading. This has volatility and risk implications as
we have discussed earlier in the Power Stats discussion.
For those of you who are interested in forex options, I would highly
recommend the ISE website (ise.com/fx). The options education that is
there along with the charts, quotes, and historical volatility information
is a wonderful resource for those of you looking to add forex options to
your overall approach. I also conduct webinars for the ISE on forex options
trading a few times a year, and the archived webinars are available at the
ISE website for those of you who are looking for a solid introduction to
how I trade options.
I don’t want to fail to mention some sites that I write for such as
Forex Trader Daily (forextraderdaily.com), FXStreet (fxstreet.com), Trad-
ing Markets (tradingmarkets.com), and Pattern Radar (patternradar.com).
I contribute analysis, videos, and lessons at these sites. I update the list of
my favorite sites over at my personal blog, ragheehorner.com.
Here are a few sites that while not trading-related I find are a tremen-
dous help to me personally. Being a home-based trader comes with its own
challenges. For one, the refrigerator is too close and convenient for my lik-
ing and the pool outside my office here calls to me with the sweetest
song on sunny days, which we’re known to have more than a few down
here in South Florida.
I am a big fan of the site Zen Habits for the lessons on simplicity (zen-
habits.net). Read it. I imagine you will either like it or not, but it is one of
the best written and most popular blogs on the Net, and I hope you’ll check
it out and see if some of the lessons in decluttering your life will work
for you. I also would recommend Lifehacker (lifehacker.com) for anyone
working from home. I have found more than a few good ideas and soft-
ware programs that were reviewed at the site. Gina Trapani who started
Lifehacker also has a blog of her own which I recommend as it is a great
extension with more a personal view (smarterware.org). I also recommend
The Freakonomics blog, and if you haven’t read the book, go buy it. It’s a
great read ().
You have to find constructive distractions as a home-based en-
trepreneur, and that’s what you are when you are a home-based trader.
If you cannot effectively distract yourself from the market, then you are
likely to overtrade and overtweak your trades. My distractions have saved
me from too many bad trades to even recall and saved my good ones from
the natural inclination to micromanage when left with nothing better to do.
P1: OTA
c14 JWBT185-Horner October 24, 2009 20:39 Printer: Yet to come
182