Getting Started in Currency Trading Winning in Today''''s Forex Market_6 docx
Bạn đang xem bản rút gọn của tài liệu. Xem và tải ngay bản đầy đủ của tài liệu tại đây (893.94 KB, 24 trang )
101
10
Fundamental Analysis
Chapter
I
t is commonly accepted that there are two major schools when formulating a
trading strategy for any market, be it securities, futures, or currencies. These
two disciplines are called fundamental analysis and technical analysis. The
former is based on economic factors while the latter is concerned with price
actions. The trader may opt to include elements of both disciplines while
honing his or her personal trading strategy. Typically, fundamentals are about
the long term; technicals are about the short term. Keep in mind what Lord
Keynes once wrote: “In the long run we are all dead.”
Supply and Demand
Fundamental analysis is a study of the economy and is based on the assumption
that the supply and demand for currencies is a result of economic processes
that can be observed in practice and that can be predicted. Fundamental
analysis studies the relationship between the evolution of exchange rates
and economic indicators, a relationship that it verifies and uses to make
predictions.
For currencies, a fundamental trading strategy consists of strategic assess-
ments in which a certain currency is traded based on virtually any criteria
excluding the price action. These criteria include the economic condition of the
country that the currency represents, monetary policy, and other elements that
are fundamental to economies.
Chapter 10_[99-114].qxd 2/24/10 10:11 PM Page 101
THE TOOLS OF THE TRADE
102
The focus of fundamental analysis lies in the economic, social, and politi-
cal forces that drive supply and demand. There is no single set of beliefs that
guides fundamental analysis, yet most fundamental analysts look at various
macroeconomic indicators, such as economic growth rates, interest rates, infla-
tion, and unemployment. Several theories prevail as to how currencies should be
valued.
Done alone, fundamental analysis can be stressful for traders who deal
with commodities, currencies, and other margined products. The reason for this
is that fundamental analysis often does not provide specific entry and exit
points, and therefore it can be difficult for traders to control risk when utilizing
leverage techniques.
Currency prices are a reflection of the balance between supply and
demand for currencies. Interest rates and the overall strength of the economy are
the two primary factors that affect supply and demand. Economic indicators
(for example, gross domestic product, foreign investment, and the trade
balance) reflect the overall health of an economy. Therefore, they are responsible
for the underlying changes in supply and demand for a particular currency. A
tremendous amount of data relating to these indicators is released at regular
intervals, and some of this data is significant. Data that is related to interest rates
and international trade is analyzed closely.
Interest Rates
If there is an uncertainty in the market in terms of interest rates, then any devel-
opments regarding interest rates can have a direct effect on the currency mar-
kets. Generally, when a country raises its interest rates, the country’s currency
strengthens in relation to other currencies as assets are shifted away from it to
gain a higher return elsewhere. Interest rate hikes, however, are usually not good
news for stock markets. This is because many investors withdraw money from a
country’s stock market when there is an increase in interest rates, causing the
country’s currency to weaken. See Figure 10.1.
Knowing which effect prevails can be tricky, but usually there is an agree-
ment among practitioners in the field as to what the interest rate move will do.
The producer price index, the consumer price index, and the gross domestic
product have proven to be the indicators with the biggest impact. The timing of
interest rate moves is usually known in advance. It is generally known that these
moves take place after regular meetings of the BOE (Bank of England), Fed
(U.S. Federal Reserve), ECB (European Central Bank), BOJ (Bank of Japan),
and other central banks.
Chapter 10_[99-114].qxd 2/24/10 10:11 PM Page 102
Fundamental Analysis
Balance of Trade
The trade balance portrays the net difference (over a period of time) between
the imports and exports of a nation. When the value of imports becomes more
than that of exports, the trade balance shows a deficit (this is, for the most part,
considered unfavorable). For example, if Euros are sold for other domestic
national currencies, such as U.S. dollars, to pay for imports, the value of the cur-
rency will depreciate due to the flow of dollars outside the country. By contrast,
if trade figures show an increase in exports, money will flow into the country
103
FIGURE 10.1 U.S. Interest Rates
Courtesy www.global-view.com
Chapter 10_[99-114].qxd 2/24/10 10:11 PM Page 103
THE TOOLS OF THE TRADE
104
and increase the value of the currency. In some ways, however, a deficit is not
necessarily a bad thing. A deficit is only negative if the deficit is greater than
market expectations and therefore will trigger a negative price movement. See
Figure 10.2.
Purchasing Power Parity
Purchasing power parity (PPP) is a theory that states that exchange rates
between currencies are in equilibrium when their purchasing power is the same
in each of the two countries. This means that the exchange rate between two
countries should equal the ratio of the two countries’ price levels of a fixed bas-
ket of goods and services. When a country’s domestic price level is increasing
(i.e., a country experiences inflation), that country’s exchange rate must depreci-
ate in order to return to PPP.
FIGURE 10.2 U.S. Balance of Trade
Courtesy www.global-view.com
Chapter 10_[99-114].qxd 2/24/10 10:11 PM Page 104
Fundamental Analysis
The basis for PPP is the “law of one price.” In the absence of transporta-
tion and other transaction costs, competitive markets will equalize the price of
an identical good in two countries when the prices are expressed in the same
currency. For example, a particular TV set that sells for 500 U.S. Dollars (USD)
in Seattle should cost 750 Canadian Dollars (CAD) in Vancouver when the
exchange rate between Canada and the United States is 1.50 USD/CAD. If the
price of the TV in Vancouver costs only 700 CAD, however, consumers in
Seattle would prefer buying the TV set in Vancouver. If this process (called
arbitrage) is carried out on a large scale, the U.S. consumers buying Canadian
goods will bid up the value of the Canadian Dollar, thus making Canadian
goods more costly to them. This process continues until the goods again have
the same price. There are three caveats with this law of one price: (1) as men-
tioned earlier, transportation costs, barriers to trade, and other transaction costs
can be significant; (2) there must be competitive markets for the goods and serv-
ices in both countries; (3) the law of one price only applies to tradable goods—
immobile goods such as houses and many services that are local are not traded
between countries.
Economists use two versions of purchasing power parity: absolute PPP
and relative PPP. Absolute PPP was described in the previous paragraph; it refers
to the equalization of price levels across countries. Put formally, the exchange
rate between Canada and the United States ECAD/USD is equal to the price
level in Canada PCAN divided by the price level in the United States PUSA.
Assume that the price level ratio PCAD/PUSD implies a PPP exchange rate of
1.3 CAD per 1 USD. If today’s exchange rate ECAD/USD is 1.5 CAD per 1
USD, PPP theory implies that the CAD will appreciate (get stronger) against
the USD, and the USD will in turn depreciate (get weaker) against the CAD.
Relative PPP refers to rates of changes of price levels, that is, inflation
rates. This proposition states that the rate of appreciation of a currency is equal
to the difference in inflation rates between the foreign and the home country.
For example, if Canada has an inflation rate of 1 percent and the United States
has an inflation rate of 3 percent, the U.S. Dollar will depreciate against the
Canadian Dollar by 2 percent per year. This proposition holds well empirically,
especially when the inflation differences are large.
The simplest way to calculate purchasing power parity between two
countries is to compare the price of a “standard” good that is, in fact,
identical across countries. Every year the Economist magazine pub-
lishes a lighthearted version of PPP: Its “Hamburger Index” lists the
price of a McDonald’s hamburger in various countries around the
world. More sophisticated versions of PPP look at a large number of
goods and services. One of the key problems in computing a
105
Chapter 10_[99-114].qxd 2/24/10 10:11 PM Page 105
THE TOOLS OF THE TRADE
106
comprehensive PPP is that people in different countries consume
different sets of goods and services, making it difficult to compare
the purchasing power between countries.
Gross Domestic Product
The gross domestic product (GDP) is the total market value of all goods and serv-
ices produced either by domestic or foreign companies within a country’s bor-
ders. GDP indicates the pace at which a country’s economy is growing (or
shrinking) and is considered the broadest indicator of economic output and
growth.
GDPs of different countries can be compared by converting their value in
national currency according to either exchange rates prevailing on international
currency markets or the purchasing power parity (PPP) of each currency relative
to a selected standard (usually the U.S. Dollar).
The relative ranking of countries may differ dramatically depending on
which approach is used: Using official exchange rates can routinely understate
the relative effective domestic purchasing power of the average producer or con-
sumer within a less-developed economy by 50 percent to 60 percent, owing to
the weakness of local currencies on world markets.
However, comparison based on official exchange rates can offer a better
indication of a country’s purchasing power on the international market for
goods and services.
Intervention
Another important fundamental influence on FOREX currency prices is called
intervention. This occurs when an official regulatory agency or a financial insti-
tution with one government directly coerces the exchange rate of its currency,
usually by reevaluation, devaluation, or by the manipulation of imports and
exports in some way.
Such actions may cause broad and erratic changes in the exchange rate
with foreign currencies. However, it is from such anomalies that the FOREX
trader may profit, if the proper stop-loss safeguards are in place.
Other Economic Indicators
The range of economic indicators and the standing reports generated from
them are extensive. Here are a few others that impact currency prices.
Chapter 10_[99-114].qxd 2/24/10 10:11 PM Page 106
Fundamental Analysis
Industrial Production
Industrial production (IP) is a chain-weighted measure of the change in the pro-
duction of the nation’s factories, mines, and utilities, as well as a measure of their
industrial capacity and how many available resources among factories, utilities,
and mines are being used (commonly known as capacity utilization). The man-
ufacturing sector accounts for one-quarter of the economy. The capacity utiliza-
tion rate provides an estimate of how much factory capacity is in use.
Purchasing Managers Index
The National Association of Purchasing Managers (NAPM), now called the
Institute for Supply Management, releases a monthly composite index of national
manufacturing conditions, constructed from data on new orders, production, sup-
plier delivery times, backlogs, inventories, prices, employment, export orders, and
import orders. It is divided into manufacturing and nonmanufacturing subindices.
Producer Price Index
The producer price index (PPI) is a measure of price changes in the manufac-
turing sector. It measures average changes in selling prices received by domestic
producers in the manufacturing, mining, agriculture, and electric utility indus-
tries for their output. The PPIs most often used for economic analysis are those
for finished goods, intermediate goods, and crude goods.
Consumer Price Index
The consumer price index (CPI) is a measure of the average price level paid by urban
consumers (80 percent of the population) for a fixed basket of goods and services.
It reports price changes in more than 200 categories. The CPI also includes various
user fees and taxes directly associated with the prices of specific goods and services.
Durable Goods
The durable goods orders indicator measures new orders placed with domestic
manufacturers for immediate and future delivery of factory hard goods. A
durable good is defined as a good that lasts an extended period of time (three
years or more) during which its services are extended.
Employment Index
Payroll employment is a measure of the number of jobs in more than 500 indus-
tries in all 50 states and 255 metropolitan areas. The employment estimates are
107
Chapter 10_[99-114].qxd 2/24/10 10:11 PM Page 107
THE TOOLS OF THE TRADE
108
based on a survey of larger businesses and count the number of paid employees
working part-time or full-time in the nation’s business and government establish-
ments. Currently, the Non-Farm Payroll Report (NFP), issued the first Friday of
each month, is closely watched by traders of the USD. News traders much antic-
ipate this report because the prereport consensus of the number is typically
incorrect—resulting in short-term fireworks for the USD currency pairs.
Retail Sales
The retail sales report is a measure of the total receipts of retail stores from sam-
ples representing all sizes and kinds of business in retail trade throughout the
nation. It is the timeliest indicator of broad consumer spending patterns and is
adjusted for normal seasonal variation, holidays, and trading-day differences.
Retail sales include durable and nondurable merchandise sold, and services and
excise taxes incidental to the sale of merchandise. Excluded are sales taxes col-
lected directly from the customer.
Housing Starts
The housing starts report measures the number of residential units on which
construction is begun each month. A start in construction is defined as the
beginning of excavation of the foundation for the building and is comprised pri-
marily of residential housing. Housing is interest rate–sensitive and is one of the
first sectors to react to changes in interest rates. Significant reaction of
starts/permits to changing interest rates signals that interest rates are nearing a
trough or a peak. To analyze the data, focus on the percentage change in levels
from the previous month. The report is released around the middle of the
following month.
Forecasting
Fundamental analysis refers to the study of the core underlying elements that
influence the economy of a particular entity. It is a method of study that
attempts to predict price action and market trends by analyzing economic indi-
cators, government policy, and societal factors (to name just a few elements)
within a business cycle framework. If you think of the financial markets as a big
clock, the fundamentals are the gears and springs that move the hands around
the face. Anyone walking down the street can look at this clock and tell you
what time it is now, but the fundamentalist can tell you how it came to be this
time and, more importantly, what time (or more precisely, what price) it will be
in the future.
Chapter 10_[99-114].qxd 2/24/10 10:11 PM Page 108
Fundamental Analysis
There is a tendency to pigeonhole traders into two distinct schools of mar-
ket analysis—fundamental and technical. Indeed, the first question posed to
you after you tell someone that you are a trader is generally “Are you a techni-
cian or a fundamentalist?” The reality is that it has become increasingly difficult
to be a purist of either persuasion. Fundamentalists need to keep an eye on the
various signals derived from the price action on charts, while few technicians
can afford to completely ignore impending economic data, critical political
decisions, or the myriad of societal issues that influence prices.
Bearing in mind that the financial underpinnings of any country, trading
bloc, or multinational industry take into account many factors, including social,
political, and economic influences, staying on top of an extremely fluid funda-
mental picture can be challenging. At the same time, you find that your knowl-
edge and understanding of a dynamic global market increases immeasurably as
you delve further and further into the complexities and subtleties of the funda-
mentals of the markets.
Fundamental analysis is an effective way to forecast economic conditions,
but not necessarily exact market prices. For example, when analyzing an econo-
mist’s forecast of the upcoming GDP or employment report, you begin to get a
fairly clear picture of the general health of the economy and the forces at work
behind it. However, you need to come up with a precise method as to how best
to translate this information into entry and exit points for a particular trading
strategy.
A trader who studies the markets using fundamental analysis generally cre-
ates models to formulate a trading strategy. These models typically utilize a host
of empirical data and attempt to forecast market behavior and estimate future
values or prices by using past values of core economic indicators. These forecasts
are then used to derive specific trades that best exploit this information.
Forecasting models are as numerous and varied as the traders and market
buffs that create them. Two people can look at the same data and come up with
two completely different conclusions about how the market will be influenced
by it. Therefore it is important that before casting yourself into a particular
mold regarding any aspect of market analysis, you study the fundamentals and
see how they best fit your trading style and expectations.
Do not succumb to “paralysis by analysis.” Given the multitude of factors
that fall under the heading of “The Fundamentals,” there is a distinct danger of
information overload. Sometimes traders fall into this trap and are unable to pull
the trigger on a trade. This is one of the reasons why many traders turn to techni-
cal analysis. To some, technical analysis is seen as a way to transform all of the fun-
damental factors that influence the markets into one simple tool: prices. However,
trading a particular market without knowing a great deal about the exact nature of
its underlying elements is like fishing without bait. You might get lucky and snare
a few on occasion, but it’s not the best approach over the long haul.
109
Chapter 10_[99-114].qxd 2/24/10 10:11 PM Page 109
THE TOOLS OF THE TRADE
110
For FOREX traders, the fundamentals are everything that makes a coun-
try tick. From interest rates and central bank policy to natural disasters, the fun-
damentals are a dynamic mix of distinct plans, erratic behaviors, and unforeseen
events. Therefore, it is easier to get a handle on the most influential contributors
to this diverse mix than it is to formulate a comprehensive list of all the funda-
mentals.
Economic indicators are snippets of financial and economic data published
by various agencies of the government or private sector. These statistics, which
are made public on a regularly scheduled basis, help market observers monitor
the pulse of the economy. Therefore, they are religiously followed by almost
everyone in the financial markets. With so many people poised to react to the
same information, economic indicators in general have tremendous potential to
generate volume and to move prices in the markets. While on the surface it
might seem that an advanced degree in economics would come in handy to ana-
lyze and then trade on the glut of information contained in these economic
indicators, a few simple guidelines are all that is necessary to track, organize, and
make trading decisions based on the data.
Know exactly when each economic indicator is due to be released. Keep a
calendar on your desk or trading station that contains the date and time when
each statistic will be made public. You can find these calendars on the New York
Federal Reserve Bank web site using this link: www.ny.frb.org. Then search for
“economic indicators.” The same information is also available from many
other sources on the Web or from the broker you use to execute your trades.
Chapter 13, “The FOREX Marketplace,” lists several web sites that monitor
news releases.
Keeping track of the calendar of economic indicators will also help you
make sense out of otherwise unanticipated price action in the market. Consider
this scenario: It’s Monday morning and the U.S. Dollar has been in a tailspin for
three weeks. As such, it is safe to assume that many traders are holding large
short USD positions. However, the employment data for the United States is
due to be released on Friday. It is likely that with this key piece of economic
information soon to be made public, the USD could experience a short-term
rally leading up to the data on Friday as traders pare down their short positions.
The point here is that economic indicators can affect prices directly (following
their release to the public) or indirectly (as traders massage their positions in
anticipation of the data).
Understand which particular aspect of the economy is being revealed in
the data. For example, you should know which indicators measure the growth
of the economy (GDP) versus those that measure inflation (PPI, CPI) or
employment (nonfarm payrolls). After you follow the data for a while, you will
become very familiar with the nuances of each economic indicator and which
part of the economy it measures.
Chapter 10_[99-114].qxd 2/24/10 10:11 PM Page 110
Fundamental Analysis
Not all economic indicators are created equal. Well, they might have been
created with equal importance but along the way, some have acquired much
greater potential to move the markets than others. Market participants will
place higher regard on one statistic versus another depending on the state of the
economy.
Know which indicators the markets are keying on. For example, if prices
(inflation) are not a crucial issue for a particular country, the markets will prob-
ably not as keenly anticipate or react to inflation data. However, if economic
growth is a vexing problem, changes in employment data or GDP will be
eagerly anticipated and could precipitate tremendous volatility following its
release.
The data itself is not as important as whether it falls within market expec-
tations. Besides knowing when all the data will hit the wires, it is vitally impor-
tant that you know what economists and other market pundits are forecasting
for each indicator. For example, knowing the economic consequences of an
unexpected monthly rise of 0.3 percent in the producer price index (PPI) is not
nearly as vital to your short-term trading decisions as it is to know that this
month the market was looking for PPI to fall by 0.1 percent. As mentioned, you
should know that PPI measures prices and that an unexpected rise could be a
sign of inflation. But analyzing the longer-term ramifications of this unexpected
monthly rise in prices can wait until after you have taken advantage of the
trading opportunities presented by the data. Once again, market expectations
for all economic releases are published on various sources on the Web and you
should post these expectations on your calendar along with the release date of
the indicator.
Do not get caught up in the headlines, however. Part of getting a handle
on what the market is forecasting for various economic indicators is knowing
the key aspects of each indicator. While your macroeconomics professor might
have drilled the significance of the unemployment rate into your head, even
junior traders can tell you that the headline figure is for amateurs and that the
most closely watched detail in the payroll data is the nonfarm payrolls figure.
Other economic indicators are similar because the headline figure is not nearly
as closely watched as the finer points of the data. PPI, for example, measures
changes in producer prices. But the statistic most closely watched by the mar-
kets is PPI, minus food and energy price changes. Traders know that the food
and energy component of the data is much too volatile and subject to revisions
on a month-to-month basis to provide an accurate reading on the changes in
producer prices.
Speaking of revisions, do not be too quick to pull that trigger should a par-
ticular economic indicator fall outside of market expectations. Contained in
each new economic indicator released to the public are revisions to previously
released data. For example, if durable goods should rise by 0.5 percent in the
111
Chapter 10_[99-114].qxd 2/24/10 10:11 PM Page 111
THE TOOLS OF THE TRADE
112
current month, while the market is anticipating them to fall, the unexpected rise
could be the result of a downward revision to the prior month. Look at revisions
to older data because in this case, the previous month’s durable goods figure
might have been originally reported as a rise of 0.5 percent but now, along with
the new figures, it is being revised to indicate a rise of only 0.1 percent.
Therefore, the unexpected rise in the current month is likely the result of a
downward revision to the previous month’s data.
TIP: It is not uncommon for prices to surge one way immediately after a
news announcement—only to quickly turn and head in the opposite direction.
Give the markets time to talk before you decide what they are saying about the
news.
Do not forget that there are two sides to a trade in the foreign exchange
market. So, while you might have a handle on the complete package of eco-
nomic indicators published in the United States or Europe, most other coun-
tries also publish similar economic data. The important thing to remember here
is that not all countries are as efficient as the G8 in releasing this information.
Once again, if you are going to trade the currency of a particular country, you
need to find out the particulars about that country’s economic indicators. As
mentioned earlier, not all of these indicators carry the same weight in the mar-
kets and not all of them are as accurate as others. Do your homework so you will
not be caught off guard.
When it comes to focusing exclusively on the impact that economic
indicators have on price action in a particular market, the foreign exchange
markets are the most challenging. Therefore, they have the greatest potential
for profits of any market. Obviously, factors other than economic indicators
move prices and as such make other markets more or less potentially
profitable. But since a currency is a proxy for the country it represents, the
economic health of that country is priced into the currency. One important
way to measure the health of an economy is through economic indicators.
The challenge comes in diligently keeping track of the nuts and bolts of
each country’s particular economic information package. Here are a few
general comments about economic indicators and some of the more closely
watched data.
Most economic indicators can be divided into leading and lagging indica-
tors. Leading indicators are economic factors that change before the economy
starts to follow a particular pattern or trend. Leading indicators are used to predict
changes in the economy. Lagging indicators are economic factors that change after
the economy has already begun to follow a particular pattern or trend.
The problem with fundamental analysis is that it is difficult to convert the
“qualitative” information into a specific price prediction. With FOREX leverage
being what it is, it is seldom enough to know that a report is “bullish” for a cur-
rency without being able to attach specific values.
Chapter 10_[99-114].qxd 2/24/10 10:11 PM Page 112
Fundamental Analysis
Econometric analysis attempts to quantify the often qualitative funda-
mental factors into a mathematical model. These models can become enor-
mously complex. The problems with econometric analysis are twofold: It is
difficult to objectively quantify qualitative information such as a news
announcement. The interactions and specific weights of each factor are con-
stantly in flux and the relationships between them are almost certainly nonlin-
ear. Relationships that hold today are invalid tomorrow.
Summary
Fundamental analysis is a very deep well. It is important to understand the basic
fundamentals that drive currency prices, even though most traders use technical
analysis to make specific day-to-day trading decisions.
Fundamentals can be extremely powerful and useful to the trader. But
they have a much steeper learning curve to use effectively than do technicals.
Even if you opt for a technical analysis trading approach, as most traders
do, do not completely ignore the fundamentals. Use a new service to do a daily
take on what is happening. Remember: Be aware of pending reports and statis-
tical releases. They often will cause a violent market reaction one way or the
other. The impact of fundamental information is more important than the
information itself.
113
Chapter 10_[99-114].qxd 2/24/10 10:11 PM Page 113
Chapter 10_[99-114].qxd 2/24/10 10:11 PM Page 114
115
11
Technical Analysis
Chapter
Overview
The most popular and successful method of making decisions and analyzing
FOREX markets is technical analysis. Technical analysis is used by large and
small traders alike. The difference between technical and fundamental analy-
ses is that technical analysis ignores fundamental factors and is applied only
to the price action of the market. Although fundamental data can often
provide only a long-term forecast of exchange rate movements, technical
analysis has become the primary tool to successfully analyze and trade
shorter-term price movements, as well as to set profit targets and stop-loss
safeguards because of its ability to generate price-specific information and
forecasts.
Historically, technical analysis in the futures markets has focused on the
six price fields available during any given period of time: open, high, low, close,
volume, and open interest. Since the FOREX market has no central exchange, it
is difficult to estimate the latter two fields, volume and open interest. In this
chapter, we limit our analysis to the first four price fields.
Technical analysis consists primarily of a variety of technical studies, each
of which can be interpreted to predict market direction or to generate buy and
sell signals. Many technical studies share one common important tool: a price-
time chart that emphasizes selected characteristics in the price motion of the
underlying security. One great advantage of technical analysis is its “visualness.”
A picture is worth a thousand words.
Chapter 11_[115-140].qxd 2/25/10 3:52 PM Page 115
THE TOOLS OF THE TRADE
116
Bar Charts
Bar charts are the most widely used type of chart in security market technical
analysis and date back to the last decade of the nineteenth century. They are
popular because they are easy to construct and understand. These charts are
constructed by representing intraday, daily, weekly, or monthly activity as a ver-
tical bar. Opening and closing prices are represented by horizontal marks to the
left and right of the vertical bar respectively. Spotting both patterns and the
trend of a market, two of the essentials of chart reading, is often easiest using bar
charts. Bar charts present the data individually, without linking prices to neigh-
boring prices. Each set of price fields is a single “island.”
Each vertical bar has the components shown in Figure 11.1.
Figure 11.2 shows a daily bar chart for the EUR/USD currency pair for
the month of June 2003. The vertical scale on the right represents the cost of
one Euro in terms of U.S. Dollars. The horizontal legend at the bottom of the
chart represents the day of week.
A common method of classifying the vertical bars is to show the relation-
ships between the opening and closing prices within a single time interval as
either bull or bear bars, as seen in Figure 11.3.
Graphically, an open/high/low/close (OHLC) bar chart is defined using
the following algorithm:
OHLC Bar Chart Algorithm
• Step 1—One vertical rectangle whose upper boundary represents the
high for the day and whose lower boundary represents the low for the
given time period.
• Step 2—One horizontal rectangle to the left of the high-low rectangle
whose central value represents the opening price for the given period.
• Step 3—One horizontal rectangle to the right of the high-low rectangle
whose central value represents the closing price for the given period.
High
Open
Close
Low
FIGURE 11.1 Anatomy of Single Vertical Bar
Chapter 11_[115-140].qxd 2/25/10 3:52 PM Page 116
Technical Analysis
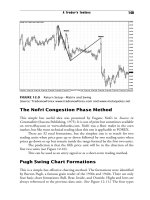
One interesting variation to the standard OHLC bar chart was developed
by author/trader Burton Pugh is the 1930s. His model involved connecting the
previous set of quotes to the current set of quotes, which generates a continuous
line representation of price movements. There are four basic formations
between two adjacent vertical bars in Burton’s system. (See Figure 11.4.)
These are often called swing charts. To see how they can be used by break-
ing them into four types, see Pugh Charts in Chapter 12, “A Trader’s Toolbox.”
Bar chart interpretation is one of the most fascinating and well-studied
topics in the realm of technical analysis. Recurring bar chart formations have
been labeled, categorized, and analyzed in detail. Common formations like tops,
117
FIGURE 11.2 Vertical Bar Chart
Close
Open
Open
Close
Bull Bar
Bear Bar
FIGURE 11.3 Anatomy of Bull and Bear Bars
Chapter 11_[115-140].qxd 2/25/10 3:52 PM Page 117
THE TOOLS OF THE TRADE
118
bottoms, head-and-shoulders, inverted head-and-shoulders, lines of support
and resistance, reversals, and so forth, are examined in the following sections.
Trendlines
A trend can be up, down, or lateral and is represented by drawing a straight line
above the daily highs in a downward trend and a straight line below the daily
lows in an upward trend. See Figure 11.5.
ABAB
ABAB
Bull
Higher Highs, Higher Lows
Outside
Higher Highs, Lower Lows
Bear
Lower Highs, Lower Lows
Inside
Lower Highs, Higher Lows
FIGURE 11.4 Continuous Line Bar Chart
Trendline
Trendline
Trendline
FIGURE 11.5 Bar Chart with Trendlines
Chapter 11_[115-140].qxd 2/25/10 3:52 PM Page 118
Technical Analysis
A common trading technique involves the intersection of the trendline
with the most recent prices. If the trendline for a downward trend crosses
through the most recent prices, a buy signal is generated. Conversely, if the
trendline for an upward trend passes through the most recent prices, then a sell
signal is generated.
Support and Resistance
Support levels indicate the price at which most traders feel that prices will move
higher. There is sufficient demand for a security to cause a halt in a downward
trend and turn the trend up. You can spot support levels on the bar charts by
looking for a sequence of daily lows that fluctuate only slightly along a horizon-
tal line. When a support level is penetrated (the price drops below the support
level) it often becomes a resistance level; this is because traders want to limit
their losses and will sell later, when prices approach the former level.
Like support levels, resistance levels are horizontal lines on the bar chart.
They mark the upper level for trading, or a price at which sellers typically out-
number buyers. When resistance levels are broken, the price moves above the
resistance level, and often does so decisively. See Figure 11.6.
Many traders find lines of support and resistance useful in determining
the placement of stop-loss and take-profit limit orders.
Recognizing Chart Patterns
Proper identification of an ongoing trend can be a tremendous asset to the
trader. However, the trader must also learn to recognize recurring chart patterns
that disrupt the continuity of trendlines. Broadly speaking, these chart patterns
can be categorized as reversal patterns and continuation patterns.
119
Resistance
Support
FIGURE 11.6 Bar Chart with Support and Resistance Lines
Chapter 11_[115-140].qxd 2/25/10 3:52 PM Page 119
THE TOOLS OF THE TRADE
120
Reversal Patterns
Reversal patterns are important because they inform the trader that a market
entry point is unfolding or that it may be time to liquidate an open position.
Figures 11.7 through 11.10 illustrate the most common reversal patterns.
FIGURE 11.7 Double Top
FIGURE 11.8 Double Bottom
Left Shoulder
Head
Right Shoulder
Neckline
FIGURE 11.9 Head-and-Shoulders Top
Chapter 11_[115-140].qxd 2/25/10 3:52 PM Page 120
Technical Analysis
Continuation Patterns
A continuation pattern implies that while a visible trend was in progress, it was tem-
porarily interrupted, and then continued in the direction of the original trend. The
most common continuation patterns are shown in Figures 11.11 through 11.15.
The proper identification of a continuation pattern may prevent the trader
from prematurely liquidating an open position that still has profit potential.
121
FIGURE 11.10 Head-and-Shoulders Bottom
FIGURE 11.11 Flag or Pennant
FIGURE 11.12 Symmetrical Triangle
Chapter 11_[115-140].qxd 2/25/10 3:52 PM Page 121
THE TOOLS OF THE TRADE
122
FIGURE 11.13 Ascending Triangle
FIGURE 11.14 Descending Triangle
FIGURE 11.15 Rectangle
Chapter 11_[115-140].qxd 2/25/10 3:52 PM Page 122
Technical Analysis
These are some of the most common classical bar chart formations. Do
they work? Sometimes. They worked more often in years gone by when fewer
traders knew about them. Nowadays, everyone knows what a head and shoul-
ders looks like. The result? Traders will begin to anticipate the second shoulder
and sell before it forms. The result—often, no head and shoulders forms—just
one shoulder and a head. This is how the market discounts information.
Methods that work well initially become less and less effective over the years.
Candlestick Charts
These charts have found great popularity with currency traders. Candlestick
charting is usually credited to the Japanese rice trader Munehisa Homma in the
early eighteenth century, though many references indicate that this method of
technical analysis probably existed as early as the 1600s. Steven Nison of Merrill
Lynch is credited with popularizing candlestick charting in Western markets
and has become recognized as the leading expert on their interpretation. See
Figure 11.16.
The candlestick is the graphic representation of the price bar: the open,
high, low, and closing price of the period. The algorithm to construct a candle-
stick chart follows.
The elements of a candlestick bar are shown in Figure 11.17.
123
FIGURE 11.16 Candlestick Chart
Chapter 11_[115-140].qxd 2/25/10 3:52 PM Page 123
THE TOOLS OF THE TRADE
124
The nomenclature used to identify individual or consecutive combina-
tions of candlesticks is rich in imagery: Hammer, hanging man, dark cloud
cover, morning star, three black crows, three mountains, three advanced white
soldiers, and spinning tops are only a few of the candlestick patterns that have
been categorized and used in technical analysis.
High
Upper shadow
Real body
Close
Open
Close
Open
Lower shadow
Low
FIGURE 11.17 Anatomy of Candlestick Bar
Candlestick Chart Algorithm
• Step 1—The candlestick is made up of a body and two shadows.
• Step 2—The body is depicted as a vertical column bounded by the
opening price and the closing price.
• Step 3—The shadows are just vertical lines—a line above the body to
the high of the day (the upper shadow) and a line below the body to
the low of the day (the lower shadow).
• Step 4—It is customary for the body to be empty if the close was
higher than the open (a bull day) and filled if the close was lower than
the open (a bear day).
A thorough description of how to interpret candlestick charts is given in
Steven Nison’s books: Japanese Candlestick Charting Techniques (Hall, 1991) and
Beyond Candlesticks: More Japanese Charting Techniques Revealed (John Wiley &
Sons, 1994). A summary of the different candlestick patterns can also be found
at www.hotcandle.com/candle.htm.
Chapter 11_[115-140].qxd 2/25/10 3:52 PM Page 124