Pearson Education Management Accounting for Decision Makers_13 doc
Bạn đang xem bản rút gọn của tài liệu. Xem và tải ngay bản đầy đủ của tài liệu tại đây (812.03 KB, 38 trang )
How much cash should be held?
Although cash can be held for each of the reasons identified, doing so may not always
be necessary. If a business is able to borrow quickly, the amount of cash it needs to
hold can be reduced. Similarly, if the business holds assets that can easily be converted
to cash (for example, marketable securities such as shares in Stock Exchange listed
businesses or government bonds), the amount of cash held can be reduced.
The decision as to how much cash a particular business should hold is a difficult
one. Different businesses will have different views on the subject.
CHAPTER 11 MANAGING WORKING CAPITAL
432
Why do you think a business may decide to hold at least some of its assets in the form
of cash? (Hint: There are broadly three reasons.)
The three reasons are:
1 To meet day-to-day commitments, a business requires a certain amount of cash.
Payments for wages, overhead expenses, goods purchased and so on must be made
at the due dates. Cash has been described as the lifeblood of a business. Unless it
circulates through the business and is available for the payment of claims as they
become due, the survival of the business will be at risk. Profitability is not enough; a
business must have sufficient cash to pay its debts when they fall due.
2 If future cash flows are uncertain for any reason, it would be prudent to hold a balance
of cash. For example, a major customer that owes a large sum to the business may
be in financial difficulties. Given this situation, the business can retain its capacity to
meet its obligations by holding a cash balance. Similarly, if there is some uncertainty
concerning future outlays, a cash balance will be required.
3 A business may decide to hold cash to put itself in a position to exploit profitable oppor-
tunities as and when they arise. For example, by holding cash, a business may be able
to acquire a competitor’s business that suddenly becomes available at an attractive price.
Activity 11.7
What do you think are the major factors that influence how much cash a business will
hold? See if you can think of five possible factors.
You may have thought of the following:
l The nature of the business. Some businesses, such as utilities (for example, water, elec-
tricity and gas suppliers), may have cash flows that are both predictable and reasonably
certain. This will enable them to hold lower cash balances. For some businesses, cash bal-
ances may vary greatly according to the time of year. A seasonal business may accumul-
ate cash during the high season to enable it to meet commitments during the low season.
l The opportunity cost of holding cash. Where there are profitable opportunities it may
not be wise to hold a large cash balance.
l The level of inflation. Holding cash during a period of rising prices will lead to a loss of
purchasing power. The higher the level of inflation, the greater will be this loss.
l The availability of near-liquid assets. If a business has marketable securities or inventories
that may easily be liquidated, high cash balances may not be necessary.
Activity 11.8
M11_ATRI3622_06_SE_C11.QXD 5/29/09 3:32 PM Page 432
Controlling the cash balance
Several models have been developed to help control the cash balance of the business.
One such model proposes the use of upper and lower control limits for cash balances
and the use of a target cash balance. The model assumes that the business will invest
in marketable investments that can easily be liquidated. These investments will be pur-
chased or sold, as necessary, in order to keep the cash balance within the control limits.
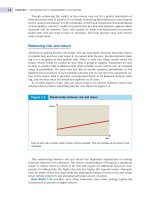
The model proposes two upper and two lower control limits (see Figure 11.6). If the
business exceeds an outer limit, the managers must decide whether the cash balance
is likely to return to a point within the inner control limits set, over the next few days.
MANAGING CASH
433
l The availability of borrowing. If a business can borrow easily (and quickly) there is less
need to hold cash.
l The cost of borrowing. When interest rates are high, the option of borrowing becomes
less attractive.
l Economic conditions. When the economy is in recession, businesses may prefer to hold
cash so that they can be well placed to invest when the economy improves. In addition,
during a recession, businesses may experience difficulties in collecting trade receivables.
They may therefore hold higher cash balances than usual in order to meet commitments.
l Relationships with suppliers. Too little cash may hinder the ability of the business to pay
suppliers promptly. This can lead to a loss of goodwill. It may also lead to discounts
being forgone.
Controlling the cash balance
Figure 11.6
Management sets the upper and lower limits for the business’s cash balance. When the balance
goes beyond either of these limits, unless it is clear that the balance will return fairly quickly to
within the limit, action will need to be taken. If the upper limit is breached, some cash will be
placed on deposit or used to buy some marketable securities. If the lower limit is breached, the
business will need to borrow some cash or sell some securities.
M11_ATRI3622_06_SE_C11.QXD 5/29/09 3:32 PM Page 433
If this seems likely, then no action is required. If, on the other hand, it does not seem
likely, management must change the cash position by either buying or selling mar-
ketable investments.
In Figure 11.6 we can see that the lower outer control limit has been breached for
four days. If a four-day period is unacceptable, managers must sell marketable invest-
ments to replenish the cash balance.
The model relies heavily on management judgement to determine where the control
limits are set and the period within which breaches of the control limits are acceptable.
Past experience may be useful in helping managers decide on these issues. There are
other models, however, that do not rely on management judgement. Instead, these use
quantitative techniques to determine an optimal cash policy. One model proposed,
for example, is the cash equivalent of the inventories economic order quantity model,
discussed earlier in the chapter.
Cash budgets and managing cash
To manage cash effectively, it is useful for a business to prepare a cash budget. This is
a very important tool for both planning and control purposes. Cash budgets were
considered in Chapter 6, and so we shall not consider them again in detail. However,
it is worth repeating that these statements enable managers to see how planned events
are expected to affect the cash balance. The projected cash flow statement will identify
periods when cash surpluses and cash deficits are expected.
When a cash surplus is expected to arise, managers must decide on the best use of
the surplus funds. When a cash deficit is expected, managers must make adequate
provision by borrowing, liquidating assets or rescheduling cash payments or receipts to
deal with this. Cash budgets are useful in helping to control the cash held. The actual
cash flows can be compared with the planned cash flows for the period. If there is a
significant divergence between the projected, or forecast, cash flows and the actual
cash flows, explanations must be sought and corrective action taken where necessary.
To refresh your memory on cash budgets, it would probably be worth looking back
at pp. 194–197 in Chapter 6.
Although cash budgets are prepared primarily for internal management purposes, pro-
spective lenders sometimes require them when a loan to a business is being considered.
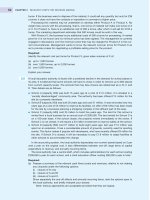
The operating cash cycle
When managing cash, it is important to be aware of the operating cash cycle (OCC)
of the business. For a retailer, for example, this may be defined as the period between the
outlay of cash necessary for the purchase of inventories and the ultimate receipt of cash
from the sale of the goods. In the case of a business that purchases goods on credit for sub-
sequent resale on credit (for example, a wholesaler), the OCC is as shown in Figure 11.7.
Figure 11.7 shows that payment for inventories acquired on credit occurs some time
after those inventories have been purchased and, therefore, no immediate cash outflow
arises from the purchase. Similarly, cash receipts from credit customers will occur some
time after the sale is made and so there will be no immediate cash inflow as a result of
the sale. The OCC is the period between the payment made to the supplier for goods
concerned and the cash received from the credit customer. Although Figure 11.7
depicts the position for a wholesaling business, the precise definition of the OCC can
easily be adapted for other types of business.
The OCC is important because it has a significant influence on the financing
requirements of the business. Broadly, the longer the cycle, the greater the financing
CHAPTER 11 MANAGING WORKING CAPITAL
434
‘
M11_ATRI3622_06_SE_C11.QXD 5/29/09 3:32 PM Page 434
requirements of the business and the greater the financial risks. For this reason, the
business is likely to want to reduce the OCC to the minimum possible period.
For the type of business mentioned above, which buys and sells on credit, the OCC
can be calculated from the financial statements by the use of certain ratios. It is calcu-
lated as shown in Figure 11.8.
MANAGING CASH
435
The operating cash cycle
Figure 11.7
The OCC is the time lapse between paying for goods and receiving the cash from the sale of
those goods. The length of the OCC has a significant impact on the amount of funds that the
business needs to apply to working capital.
Calculating the operating cash cycle
Figure 11.8
For businesses that buy and sell on credit, three ratios are required to calculate the OCC.
M11_ATRI3622_06_SE_C11.QXD 5/29/09 3:32 PM Page 435
CHAPTER 11 MANAGING WORKING CAPITAL
436
The financial statements of Freezeqwik Ltd, a distributor of frozen foods, for the year
ended 31 December last year are set out below.
Income statement for the year ended 31 December last year
£000 £000
Sales revenue 820
Cost of sales
Opening inventories 142
Purchases 568
710
Closing inventories (166) (544)
Gross profit 276
Administration expenses (120)
Distribution expenses (95)
Operating profit 61
Financial expenses (32)
Profit before taxation 29
Taxation (7)
Profit for the year 22
Statement of financial position as at 31 December last year
£000
Non-current assets
Property, plant and equipment
Premises at valuation 180
Fixtures and fittings at cost less depreciation 82
Motor vans at cost less depreciation 102
364
Current assets
Inventories 166
Trade receivables 264
Cash 24
454
Total assets 818
Equity
Ordinary share capital 300
Retained earnings 352
652
Current liabilities
Trade payables 159
Taxation 7
166
Total equity and liabilities 818
All purchases and sales are on credit. There has been no change in the level of trade
receivables or payables over the period.
Calculate the length of the OCC for the business and go on to suggest how the busi-
ness may seek to reduce this period.
Activity 11.9
M11_ATRI3622_06_SE_C11.QXD 5/29/09 3:32 PM Page 436
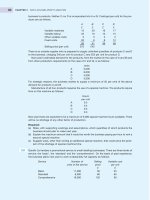
Real World 11.11 shows the average operating cash cycle for large European
businesses.
MANAGING CASH
437
The OCC may be calculated as follows:
Number of days
Average inventories turnover period:
× 365 =×365 103
Average settlement period for trade receivables:
× 365 =×365 118
Average settlement period for trade payables:
× 365 =×365 (102)
OCC 119
The business can reduce the length of the OCC in a number of ways. The average
inventories turnover period seems quite long. At present, average inventories held
represent more than three months’ sales requirements. Lowering the level of inventories
held will reduce this. Similarly, the average settlement period for trade receivables seems
long, at nearly four months’ sales. Imposing tighter credit control, offering discounts,
charging interest on overdue accounts and so on may reduce this. However, any policy
decisions concerning inventories and trade receivables must take account of current
trading conditions.
Extending the period of credit taken to pay suppliers could also reduce the OCC.
However, for reasons that will be explained later, this option must be given careful
consideration.
159
568
Trade payables
Credit purchases
264
820
Trade receivables
Credit sales
(142 + 166)/2
544
(Opening inventories + Closing inventories)/2
Cost of sales
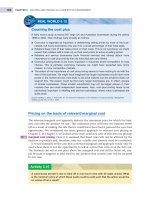
REAL WORLD 11.11
Cycling along
The annual survey of working capital by REL Consulting and CFO Europe (see Real World
11.2 above) calculates the average operating cash cycle for the top 1,000 European busi-
nesses (excluding the financial sector). Comparative figures for the five-year period end-
ing in 2007 are shown in Figure 11.9.
‘
M11_ATRI3622_06_SE_C11.QXD 5/29/09 3:32 PM Page 437
Cash transmission
A business will normally wish to benefit from receipts from customers at the earliest
opportunity. The benefit is immediate where payment is made in cash. However, when
payment is made by cheque, there is normally a delay of three to four working days
before the cheque can be cleared through the banking system. The business must
therefore wait for this period before it can benefit from the amount paid in. In the case
of a business that receives large amounts in the form of cheques, the opportunity cost
of this delay can be significant.
To avoid this cost, a business could require payments to be made in cash. This is not
usually very practical, mainly because of the risk of theft and/or the expense of con-
veying cash securely. Another option is to ask for payment to be made by standing
order or by direct debit from the customer’s bank account. This should ensure that the
amount owing is always transferred from the bank account of the customer to the bank
account of the business on the day that has been agreed.
It is also possible for funds to be transferred directly to a business’s bank account.
Customers can pay for items by using debit cards, which results in the appropriate
account being instantly debited and the seller’s bank account being instantly credited
with the required amount. This method of payment is widely used by large retail busi-
nesses, and can be extended to other types of business.
CHAPTER 11 MANAGING WORKING CAPITAL
438
Real World 11.11 continued
The survey calculates the operating cash cycle using year-end figures for trade receiv-
ables, inventories and trade payables. We can see that there has been a slight improve-
ment in 2007 compared to the two previous years.
Source: Compiled from information in 2008 REL/CFO European Working Capital Survey, www.relconsult.com.
The average OCC of large European businesses
Figure 11.9
M11_ATRI3622_06_SE_C11.QXD 5/29/09 3:32 PM Page 438
Bank overdrafts
Bank overdrafts are simply bank current accounts that have a negative balance. They
are a type of bank loan and can be a useful tool in managing the business’s cash flow
requirements.
Real World 11.12 shows how Indesit, a large white-goods manufacturer, managed to
improve its cash flows through better working capital management.
Trade credit arises from the fact that most businesses buy their goods and service
requirements on credit. In effect, suppliers are lending the business money, interest-
free, on a short-term basis. Trade payables are the other side of the coin from trade
receivables. One business’s trade payable is another one’s trade receivable, in respect
of a particular transaction. Trade payables are an important source of finance for
most businesses. They have been described as a ‘spontaneous’ source, as they tend
to increase in line with the increase in the level of activity achieved by a business.
Trade credit is widely regarded as a ‘free’ source of finance and, therefore, a good
thing for a business to use. There may be real costs, however, associated with taking
trade credit.
Managing trade payables
MANAGING TRADE PAYABLES
439
REAL WORLD 11.12
Dash for cash
Despite an impressive working capital track record, a 50% plunge in profit at Indesit in
2005 led to the creation of a new three-year plan that meant an even stronger emphasis
on cash generation. Operating cash flow was added to the incentive scheme for senior
and middle managers, who subsequently released more cash from Indesit’s already lean
processes by ‘attacking the areas that were somehow neglected’, Crenna [the chief finan-
cial officer] says.
Hidden in the dark corners of the accounts-receivable department in the UK’s after-
sales service operation, for example, were a host of delinquent, albeit small, payments –
in some cases overdue by a year or more. ‘If you don’t put a specific focus on these
receivables, it’s very easy for them to become neglected,’ Crenna says. ‘In theory, nobody
worries about collecting £20. In reality, we were sitting on a huge amount of receivables,
though each individual bill was for a small amount.’
More trapped cash was found in the company’s spare-parts inventory. The inventory is
worth around A30m today compared with around A40m three years ago. ‘This was a good
result that came just from paying the same level of attention to spare parts as to finished
products,’ Crenna says. In general, Indesit has been able to improve working capital
performance through ‘fine-tuning rather than launching epic projects’. Over the past two
years, according to REL, Indesit has released A115m from its working capital processes.
Source: Karaian, J., ‘Dash for Cash’, CFO Europe Magazine, 8 July 2008, www.CFO.com.
M11_ATRI3622_06_SE_C11.QXD 5/29/09 3:32 PM Page 439
First, customers who take credit may not be as well treated as those who pay imme-
diately. For example, when goods are in short supply, credit customers may receive
lower priority when allocating the goods available. In addition, credit customers may
be less favoured in terms of delivery dates or the provision of technical support services.
Sometimes, the goods or services provided may be more costly if credit is required.
However, in most industries, trade credit is the norm. As a result, the above costs will
not apply except, perhaps, to customers that abuse the credit facilities. A business that
purchases supplies on credit will normally have to incur additional administration and
accounting costs in dealing with the scrutiny and payment of invoices, maintaining
and updating payables accounts, and so on.
These points are not meant to imply that taking credit represents a net cost to a
business. There are, of course, real benefits that can accrue. Provided that trade credit
is not abused, it can represent a form of interest-free loan. It can be a much more
convenient method of paying for goods and services than paying by cash, and during
a period of inflation there will be an economic gain by paying later rather than sooner
for goods and services purchased. For most businesses, these benefits will exceed the
costs involved.
In some cases, delaying payment can be a sign of financial problems. One such
example is given in Real World 11.13.
Taking advantage of cash discounts
Where a supplier offers a discount for prompt payment, the business should give care-
ful consideration to the possibility of paying within the discount period. An example
may be useful to illustrate the cost of forgoing possible discounts.
CHAPTER 11 MANAGING WORKING CAPITAL
440
REAL WORLD 11.13
NHS waiting times
The National Health Service is delaying paying bills and cutting orders for supplies as it tries to
balance its books, according to the trade associations whose members supply the service with
everything from scanners to diagnostic tests.
Ray Hodgkinson, director-general of the British Healthcare Trades Association, said that while
the picture was highly variable ‘some of our members are having real trouble getting money out of
NHS trusts’.
Most had standing orders that said bills should be paid within 30 days, Mr Hodgkinson said.
‘But some are not paying for 60 or 90 days and even longer. They are in breach of their standing
orders and for a lot of our members who are small businesses this is creating problems with cash
flow. There is no doubt there is slow payment on a significant scale.’ . . .
Doris-Ann Williams, director-general of the British In-Vitro Diagnostics Association, whose
members provide diagnostics supplies and tests, said: ‘We are starting to see invoices not being
paid and orders not being closed until the start of the new financial year [in April].
‘All sorts of measures are being taken to try not to spend money in this financial year.’
Having seen orders dry up and bills not paid this time last year as the NHS headed for a £500m-
plus financial deficit, she added that this was ‘starting to seem like an annual event’.
Source: NHS paying bills late in struggle to balance books, say suppliers, ft.com (Timmins, N.), © The Financial Times Limited,
13 February 2007.
FT
M11_ATRI3622_06_SE_C11.QXD 5/29/09 3:32 PM Page 440
Controlling trade payables
To help monitor the level of trade credit taken, management can calculate the average
settlement period for trade payables. This ratio is:
Average settlement period for trade payables
== ××
365
Once again, this provides an average figure, which could be misleading. A more
informative approach would be to produce an ageing schedule for payables. This
would look much the same as the ageing schedule for receivables described earlier
in Example 11.3.
We saw earlier that delaying payment to suppliers may create problems for a business.
Real World 11.14, however, describes how cash-strapped businesses may delay payments
and still retain the support of its suppliers.
Average trade payables
Credit purchases
MANAGING TRADE PAYABLES
441
Hassan Ltd takes 70 days to pay for goods from its supplier. To encourage prompt
payment, the supplier has offered the business a 2 per cent discount if payment
for goods is made within 30 days.
Hassan Ltd is not sure whether it is worth taking the discount offered.
If the discount is taken, payment could be made on the last day of the discount
period (that is, the 30th day). However, if the discount is not taken, payment will
be made after 70 days. This means that, by not taking the discount, the business
will receive an extra 40 (that is, 70 − 30) days’ credit. The cost of this extra credit
to the business will be the 2 per cent discount forgone. If we annualise the cost of
this discount forgone, we have:
365/40 × 2% = 18.3%*
We can see that the annual cost of forgoing the discount is very high, and so
it may be profitable for the business to pay the supplier within the discount
period, even if it means that it will have to borrow to enable it to do so.
* This is an approximate annual rate. For the more mathematically minded, the precise rate is
([(1 + 2/98)
9.125
] − 1) × 100% = 20.2%
Example 11.4
‘
REAL WORLD 11.14
Credit stretch
According to Gavin Swindell, European managing director of REL, a research and con-
sulting firm, there are ‘win-win’ ways of extending credit terms. He states:
‘A lot of businesses aren’t worried about getting paid in 40 or 45 days, but are more interested in
the certainty of payment on a specific date.’
Jas Sahota, a partner in Deloitte’s UK restructuring practice, says that three-month extensions
are common, ‘as long as the supplier can see that there is a plan’. In times of stress, he says, it’s
‘
M11_ATRI3622_06_SE_C11.QXD 5/29/09 3:32 PM Page 441
CHAPTER 11 MANAGING WORKING CAPITAL
442
Real World 11.14 continued
important to negotiate with only a handful of the most important partners – squeezing suppliers
large and small only generates grief and distracts employees with lots of calls.
More fundamentally, the benefits of pulling the payables lever in isolation is ‘questionable’,
notes Andrew Ashby, director of the working capital practice at KPMG in London, ‘especially as
the impact on the receivables balance is typically a lot more than the payables balance’.
Improving collections, such as achieving longer payment terms, relies on the strength of rela-
tionships built over time, notes Robert Hecht, a London-based managing director of turnaround
consultancy AlixPartners. ‘You can’t wait for a crisis, and then expect suppliers to step up and be
your best friends.’
Source: Karaian, J., ‘Dash for Cash’, CFO Europe Magazine, 8 July 2008, www.CFO.com.
The main points of this chapter may be summarised as follows.
Working capital
l Working capital is the difference between current assets and current liabilities.
l That is,
working capital = inventories + receivables + cash − payables − bank overdrafts.
l An investment in working capital cannot be avoided in practice – typically large
amounts are involved.
Inventories
l There are costs of holding inventories, which include:
– Lost interest.
– Storage cost.
– Insurance cost.
– Obsolescence.
l There are also costs of not holding sufficient inventories, which include:
– Loss of sales and customer goodwill.
– Production dislocation.
– Loss of flexibility – cannot take advantage of opportunities.
– Reorder costs – low inventories imply more frequent ordering.
l Practical points on inventories management include:
– Identify optimum order size – models can help with this.
– Set inventories reorder levels.
– Use forecasts.
– Keep reliable inventories records.
– Use accounting ratios (for example, inventories turnover period ratio).
– Establish systems for security of inventories and authorisation.
– Consider just-in-time (JIT) inventories management.
SUMMARY
M11_ATRI3622_06_SE_C11.QXD 5/29/09 3:32 PM Page 442
Trade receivables
l When assessing which customers should receive credit, the five Cs of credit can be used:
– Capital.
– Capacity.
– Collateral.
– Condition.
– Character.
l The costs of allowing credit include:
– Lost interest.
– Lost purchasing power.
– Costs of assessing customer creditworthiness.
– Administration cost.
– Bad debts.
– Cash discounts (for prompt payment).
l The costs of denying credit include:
– Loss of customer goodwill.
l Practical points on receivables management:
– Establish a policy.
– Assess and monitor customer creditworthiness.
– Establish effective administration of receivables.
– Establish a policy on bad debts.
– Consider cash discounts.
– Use financial ratios (for example, average settlement period for trade receivables ratio).
– Use ageing summaries.
Cash
l The costs of holding cash include:
– Lost interest.
– Lost purchasing power.
l The costs of holding insufficient cash include:
– Loss of supplier goodwill if unable to meet commitments on time.
– Loss of opportunities.
– Inability to claim cash discounts.
– Costs of borrowing (should an obligation need to be met at short notice).
l Practical points on cash management:
– Establish a policy.
– Plan cash flows.
– Make judicious use of bank overdraft finance – it can be cheap and flexible.
– Use short-term cash surpluses profitably.
– Bank frequently.
– Operating cash cycle (for a wholesaler) = length of time from buying inventories
to receiving cash from receivables less payables’ payment period (in days).
– Transmit cash promptly.
l An objective of working capital management is to limit the length of the operating
cash cycle (OCC), subject to any risks that this may cause.
Trade payables
l The costs of taking credit include:
– Higher price than purchases for immediate cash settlement.
– Administrative costs.
– Restrictions imposed by seller.
SUMMARY
443
M11_ATRI3622_06_SE_C11.QXD 5/29/09 3:32 PM Page 443
If you would like to explore the topics covered in this chapter in more depth, we recommend the
following books:
McLaney, E., Business Finance: Theory and Practice, 8th edn, Financial Times Prentice Hall, 2009,
chapter 13.
Brealey, B., Myers, S. and Allen, F., Corporate Finance, 9th edn, McGraw-Hill, 2008, chapters 30
and 31.
Pike, R. and Neale, B., Corporate Finance and Investment, 5th edn, Prentice Hall, 2006, chapters 13
and 14.
Arnold, G., Corporate Financial Management, 3rd edn, Financial Times Prentice Hall, 2005, chap-
ter 13.
Further reading
CHAPTER 11 MANAGING WORKING CAPITAL
444
Working capital p. 410
Lead time p. 417
ABC system of inventories control
p. 418
Economic order quantity (EOQ) p. 419
Materials requirement planning (MRP)
system p. 422
Just-in-time (JIT) inventories
management p. 422
Five Cs of credit p. 424
Cash discount p. 428
Average settlement period for trade
receivables p. 429
Ageing schedule of trade
receivables p. 429
Operating cash cycle (OCC) p. 434
Average settlement period for trade
payables p. 441
Key terms
‘
l The costs of not taking credit include:
– Lost interest-free borrowing.
– Lost purchasing power.
– Inconvenience – paying at the time of purchase can be inconvenient.
l Practical points on payables management:
– Establish a policy.
– Exploit free credit as far as possible.
– Use accounting ratios (for example, average settlement period for trade payables
ratio).
M11_ATRI3622_06_SE_C11.QXD 5/29/09 3:32 PM Page 444
Answers to these questions can be found in Appendix C at the back of the book.
Tariq is the credit manager of Heltex plc. He is concerned that the pattern of monthly cash
receipts from credit sales shows that credit collection is poor compared with budget. Heltex’s
sales director believes that Tariq is to blame for this situation, but Tariq insists that he is not.
Why might Tariq not be to blame for the deterioration in the credit collection period?
How might each of the following affect the level of inventories held by a business?
(a) An increase in the number of production bottlenecks experienced by the business.
(b) A rise in the level of interest rates.
(c) A decision to offer customers a narrower range of products in the future.
(d) A switch of suppliers from an overseas business to a local business.
(e) A deterioration in the quality and reliability of bought-in components.
What are the reasons for holding inventories? Are these reasons different from the reasons for
holding cash?
Identify the costs of holding:
(a) too little cash;
(b) too much cash.
11.4
11.3
11.2
11.1
Exercises 11.4 to 11.8 are more advanced than 11.1 to 11.3. Those with coloured numbers
have an answer in Appendix D at the back of the book. If you wish to try more exercises, visit
the students’ side of the Companion Website at www.pearsoned.co.uk/atrillmclaney.
Hercules Wholesalers Ltd has been particularly concerned with its liquidity position in recent
months. The most recent income statement and statement of financial position (balance sheet)
of the business are as follows:
Income statement for the year ended 31 December last year
£000
£000
Sales revenue 452
Cost of sales
Opening inventories 125
Purchases 341
466
Closing inventories (143) (323)
Gross profit 129
Expenses (132)
Loss for the year (3)
11.1
EXERCISES
445
REVIEW QUESTIONS
EXERCISES
M11_ATRI3622_06_SE_C11.QXD 5/29/09 3:32 PM Page 445
Statement of financial position as at 31 December last year
£000
Non-current assets
Property, plant and equipment
Premises at valuation 280
Fixtures and fittings at cost less depreciation 25
Motor vehicles at cost less depreciation 52
357
Current assets
Inventories 143
Trade receivables 163
306
Total assets 663
Equity
Ordinary share capital 100
Retained earnings 158
258
Non-current liabilities
Borrowings – Loans 120
Current liabilities
Trade payables 145
Borrowings – Bank overdraft 140
285
Total equity and liabilities 663
The trade receivables and payables were maintained at a constant level throughout the year.
Required:
(a) Explain why Hercules Wholesalers Ltd is concerned about its liquidity position.
(b) Calculate the operating cash cycle for Hercules Wholesalers Ltd based on the information
above. (Assume a 360-day year.)
(c) State what steps may be taken to improve the operating cash cycle of the business.
International Electric plc at present offers its customers 30 days’ credit. Half the customers, by
value, pay on time. The other half take an average of 70 days to pay. The business is consider-
ing offering a cash discount of 2 per cent to its customers for payment within 30 days.
The credit controller anticipates that half of the customers who now take an average of
70 days to pay (that is, a quarter of all customers) will pay in 30 days. The other half (the final
quarter) will still take an average of 70 days to pay. The scheme will also reduce bad debts by
£300,000 a year.
Annual sales revenue of £365m is made evenly throughout the year. At present the business
has a large overdraft (£60m) with its bank at an interest cost of 12 per cent a year.
Required:
(a) Calculate the approximate equivalent annual percentage cost of a discount of 2 per cent,
which reduces the time taken by credit customers to pay from 70 days to 30 days. (Hint:
This part can be answered without reference to the narrative above.)
(b) Calculate the value of trade receivables outstanding under both the old and new schemes.
(c) How much will the scheme cost the business in discounts?
(d) Should the business go ahead with the scheme? State what other factors, if any, should be
taken into account.
(e) Outline the controls and procedures that a business should adopt to manage the level of its
trade receivables.
11.2
CHAPTER 11 MANAGING WORKING CAPITAL
446
M11_ATRI3622_06_SE_C11.QXD 5/29/09 3:32 PM Page 446
The managing director of Sparkrite Ltd, a trading business, has just received summary sets of
financial statements for last year and this year:
Sparkrite Ltd
Income statements for years ended 30 September last year and this year
Last year This year
£000 £000 £000 £000
Sales revenue 1,800 1,920
Cost of sales
Opening inventories 160 200
Purchases 1,120 1,175
1,280 1,375
Closing inventories (200) (250)
(1,080) (1,125)
Gross profit 720 795
Expenses (680) (750)
Profit for the year 40 45
Statements of financial position (balance sheets) as at
30 September last year and this year
Last year This year
£000 £000
Non-current assets 950 930
Current assets
Inventories 200 250
Trade receivables 375 480
Bank 4 2
579 732
Total assets 1,529 1,662
Equity
Fully paid £1 ordinary shares 825 883
Retained earnings 509 554
1,334 1,437
Current liabilities 195 225
Total equity and liabilities 1,529 1,662
The finance director has expressed concern at the increase in inventories and trade receiv-
ables levels.
Required:
(a) Show, by using the data given, how you would calculate ratios that could be used to mea-
sure inventories and trade receivables levels during last year and this year.
(b) Discuss the ways in which the management of Sparkrite Ltd could exercise control over:
1 inventories levels;
2 trade receivables levels.
Your superior, the general manager of Plastics Manufacturers Limited, has recently been talk-
ing to the chief buyer of Plastic Toys Limited, which manufactures a wide range of toys for
young children. At present, Plastic Toys is considering changing its supplier of plastic granules
and has offered to buy its entire requirement of 2,000 kg a month from you at the going market
rate, provided that you will grant it three months’ credit on its purchases. The following infor-
mation is available:
11.4
11.3
EXERCISES
447
M11_ATRI3622_06_SE_C11.QXD 5/29/09 3:32 PM Page 447
1 Plastic granules sell for £10 a kg, variable costs are £7 a kg, and fixed costs £2 a kg.
2 Your own business is financially strong, and has sales revenue of £15 million a year. For the
foreseeable future it will have surplus capacity, and it is actively looking for new outlets.
3 Extracts from Plastic Toys’ financial statements:
Year 1 Year 2 Year 3
£000 £000 £000
Sales revenue 800 980 640
Profit before interest and tax 100 110 (150 )
Capital employed 600 650 575
Year 1 Year 2 Year 3
Current assets £000 £000 £000
Inventories 200 220 320
Trade receivables 140 160 160
340 380 480
Current liabilities
Trade payables 180 190 220
Overdraft 100 150 310
280 340 530
Working capital 60 40 (50)
Required:
(a) Write some short notes suggesting sources of information that you would use to assess
the creditworthiness of potential customers who are unknown to you. You should critically
evaluate each source of information.
(b) Describe the accounting controls that you would use to monitor the level of your business’s
trade receivables.
(c) Advise your general manager on the acceptability of the proposal. You should give your rea-
sons and do any calculations you consider necessary. (Hint: To answer this question you
must weigh the costs of administration and cash discounts against the savings in bad debts
and interest charges.)
Mayo Computers Ltd has annual sales of £20m. Bad debts amount to £0.1m a year. All sales
made by the business are on credit and, at present, credit terms are negotiable by the customer.
On average, the settlement period for trade receivables is 60 days. Trade receivables are
financed by an overdraft bearing a 14 per cent rate of interest per year. The business is currently
reviewing its credit policies to see whether more efficient and profitable methods could be
employed. Only one proposal has so far been put forward concerning the management of trade
credit.
The credit control department has proposed that customers should be given a 2.5 per cent
discount if they pay within 30 days. For those who do not pay within this period, a maximum of
50 days’ credit should be given. The credit department believes that 60 per cent of customers
will take advantage of the discount by paying at the end of the discount period. The remainder
will pay at the end of 50 days. The credit department believes that bad debts can be effectively
eliminated by adopting the above policies and by employing stricter credit investigation pro-
cedures, which will cost an additional £20,000 a year. The credit department is confident that
these new policies will not result in any reduction in sales revenue.
Required:
Calculate the net annual cost (savings) to the business of abandoning its existing credit policies
and adopting the proposals of the credit control department. (Hint: To answer this question you
must weigh the costs of administration and cash discounts against the savings in bad debts and
interest charges.)
11.5
CHAPTER 11 MANAGING WORKING CAPITAL
448
M11_ATRI3622_06_SE_C11.QXD 5/29/09 3:32 PM Page 448
Boswell Enterprises Ltd is reviewing its trade credit policy. The business, which sells all of its
goods on credit, has estimated that sales revenue for the forthcoming year will be £3m under
the existing policy. Credit customers representing 30 per cent of trade receivables are expected
to pay one month after being invoiced and 70 per cent are expected to pay two months after
being invoiced. These estimates are in line with previous years’ figures.
At present, no cash discounts are offered to customers. However, to encourage prompt
payment, the business is considering giving a 2.5 per cent cash discount to credit customers
who pay in one month or less. Given this incentive, the business expects credit customers
accounting for 60 per cent of trade receivables to pay one month after being invoiced and
those accounting for 40 per cent of trade receivables to pay two months after being invoiced.
The business believes that the introduction of a cash discount policy will prove attractive to
some customers and will lead to a 5 per cent increase in total sales revenue.
Irrespective of the trade credit policy adopted, the gross profit margin of the business will be
20 per cent for the forthcoming year and three months’ inventories will be held. Fixed monthly
expenses of £15,000 and variable expenses (excluding discounts) equivalent to 10 per cent of
sales revenue will be incurred and will be paid one month in arrears. Trade payables will be paid
in arrears and will be equal to two months’ cost of sales. The business will hold a fixed cash bal-
ance of £140,000 throughout the year, whichever trade credit policy is adopted. Ignore taxation.
Required:
(a) Calculate the investment in working capital at the end of the forthcoming year under:
(i) the existing policy;
(ii) the proposed policy.
(b) Calculate the expected profit for the forthcoming year under:
(i) the existing policy;
(ii) the proposed policy.
(c) Advise the business as to whether it should implement the proposed policy.
(Hint: The investment in working capital will be made up of inventories, trade receivables
and cash, less trade payables and any unpaid expenses at the year end.)
Delphi plc has recently decided to enter the expanding market for minidisc players. The
business will manufacture the players and sell them to small TV and hi-fi specialists, medium-
sized music stores and large retail chain stores. The new product will be launched next February
and predicted sales revenue for the product from each customer group for February and the
expected rate of growth for subsequent months are as follows:
Customer type February Monthly compound Credit period
sales revenue sales revenue growth
£000 % months
TV and hi-fi specialists 20 4 1
Music stores 30 6 2
Retail chain stores 40 8 3
The business is concerned about the financing implications of launching the new product, as
it is already experiencing liquidity problems. In addition, it is concerned that the credit control
department will find it difficult to cope. This is a new market for the business and there are likely
to be many new customers who will have to be investigated for creditworthiness.
Workings should be in £000’s and calculations made to one decimal place only.
Required:
(a) Prepare an ageing schedule of the monthly trade receivables balance relating to the new
product for each of the first four months of the new product’s life, and comment on the
11.7
11.6
EXERCISES
449
M11_ATRI3622_06_SE_C11.QXD 5/29/09 3:32 PM Page 449
results. The schedule should analyse the trade receivables outstanding according to
customer type. It should also indicate, for each customer type, the relevant percentage
outstanding in relation to the total amount outstanding for each month.
(b) Identify and discuss the factors that should be taken into account when evaluating the
creditworthiness of the new business customers.
Goliath plc is a retail business operating in Ireland. The most recent financial statements of the
business are as follows:
Income statement for the year to 31 May
£000 £000
Sales revenue 2,400.0
Cost of sales
Opening inventories 550.0
Purchases 1,450.0
2,000.0
Closing inventories (560.0) (1,440.0)
Gross profit 960.0
Administration expenses (300.0)
Selling expenses (436.0)
Operating profit 224.0
Interest payable (40.0)
Profit before taxation 184.0
Taxation (25%) (46.0)
Profit for the period 138.0
Statement of financial position as at 31 May
£000 £000
Non-current assets
Property, plant and equipment
Machinery and equipment at cost 424.4
Accumulated depreciation (140.8 ) 283.6
Motor vehicles at cost 308.4
Accumulated depreciation (135.6 ) 172.8
456.4
Current assets
Inventories at cost 560.0
Trade receivables 565.0
Cash at bank 36.4
1,161.4
Total assets 1,617.8
Equity
£1 ordinary shares 200.0
Retained earnings 520.8
720.8
Non-current liabilities
Borrowings – Loan notes 400.0
Current liabilities
Trade payables 451.0
Taxation 46.0
497.0
Total equity and liabilities 1,617.8
All sales and purchases are made on credit.
11.8
CHAPTER 11 MANAGING WORKING CAPITAL
450
M11_ATRI3622_06_SE_C11.QXD 5/29/09 3:32 PM Page 450
The business is considering whether to grant extended credit facilities to its customers. It has
been estimated that increasing the settlement period for trade receivables by a further 20 days
will increase the turnover of the business by 10 per cent. However, inventories will have to be
increased by 15 per cent to cope with the increased demand. It is estimated that purchases will
have to rise to £1,668,000 during the next year as a result of these changes. To finance the
increase in inventories and trade receivables, the business will increase the settlement period
taken for suppliers by 15 days and use a loan facility bearing a 10 per cent rate of interest for
the remaining balance.
If the policy is implemented, bad debts are likely to increase by £120,000 a year and admin-
istration costs will rise by 15 per cent.
Required:
(a) Calculate the increase or decrease to each of the following that will occur in the forthcom-
ing year if the proposed policy is implemented:
(1) operating cash cycle (based on year-end figures)
(2) net investment in inventories, trade receivables and trade payables
(3) net profit after taxation.
(b) Should the business implement the proposed policy? Give reasons for your conclusion.
EXERCISES
451
M11_ATRI3622_06_SE_C11.QXD 5/29/09 3:32 PM Page 451
ABC system of inventories control A method of applying different levels of invent-
ories control, based on the value of each category of inventory. p. 418
Absorption costing A method of costing in which a ‘fair share’ of the total manu-
facturing/service provision overhead cost is included when calculating the cost of a
particular product or service. p. 98
Accounting rate of return (ARR) The average profit from an investment, expressed as
a percentage of the average investment made. p. 261
Activity-based budgeting (ABB) A system of budgeting based on the philosophy of
activity-based costing (ABC). p. 201
Activity-based costing (ABC) A technique for more accurately relating overheads to
specific production or provision of a service. It is based on acceptance of the fact that
overheads do not just occur but are caused by activities, such as holding products in
stores, which ‘drive’ the costs. p. 138
Adverse variance A difference between planned and actual performance, where the
difference will cause the actual profit to be lower than the budgeted one. p. 223
Ageing schedule of trade receivables A report analysing receivables into categories,
according to the length of time outstanding. p. 429
Average settlement period for trade payables The average time taken for a business
to pay its trade payables (creditors). p. 441
Average settlement period for trade receivables The average time taken for trade
receivables (debtors) to pay the amounts owing to a business. p. 429
Balanced scorecard A framework for translating the aims and objectives of a busi-
ness into a series of key performance measures and targets. p. 334
Batch costing A technique for identifying full cost, where the production of many
types of goods and services, particularly goods, involves producing a batch of identi-
cal or nearly identical units of output, but where each batch is distinctly different
from other batches. p. 119
Behavioural aspects of budgetary control The effect on people’s attitudes and
behaviour of the various aspects of using budgets as the basis of exercising control
over performance. p. 242
Benchmarking Identifying a successful business, or part of a business, and measuring
the effectiveness of one’s own business by comparison with this standard. p. 153
Appendix A
Glossary of key terms
Z01_ATRI3622_06_SE_APP1.QXD 5/29/09 10:42 AM Page 452
Break-even analysis Deducing the break-even point of some activity by analysing
the relationship between cost, volume and revenue. p. 60
Break-even chart A graphical representation of the cost and sales revenue of some
activity, at various levels, which enables the break-even point to be identified. p. 61
Break-even point (BEP) A level of activity where revenue will exactly equal total cost,
so there is neither profit nor loss. p. 61
Budget A financial plan for the short term, typically one year. p. 176
Budget committee A group of managers formed to supervise and take responsibility
for the budget-setting process. p. 186
Budget holder An individual responsible for a particular budget. p. 192
Budget officer An individual, often an accountant, appointed to carry out, or take
immediate responsibility for having carried out, the tasks of the budget committee.
p. 186
Budgetary control Using the budget as a yardstick against which the effectiveness of
actual performance may be assessed. p. 239
Cash discount A reduction in the amount due for goods or services sold on credit in
return for prompt payment. p. 428
Committed cost A cost incurred that has not yet been paid, but which must, under
some existing contract or obligation, be paid. p. 44
Common cost Cost that relates to more than one business segment. p. 96
Comparability The requirement that items which are basically the same should be
treated in the same manner for measurement and reporting purposes. Lack of com-
parability will limit the usefulness of accounting information. p. 18
Compensating variances The situation that exists when two variances, both caused
by the same factor, one adverse and the other favourable, are of equal size, and there-
fore cancel each other out. p. 238
Competitor analysis An examination of information relating to competitors to find
out what strategies and plans they have developed, how they may react to the plans
that the business has developed, and whether they have the capability to pose a seri-
ous threat. p. 319
Continual (or rolling) budget A budgeting system that continually updates budgets so
that there is always a budget for a full planning period. p. 180
Contribution margin ratio The contribution from an activity expressed as a percent-
age of the sales revenue. p. 67
Contribution per unit Sales revenue per unit less variable cost per unit. p. 66
Control Compelling events to conform to plan. p. 177
Controllable cost A cost that is the responsibility of a specific manager. p. 374
Cost The amount of resources, usually measured in monetary terms, sacrificed to
achieve a particular objective. p. 38
Cost allocation Assigning cost to cost centres according to the amount of cost that
has been incurred in each centre. p. 112
GLOSSARY OF KEY TERMS
453
Z01_ATRI3622_06_SE_APP1.QXD 5/29/09 10:42 AM Page 453
Cost apportionment Dividing cost between cost centres on a basis that is considered
to reflect fairly the cost incurred in each centre. p. 112
Cost behaviour The manner in which cost alters with changes in the level of activ-
ity. p. 99
Cost centre Some area, object, person or activity for which elements of cost are
separately collected. p. 110
Cost driver An activity that causes cost. p. 138
Cost of capital The cost to a business of the finance needed to fund an investment.
p. 277
Cost-plus pricing An approach to pricing output that is based on full cost plus a
percentage profit loading. p. 121
Cost pool The sum of the overhead cost associated with a particular support activity.
p. 138
Cost unit The objective for which the cost is being deduced, usually a product or
service. p. 96
Customer profitability analysis (CPA) An assessment of the profitability to the busi-
ness of individual customers, or types of customer. p. 323
Direct cost A cost that can be identified with specific cost units, to the extent that
the effect of the cost can be measured in respect of each particular unit of output.
p. 96
Direct labour efficiency variance The difference between the actual direct labour
hours worked and the number of direct labour hours according to the flexed budget
(budgeted direct labour hours for the actual output). This figure is multiplied by the
budgeted direct labour rate for one hour. p. 227
Direct labour rate variance The difference between the actual cost of the direct
labour hours worked and the direct labour cost allowed (actual direct labour hours
worked at the budgeted labour rate). p. 227
Direct materials price variance The difference between the actual cost of the direct
material used and the direct materials cost allowed (actual quantity of material used
at the budgeted direct material cost). p. 226
Direct materials usage variance The difference between the actual quantity of direct
materials used and the quantity of direct materials according to the flexed budget
(budgeted usage for actual output). This quantity is multiplied by the budgeted direct
materials cost for one unit of the direct materials. p. 225
Discount factor The rate applied to future cash flows to derive the present value of
those cash flows. p. 276
Discretionary budget A budget based on a sum allocated at the discretion of top man-
agement. p. 192
Divisions Business segments, often organised along geographical and/or product
lines, through which large businesses are managed. p. 367
Economic order quantity (EOQ) The quantity of inventories that should be purchased
in order to minimise total inventories ordering and carrying costs. p. 419
APPENDIX A GLOSSARY OF KEY TERMS
454
Z01_ATRI3622_06_SE_APP1.QXD 5/29/09 10:42 AM Page 454
Economic value added (EVA
®
) A measure of economic, as opposed to accounting,
profit. It is said to be more useful than accounting profit as a measure of business per-
formance because it takes full account of the cost of financing the business. p. 350
Economies of scale Cost savings per unit that result from undertaking a large vol-
ume of activities; they are due to factors such as division and specialisation of labour,
and discounts from bulk buying. p. 73
Elasticity of demand The extent to which the level of demand alters with changes in
price. p. 155
Expected net present value (ENPV) A weighted average of the possible present value
outcomes, where the probabilities associated with each outcome are used as weights.
p. 296
Favourable variance A difference between planned and actual performance where
the difference will cause the actual profit to be higher than the budgeted one. p. 223
Feedback control A control device where actual performance is compared with
planned performance, and where action is taken to deal with possible future diver-
gences between them. p. 219
Feedforward control A control device where forecast future performance is compared
with planned performance, and where action is taken to deal with divergences
between them. p. 219
Financial accounting The measuring and reporting of accounting information for
external users (those users other than the managers of the business). p. 29
Five Cs of credit A checklist of factors to be taken into account when assessing the
creditworthiness of a customer. p. 424
Fixed cost A cost that stays the same when changes occur to the volume of activity.
p. 56
Fixed overhead spending variance The difference between the actual fixed overhead
cost and the fixed overhead cost, according to the flexed (and the original) budget.
p. 228
Flexible budget A budget that is adjusted to reflect the actual level of output
achieved. p. 222
Flexing the budget Revising the budget to what it would have been had the planned
level of output been different. p. 221
Forecast A prediction of future outcomes or of the future state of the environment.
p. 179
Free cash flows The cash flows generated by the business that are available to the
shareholders and long-term lenders. This is the net cash flow from operating activ-
ities, less tax and funds laid out on additional non-current assets. p. 344
Full cost The total amount of resources, usually measured in monetary terms,
sacrificed to achieve a particular objective. pp. 94, 391
Full cost (cost-plus) pricing Pricing output on the basis of its full cost, normally with
a loading for profit. pp. 121, 163
Full costing Deducing the total direct and indirect (overhead) costs of pursuing some
activity or objective. p. 95
GLOSSARY OF KEY TERMS
455
Z01_ATRI3622_06_SE_APP1.QXD 5/29/09 10:42 AM Page 455
Historic cost What an asset cost when it was originally acquired. p. 38
Ideal standards Standards that assume perfect operating conditions where there is no
inefficiency due to lost production time, defects, and so on. The objective of setting
ideal standards is to encourage employees to strive towards excellence. p. 245
Incremental budgeting Constructing budgets on the basis of what happened in the
previous period, with some adjustment for expected changes in the forthcoming
budget period. p. 192
Indirect cost (or overheads) All cost except direct cost: that is, those which cannot
be directly measured in respect of each particular unit of output. p. 96
Inflation An increase in the general price of goods and services resulting in a corres-
ponding decline in the purchasing power of the currency. p. 272
Internal rate of return (IRR) The discount rate for a project that will have the effect of
producing a zero NPV. p. 279
Investment centre Some area or activity whose manager or activity is responsible and
accountable for the profit generated and capital invested. p. 367
Irrelevant cost A cost that is not relevant to a particular decision. p. 39
Job costing A technique for identifying the full cost per unit of output, where that
output is not similar to other units of output. p. 98
Just-in-time (JIT) inventories management A system of inventories management
that aims to have supplies delivered to production just in time for their required use.
p. 422
Kaizen costing An approach to cost control where an attempt is made to control cost
by trying continually to make cost savings, often only small ones, from one time
period to the next. p. 153
Key performance indicators (KPIs) Financial and/or non-financial measures that
reflect the critical success factors of a business. p. 24
Lead time The time lag between placing an order for goods or services and their
delivery. p. 417
Lean manufacturing An approach to manufacturing that involves a systematic
attempt to identify and eliminate waste in the production process, which may arise
from storing excess materials, excess production, delays, defects, and so on. p. 329
Learning curve The tendency for people to carry out tasks more quickly as they
become more experienced in doing them. p. 246
Limiting factor Some aspect of the business (for example, lack of sales demand) that
will prevent it achieving its objectives to the maximum extent. p. 179
Management accounting The measuring and reporting of accounting information
for the managers of a business. p. 15
Management accounting information system The system used within a business to
identify, record, analyse and report accounting information. p. 21
Management by exception A system of control, based on a comparison of planned
and actual performance, that allows managers to focus on areas of poor performance
rather than dealing with areas where performance is satisfactory. p. 184
APPENDIX A GLOSSARY OF KEY TERMS
456
Z01_ATRI3622_06_SE_APP1.QXD 5/29/09 10:42 AM Page 456