Option Strategies Profit Making Techniques for Stock Index and Commodity Options 2nd Edition_2 docx
Bạn đang xem bản rút gọn của tài liệu. Xem và tải ngay bản đầy đủ của tài liệu tại đây (333.78 KB, 23 trang )
c02 JWBK147-Smith April 25, 2008 7:48 Char Count=
The Fundamentals of Options 11
The name of the UI is usually shortened to something manageable; for ex-
ample, the S&P 100 Index is usually shortened to “S&P 100” or often to its
ticker symbol “OEX.”
Throughout this book, the UI is referred to as a generic something,
which could be:
1. A stock, like 100 shares of Citibank stock. (Note that options on stocks
are always for 100 shares of the underlying stock. Options on futures
are for the same quantity as the underlying futures contract.)
2. Something tangible, like 100 ounces of gold.
3. Something conceptual, like a stock index. (Conceptual underlying in-
struments call for the delivery of the cash value of the underlying
instrument; for example, the popular S&P 100 option calls for the de-
livery of the cash value of the index.)
The Strike Price
An option traded on an exchange is standardized in every element ex-
cept the price, which is negotiated between buyers and sellers. On the
other hand, all aspects of over-the-counter (OTC) options are negotiable.
(The examples in this book assume exchange-traded options, but the
analysis also applies to OTC options.) This standardization increases
the liquidity of trading and makes possible the current huge volume in
options.
It is easier to buy or sell an option when you only negotiate price rather
than every detail in the contract, as in options on real estate—those nego-
tiations can take weeks or months. Exchange-traded option transactions,
on the other hand, can be consummated in seconds.
The introduction of FLEX options blurred the line between exchange-
traded and OTC options. FLEX options are options that are traded on an
exchange, but more than the price is negotiable—virtually all of the ele-
ments can be negotiated. So far, the popularity of FLEX options has been
limited.
The predetermined price upon which the buyer and the seller of an
option have agreed is the strike price, also called the exercise price or
striking price. “OEX 250” means the strike price is $250. If you bought an
OEX 250 call, you would have the right to buy the cash equivalent of the
OEX index at $250 at any time during the life of the option. If you bought a
gold 400 put, you would have the right to sell gold at $400 an ounce at any
time during the life of the option.
Each option on a UI will have multiple strike prices. For example, the
OEX option might have strike prices for puts and calls of 170, 175, 180, 185,
c02 JWBK147-Smith April 25, 2008 7:48 Char Count=
12 WHY AND HOW OPTION PRICES MOVE
190, 195, 200, and 205. In general, the current price of the UI will be near
the middle of the range of the strike prices.
In general, the higher the UI price, the wider the range of the strike
price. For example, a stock selling for less than $25 per share has strike
prices 2.50 dollars or points apart, whereas a stock selling for greater than
$200 has 10 dollars or points between each strike price.
The exchanges add strike prices as the price of the instrument changes.
For example, if March Treasury-bond futures are listed at 80-00, the
Chicago Board of Trade (CBOT), the exchange where bond futures options
are traded, might begin trading with strike prices ranging from 76-00 to
84-00. If bond futures trade up to 82-00, the exchange might add a 86-00
strike price. The more volatile the UI, the more strike prices there tend
to be.
The Expiration Day
Options have finite lives. The expiration day of the option is the last day
that the option owner can exercise the option.
This distinction is necessary to differentiate between American and
European options. American options can be exercised any time before the
expiration date at the owner’s discretion. Thus, the expiration and exercise
days can be different. European options can only be exercised on the ex-
piration day. If exercised, the exercise and expiration days are the same.
Unless otherwise noted, this book will discuss only American options.
Most options traded on American exchanges are American exercise.
Please also note that there are rules on most exchanges where options
are automatically exercised if they are in-the-money by a certain amount.
(We’ll explain in-the-money later.)
Expiration dates are in regular cycles and are determined by the
exchanges. For example, a common stock expiration cycle is January/
April/July/October. This means that options will be traded that expire in
those months. Thus, a May XYZ 125 call will expire in May if no previous
action is taken by the holder. The exchanges add new options as old ones
expire.
The Chicago Board Options Exchange (CBOE) will list a July 2008 se-
ries of options when the October 2008 series expires. The exchanges limit
the number of expiration dates usually to the nearest three. For example,
stock options are only allowed to be issued for a maximum of nine months.
Thus, only three expiration series will exist at a single time. Because of
this, the option closest to expiration will be called the near-term or short-
term option; the second option to expire will be called the medium-term
or middle-term option; and the third option will be called the far-term or
long-term option.
c02 JWBK147-Smith April 25, 2008 7:48 Char Count=
The Fundamentals of Options 13
TABLE 2.1 Expiration Cycles
Option Cycle
Stock indexes Monthly, using nearest three to four months
Stocks January/April/July/October
February/May/August/November
March/June/September/December
Monthly, using nearest three months
Futures options Corresponding to the delivery cycle of underlying futures
contract.
Spot currencies March/June/September/December, but monthly for nearest
three months
Cash bonds March/June/September/December
Table 2.1 shows the expiration cycles for some of the major types of
options. Note that typically only the three nearest options will be trading
at any time.
However, there has been a movement toward options on futures that
expire every month. These are called serial options. They typically exist
only for the first several months. They are most common in the currency
futures.
The UI of a serial option is the futures contract that expires the same
month as the option or the first futures contract that expires subsequent
to the option’s expiration. For example, the November option in currency
futures will be exercised for the December futures contract because that is
the next futures contract that exists.
The currencies trade in a March/June/September/December cycle. This
means that the September option will be exercised into a September fu-
tures contract. The October, November, and December options turn into
December futures contracts.
In-the-Money, Out-of-the-Money,
and At-the-Money
Other terms to qualify options are in-the-money, out-of-the-money, and at-
the-money. They describe the relationship between option prices and the
UI price.
1. In-the-money
r
Call option: UI price is higher than the strike price.
r
Put option: UI price is lower than the strike price.
c02 JWBK147-Smith April 25, 2008 7:48 Char Count=
14 WHY AND HOW OPTION PRICES MOVE
2. Out-of-the-money
r
Call option: UI price is lower than the strike price.
r
Put option: UI price is higher than the strike price.
3. At-the-money: UI price is equivalent to the strike price. (Most people
use at-the-money to also describe the strike price that is closest to the
price of the underlying instrument.)
LIQUIDATING AN OPTION
An option can be liquidated in three ways: a closing buy or sell, abandon-
ment, and exercising. Buying and selling, as discussed earlier, are the most
common methods of liquidation. Abandonment and exercise are discussed
here.
Exercising Options
An option gives the right to buy or sell a UI at a set price. Call option owners
can exercise their right to buy the UI, and put option owners can exercise
their right to sell the UI. The call option owner is calling away the UI when
exercising the option. For example, owners of October AT&T 50 calls can,
at any time, exercise their right to buy 100 shares of AT&T at $50 per share.
The seller of the option is assigned an obligation to sell 100 shares of AT&T
at $50. After exercising a call, the buyer will own 100 shares of AT&T at $50
each, and the seller will have delivered 100 shares of AT&T and received
$50 each for them.
Only holders of options can exercise. They may do so from any time
after purchase of the option through to a specified time on the last trading
day if it is an American option. For example, stock options can be exer-
cised up until 8:00
P.M. (EST) on the last day of trading. Option owners ex-
ercise by notifying the exchange, usually through their broker. The writer
of the option is then assigned the obligation to fulfill the obligations of the
options.
Option buyers and sellers should constantly check with their broker or
with the exchange on the latest rules concerning exercise and assignment
if they are going to be holding options until expiration or if they intend to
exercise and/or expect to be assigned.
Clearinghouses handle the exercising of options and act as the focal
point for the process. If you want to exercise an option, you typically tell
your brokerage house, which then notifies the clearinghouse. The clear-
inghouse assigns the obligation to a brokerage house that has a client
that is short that particular option. That brokerage house then assigns the
c02 JWBK147-Smith April 25, 2008 7:48 Char Count=
The Fundamentals of Options 15
obligation to a client that is short that particular option. If more than one
client is short, the obligation is assigned by the method that the brokerage
house uses, usually randomly or first-in/first-out. However, another method
can be used if it is approved by the relevant exchange. It is, therefore, im-
portant for option writers to know their brokerage house rules on option
assignment.
Once assigned, call option writers must deliver the UI or the equivalent
in cash, if the contract specifications call for cash delivery. They may not
buy back the option. They may honor the assignment of a call option by
delivering the UI from their portfolio, by buying it in the market and then
delivering it, or by going short. The assignment of a put option may be
honored by delivering a short instrument from their portfolio, by selling
short in the market and then delivering it, or by going long.
If you exercise an option, you will be holding a new position. You will
then be liable for the cost and margin rules of the new position. (Margin,in
this context, is the amount of money you are allowed to borrow using your
new position as collateral.) For example, if you exercise a long stock call
and want to keep the shares, you will either have to pay the full value of
the stock or margin it according to the rules of the Federal Reserve Board.
Alternately, you could sell it right away and not post any money if done
through a margin account. If you had tried to sell it through a cash account,
you would have had to post the full value of the stock before you could sell.
In general, exercising an option is considered the equivalent of buying or
selling the UI for margin and costing considerations.
When an option is exercised, the brokerage house charges a commis-
sion for executing an order on the UI for both the long and the short of
the option. For example, if you exercise a call option on American Widget
stock, you will have to pay the commission to buy 100 shares of American
Widget. This makes sense because, when you exercise an option, you are
trading in the UI.
The true cost of exercise includes the transaction costs and the time
premium, if any, remaining on the option. (Time premium is defined in the
next chapter.) The costs make it expensive for most people to exercise op-
tions, so it is generally done only by exchange members prior to expiration.
You will not want to exercise an option unless it is bid at less than its
intrinsic value. (Intrinsic value is discussed in the next chapter.) This will
occur only if the option is very deep in-the-money or very near expiration.
An option can be abandoned if the premium left is less than the transaction
costs of liquidating it.
Options that are in-the-money are almost certain to be exercised at ex-
piration. The only exceptions are those options that are less in-the-money
than the transaction costs to exercise them at expiration. For example,
c02 JWBK147-Smith April 25, 2008 7:48 Char Count=
16 WHY AND HOW OPTION PRICES MOVE
a soybean option that is only 0.25 cent in-the-money (worth $12.50) will
not be exercised by most investors because the transaction costs will be
greater than the $12.50 received by exercising. In all other cases, in-the-
money options should be exercised. Otherwise, you will lose the premium
and gain nothing. Most option exercises occur within a few days of expira-
tion because the time premium has dropped to a negligible or nonexistent
level. Most exchanges have automatic exercise of options that are in-the-
money by a specified amount.
Prior to expiration, any option trading for less than the intrinsic value
could also be exercised. This premature exercise can also occur if the price
is far enough below the carrying costs relative to the UI. This discount is
extremely rare because arbitrageurs keep values in line. Even if it occurred,
it is likely that only exchange members could capitalize on it because of
their lower transaction costs.
A discount might occur when the UI is about to pay a dividend or inter-
est payment. Following the payment, the price of the UI will typically drop
the equivalent of the dividend or interest payment. The option might have
enough sellers before the dividend or interest payment to create the dis-
count. There are typically a large number of sellers just before a dividend
or interest payment because holders of calls do not receive the dividend or
interest and, therefore, do not want to hold the option through the period
when the payment causes the option price to dip.
In the final analysis, there are few exercises before the final few days
of trading because it is not economically rational to exercise if there is any
time premium remaining on the option.
CHANGES IN OPTION SPECIFICATIONS
The terms of an option contract can change after being listed and traded.
This is very infrequent and happens only in stock options when the stock
splits or pays a stock dividend. The result is a change in the strike prices
and the number of shares that are deliverable.
A stock split will increase the number of options contracts outstanding
and reduce the strike price. For example, suppose that Exxon declares a
two-for-one split. You will be credited with having twice as many contracts,
but the strike price will be halved. If you owned 20 Exxon 45 calls before
the split, you will have 40 Exxon 22
1
/
2
calls following the split. Note that
the new strike prices can be fractional.
A stock dividend has the same effect on the number of options and
the strike price. For example, Merrill Lynch declares a 5 percent stock
c02 JWBK147-Smith April 25, 2008 7:48 Char Count=
The Fundamentals of Options 17
dividend. The exchange will adjust the number of shares in a contract up
to 105 from 100 and reduce the strike price by 5 percent. An old call with a
strike price of 50 will now be listed as the 47
1
/
2
call.
Exchanges will list new strikes at round numbers following the split or
stock dividend. The fractional strikes disappear as time passes.
THE OPTION CHART
The option chart is a key diagram that will show up throughout the book.
It shows the profit or loss of an option strategy at various prices of the UI
at expiration. Figure 2.1 shows an option chart of a long call option. The
scale on the left shows the profit or loss of the option. The bottom scale
shows the price of the underlying instrument at expiration.
The chart illustrates the key fact that the price of an option generally
rises and falls when the price of the UI rises and falls. Thus, a call option
buyer is bullish (expecting prices to rise), and the seller is bearish (ex-
pecting prices to fall or stay stable). A put option buyer is bearish, and the
seller is bullish. For example, if the price of Widget International was $30
and you were holding a July Widget 40 put, you could exercise the option
and make $10 per share. If the stock dropped to $25, you would make $15
by exercising. By exercising the put, you have taken stock you can buy for
$25 in the open market and put it to someone else for the strike price of
$40. Your purchase price is $25, your sale price is $40, and your profit is
therefore $15.
Option charts usually do not consider the effects of carrying charges.
They exist to give a quick overview of the effect of changes in price, time,
and volatility on the price of an option. The most common charts show the
70
60
50
40
30
20
Profit
10
–10
0
25 30 35 40 45 50 55 60 65
Price of Underlying Instrument at Expiration
70 75 80 85 90 95 100105 110115 120
FIGURE 2.1 Option Chart
c02 JWBK147-Smith April 25, 2008 7:48 Char Count=
18 WHY AND HOW OPTION PRICES MOVE
profit or loss of the strategy at expiration only. However, some charts will
show the profit or loss characteristics of a strategy before expiration.
At expiration, the profit-and-loss line of an option will bend at the exer-
cise price and cross the zero-profit line at the point that equals the exercise
price plus the premium, for a call, or that equals the exercise price minus
the premium, for a put.
PRICE QUOTES
Price quotes are essentially like the quotes of the UI. The following shows
typical option price quotes found in a newspaper:
Chicago Board—Index Options
Week’s
Expire date Open Net N.Y.
Strike price Sales Int. High Low Price Chg. Close
SP100 Apr 530 p 2434 7721 .25 .125 .125 −.0625 633.55
SP100 Apr 565 p 1724 5449 .875 .25 .3125 −.8125 633.55
SP100 Apr 570 p 2232 10406 1.0625 .375 .4375 −.8125 633.55
The rows are for the prices of the various strike prices; the columns
are for calls and puts and the various expirations. With few exceptions,
the units of price are the same as the UI. For example, because each op-
tion is for 100 shares, a price of 4.375 for an option on a stock means
the total price for the option is 100 times the cost-per-share of the option,
or $437.50.
Quotations for options on Treasury-bond and Treasury-note futures
are quoted in 64ths, whereas the underlying futures are quoted in 32nds.
Many people make trading mistakes when trading these options due to this
difference.
Price quotes on quotation services will be priced the same, but each
quotation service has a different code for each option. Consult with your
quotation service for the quote symbol of the option in which you are
interested.
Options quotes are available on the previous day’s close in the Wall
Street Journal, Investor’s Business Daily, and almost all big-city dailies.
Quotes are available on all the major quotations services. They are also
available on the Internet or you can call your broker for quotes.
c02 JWBK147-Smith April 25, 2008 7:48 Char Count=
The Fundamentals of Options 19
COMMISSIONS
Options commissions are calculated differently at each brokerage house.
There are, however, two main styles of calculation.
The first and simplest method is the flat rate in which the broker makes
a single charge for each option. For example, a broker could charge $100
for executing a gold option trade.
The other common method is to charge a percentage of the value
of the premium. For example, the broker could charge 5 percent of the
premium. If you bought a stock option for $20, the premium would be
$20 times 100 shares, or $2,000, and the broker’s commission would be
5 percent of $2,000, or $100.
Some brokers will combine the two styles. For example, the commis-
sion could be 5 percent of the premium, with a minimum of $30 and a max-
imum of $100.
The advent of online brokers has reduced commissions to dimes per
options on most instruments. It is important to keep commission costs to a
minimum no matter what strategy your broker uses. A reduction in trading
costs can have a big impact on your bottom line at the end of the year.
The increase in return in percentage terms is particularly important for
hedged options strategies, like covered writes, because they have two or
more commissions for each trade.
I use a strategy that theoretically should consistently make me
65 percent per year but transaction costs reduce that to about 45 percent
per year.
However, the cheapest commissions might be a false economy. Be sure
to look at the total package from the brokerage house. You might pay fewer
commissions but receive no support or perhaps poor order execution. The
cheapest brokerage house could turn out to be the most expensive!
ORDERS
Option orders are the same as orders for stock indexes, stocks, or futures.
In general, the accepted orders for options are the same as those accepted
for the UI. Special considerations about orders will be mentioned when
necessary in the rest of the book.
c02 JWBK147-Smith April 25, 2008 7:48 Char Count=
c03 JWBK147-Smith April 25, 2008 8:33 Char Count=
CHAPTER 3
The Basics of
Option Price
Movements
I
n the final analysis, options prices are set by the negotiations between
buyers and sellers. Prices of options are influenced mainly by the expec-
tations of future prices of the buyers and sellers and the relationship of
the option’s price with the price of the instrument. It is important to note
that options prices are nonlinear: They do not change (go up and down)
in exact correlation with the price of the underlying instrument (UI). This
chapter and the two chapters following will explain the complexities of
what moves options prices.
This chapter outlines, from a nontechnical and intuitive basis, the main
factors that move options prices. The terms that option strategists use to
describe some of these main determinants are often called the “greeks”
because some of them are the names for Greek letters. The more advanced
concepts will be left to Chapters 4 and 5, which introduce some math and
the more technical aspects of the greeks, as well as showing how to use
the greeks to identify the characteristics of an option strategy.
This may get a little dense but it is worth it for your bottom line.
THE COMPONENTS OF THE PRICE
An option’s price, or premium, has two components: intrinsic value and
time, or extrinsic value.
1. The intrinsic value of an option is a function of its price and the
strike price. The intrinsic value equals the in-the-money amount
of the options. For example, a United Widget 160 call will have an
21
c03 JWBK147-Smith April 25, 2008 8:33 Char Count=
22 WHY AND HOW OPTION PRICES MOVE
intrinsic value of 15 if the price of the UI is 175. This is simply the
difference between the strike price and the current price of the stock.
The intrinsic value of an at- or out-of-the-money option is zero. Thus,
an out-of-the-money option is an option with only time value.
2. The time value of an option is the amount that the premium exceeds
the intrinsic value.
Time value = Option premium − intrinsic value
Time value effectively reflects t he amount of risk of the option attain-
ing in-the-money status.
Alternately, the time value for in-the-money calls and puts is:
Call time value = Option premium + strike price − price of UI
Put time value = Option premium − strike price + price of UI
Parity
An option trading for its intrinsic value is trading at parity. Only in-the-
money options can trade at parity. This usually occurs very close to expi-
ration when the time value can easily be zero. It also typically occurs when
the option is very deep in-the-money. For example, an option with a strike
price of 50 will be considered very deep in-the-money if the UI is trading at
70 and there is only one day left until expiration.
Time Value
There are two ways to look at time value: (1) time value is greatest on
options with the greatest time until expiration; (2) time value tends to be
at its greatest when the UI is near the strike price for all those options that
expire at the same time (this phenomenon is explored later in this chapter
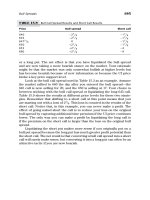
and in detail in Chapter 5). Table 3.1 shows an example of how time value
TABLE 3.1 Relationship of Time Value to Strike Price
Strike price May call price Intrinsic value Time value
165 19 17
3
/
4
1
1
/
4
170 15 12
3
/
4
2
1
/
4
175 11 7
3
/
4
3
1
/
4
180 7
7
/
8
2
3
/
4
5
5
/
8
185 4
7
/
8
04
7
/
8
190 3
1
/
8
03
1
/
8
195 2 0 2
c03 JWBK147-Smith April 25, 2008 8:33 Char Count=
The Basics of Option Price Movements 23
is higher the closer its strike price is to the current market price of the UI:
Widget Equipment is priced at 182
3
/
4
.
THE FACTORS THAT INFLUENCE
OPTIONS PRICES
Six key factors influence options prices. They are:
1. Price of the underlying instrument
2. Strike price
3. Time remaining until expiration
4. The risk-free rate
5. Expected volatility
6. Dividend or interest payments, if any
Fair Value
An option has a fair value. The fair value is the price at which the op-
tion should trade, given the six listed factors. The concept of fair value has
far-reaching implications. A common use of fair value is to calculate the
expected price of an option when given various combinations of these six
factors. For example, you might be considering buying an option, and you
calculate its fair value from these factors: (1) UI climbs $5, (2) there are 10
days left to expiration, (3) the expected volatility declines from 15 percent
to 10 percent, and (4) there is a dividend payment.
Another person might use different assumptions and have a different
fair value. Calculations of this type are important for deciding if the price
of the option is a good deal. You can compare your assumptions with those
of the market to determine strategies.
The difference between your estimate of the fair value of an option
and its current market price is sometimes called the theoretical edge (this
concept is discussed in detail in Chapter 4 and is used extensively in de-
scribing option strategies).
Price of the Underlying Instrument
The price of the UI is the most important influence on an option price.
In combination with the strike price, it determines if the option is in-the-
money or out-of-the-money.
c03 JWBK147-Smith April 25, 2008 8:33 Char Count=
24 WHY AND HOW OPTION PRICES MOVE
The delta (), or hedge ratio, measures the relationship of changes in
the prices of the option and the UI. The relationship between the option
and the UI changes as the factors outlined here change, but the delta
measures only the sensitivity of the option price to changes in the price of
the UI. The delta is calculated using option evaluation formulas.
A delta of 0.50 means that the price of the option will move half as
much as the price of the UI. For example, if the price of the UI moves $5.00,
the option price will move $2.50. The delta can range between 0.00 and
1.00. The delta is the percent change of a single point move in the option
when the UI moves one point.
The delta changes as the price of the UI changes. A deep in-the-money
option will have a delta approaching 1.00, while a deep out-of-the-money
will have a delta approaching 0.00. Figure 3.1 shows an option value chart.
It shows the price of the option at various prices of the UI and breaks the
option price into intrinsic value (the shaded area) and time value. The delta
is the slope of a line tangent to the price curve. As the price moves up the
curve, the slope increases, hence the delta increases. This also means that
the delta changes with every change in price of the UI.
However, the delta represents the relationship of the option price and
the UI price for only an instant. It is only a snapshot Everything is dynamic.
As soon as the price of the UI or the option moves, the delta changes.
A delta of 0.50 suggests that the price of the option will move half as
much as the price of the UI. However, if the price of the UI moves higher,
the delta of a call option will increase and the price of the option will move
more than half as much. For example, presume a delta of 0.50. If the price
of the UI increases $10, the option might actually increase by $6; the option
might decrease by only $4 if the UI drops $10.
The gamma (γ ) is the amount that the delta moves with changes in
the price of the UI. Put another way, it is the rate of change of the delta for
each one-point move in the UI. It is expressed as points of delta for every
point change in the UI.
time value
intrinsic
value
Price of Underlying Instrument
Price of Option
option value
FIGURE 3.1 Option Value Chart
c03 JWBK147-Smith April 25, 2008 8:33 Char Count=
The Basics of Option Price Movements 25
For example, if an option has a delta of 0.50 and a gamma of 0.05, then
the delta will be 0.55 if the price of the UI rises one point, and 0.45 if the
price falls one point.
The delta is important for both traders and hedgers. Traders can use
the delta to help identify the options with the most responsiveness to the
UI. Hedgers need to know the delta to have the proper number of contracts
to hedge their particular instrument.
Strike Price
The strike price has a major impact on the option price because it deter-
mines whether the option is in-the-money or out-of-the-money. Figure 3.2
is a call option value chart showing only the intrinsic value of an option.
Note that there is no intrinsic value until the UI’s price is above the strike
price (50).
Figure 3.3 is an option value chart that shows the price of the option,
including the intrinsic value (the shaded area) and the time value. It shows
that the time value is greatest when the UI’s price is at the strike price. This
illustrates the same principle as Table 3.1. In addition, Figure 3.3 and Table
3.1 illustrate that the time value is lower as the price of the UI moves away
from the strike price.
This is important because it illustrates what happens to the option’s
price as the UI’s price changes. For example, say you bought a 65 call when
the price was 50. As the price of the UI climbs, the option price climbs;
but the components of the price change when the UI’s price surmounts
the strike price. The components of the option price change from all time
value to increasing intrinsic value. Notice also how the profits accelerate
as prices approach and pass the strike price.
Price of Underlying Instrument
30 40 50 60
Price of Option
intrinsic value
FIGURE 3.2 Call Option Value Chart
c03 JWBK147-Smith April 25, 2008 8:33 Char Count=
26 WHY AND HOW OPTION PRICES MOVE
time value
intrinsic
value
Price of Underlying Instrument
Price of Option
option value
FIGURE 3.3 Option Value Chart
Time Remaining until Expiration
Options are called a wasting asset because their value declines over time.
The time remaining until the exercise date increases in importance as the
exercise date nears. When you buy an option, you are paying for the right to
buy or sell something. The option has a time limit. The value will naturally
decline as time progresses, all other things being equal.
Figure 3.4 shows the option value curve at different times in the life of
the option, that is, with different numbers of days left to expiration. This
illustrates that the time value of the option declines as the expiration day
approaches. In addition, it demonstrates that far options will always be
priced higher than near options. The difference is greatest when the UI
price is at the strike price, but it declines as the UI price moves more in-
the-money or out-of-the-money.
Time value does not decline in a straight line. Instead, it declines very
little in the early days of its life and declines more sharply the closer it is to
expiration. Figure 3.5 shows the typical decline in value if everything else
stays the same.
Price of Underlying Instrument
90 days
60 days
30 days
Price of Option
FIGURE 3.4 Option Value Chart
c03 JWBK147-Smith April 25, 2008 8:33 Char Count=
The Basics of Option Price Movements 27
Time
Price
time value decay
FIGURE 3.5 Time Decay
The time value decay accelerates as expiration nears. The rate of decay
is roughly a function of the square root of the time remaining. You can
estimate the relationship of the rate of decay of two different options by
taking the square root of the months remaining on the longest option. For
example, the rate of decay of a two-month option is twice that of a four-
month option because the square root of four is two.
The rate of decay is called theta (θ). This is the loss in theoretical value
that will occur if another day passes, all other things being equal. Theta
measures the time decay of an option, usually in points per day. A theta
of 0.005 means that the option will lose 0.5 of a price unit each day. For
example, an option with a theta of 0.10 and worth 6.95 today will be worth
6.85 one day later, all other things being equal.
Sometimes the theta of a complex position is given in dollars per day
for the portfolio as a whole. This is particularly true if the portfolio contains
different instruments. It would not make sense to mix the thetas of two
different instruments, particularly if they are different commodities. For
example, mixing the thetas of IBM and AT&T options might make sense,
but it definitely does not make sense to mix the thetas of gold and silver in
the same portfolio. As a result, most options traders use the dollar value of
the various thetas in their portfolios when they have mixed UIs.
Interest Rates
The level of interest rates also affects the price of options. The higher inter-
est rates are, the higher the premium will be for options. The reason is that
options premiums are competing investments with debt instruments. Part
of the pricing of an option premium is the so-called risk-free rate, which is
usually considered to be the short-term Treasury-bill rate. Option pricing
c03 JWBK147-Smith April 25, 2008 8:33 Char Count=
28 WHY AND HOW OPTION PRICES MOVE
theory says that the return to an investor cannot be less than the risk-free
rate for the same time period because the option is a much riskier invest-
ment and the returns must be higher. This will be discussed in more detail
in the next chapter and in the sections of the book dealing with option
pricing models.
Rho (ρ) is the sensitivity of an option’s price to changes in the level
of interest rates. Few traders take rho into account when trading op-
tions because the changes in interest rates have little effect on option
prices. Typically, option strategists just plug in the current interest rate and
forget it.
Here’s an example of the change in value of an option when the level
of interest rates changes from 6 percent to 7 percent, all other things being
equal. Assume a strike price of 50 with the UI trading at 50 with 90 days to
expiration and an implied volatility ( see next section) of 20 percent. This
option will have a value of 1.95 with interest rates at 6 percent. The value
of the option is still worth 1.95 if interest rates move to 7 percent. Interest
rates would have to move all the way up to 8 percent before the value of
the option moves down to 1.94.
As you can see, interest rates have little effect on option prices unless
you live in a country with hyperinflation or where interest rates are moving
rapidly and sharply.
Foreign exchange options actually have to take into account two in-
terest rates because there are two country’s currencies involved. As a re-
sult, option theorists have come up with Phi (φ), which is the difference
between the two countries’ interest rates. Phi has even less of an effect
on option prices than rho does. Typically, t he only traders who pay atten-
tion to rho and phi are arbitrageurs who are looking to make microscopic
profits on their positions. Interest rates are typically looked at for such
strategies as:
r
Butterflies
r
Conversions
r
Reverse conversions or reversals
r
Boxes
This book will, therefore, generally ignore the effect of rho and phi
in discussions of most strategies. Their effect will be mentioned in those
strategies where they will have an impact.
Expected Volatility
The price of the option will be influenced by the expected and recent
volatility of the UI. (Volatility is the limit of how far up and how far down
c03 JWBK147-Smith April 25, 2008 8:33 Char Count=
The Basics of Option Price Movements 29
prices go—see Chapter 5.) The more volatile an instrument is, the more
valuable the option usually considered will be because increased volatil-
ity means there is a greater chance for the option to make money. Sup-
pose you buy an out-of-the-money option with a strike of 60 and a price
of 2 when the UI is 50. The price range of the UI for the past year has
been 48 to 52. Unless something dramatic occurs, it will be unlikely that
the call will expire with any intrinsic value. On the other hand, a recent
range of 25 to 75 suggests a much greater chance that the option will expire
in-the-money.
Investor’s perceptions of future volatility are largely influenced by re-
cent volatility. The option price is based on the expected volatility from
the time of purchase to the time of expiration. Volatility might have been
very low prior to initiating the position, but the market might expect
the volatility to increase because, for example, earnings estimates are
due to be issued or there is a series of economic reports about to be
released.
Volatility can play a large role in selecting option strategies because of
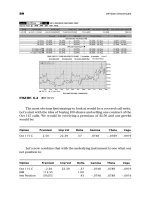
its powerful effect. The following chart shows the price of an at-the-money
call with the price of the UI at 65 with 23 days remaining until expiration.
Volatility Option Price
10 0.61
11 0.67
12 0.73
13 0.79
14 0.85
15 0.91
The price of an option can be broken into various components. Models
for determining the fair value of options can be turned on their heads and
used to compute the components of the current price. Implied volatility
is often calculated because of its importance. The implied volatility of an
option price is the expected volatility that is implied in the current option
price.
The responsiveness of the option price to changes in the volatility is
called vega. Vega measures how much the price of the option will change,
given a 1 percent change in implied volatility. A vega of 0.20 means that the
price of the option will move 0.20 of a price unit for every percentage-point
change in implied volatility. For example, an option worth 3.00 with a vega
of 0.30 and an implied volatility of 20 percent will be worth 3.30 if implied
volatility rises to 21 percent.
c03 JWBK147-Smith April 25, 2008 8:33 Char Count=
30 WHY AND HOW OPTION PRICES MOVE
(Please note that vega is not a Greek letter. This is why these various
measures of option sensitivity are called greeks, with a lower-case “g” and
the term often in quotes. Some academics prefer to use Greek letters for
all measures, so kappa (κ) and even zeta (ζ) are occasionally used. Vega
is used in the remainder of the book because it is the most common term
used by traders and strategists.)
The concepts surrounding volatility are so important to option strate-
gists that an entire chapter, Chapter 5, is devoted to volatility.
Dividend or Interest Payments
If a stock pays dividends (and many do), the dividends affect the price of
an option on that stock particularly at the time that the payment is made.
The value of the underlying stock will rise each day, all other things being
equal, until the day the dividend or interest is paid. This is because the value
of the stock is increased by the impending payment. For example, a stock
with a $1 dividend payment is worth more one day before the ex-dividend
day than 30 days before. (The ex-dividend day is the last day that you can
own a stock and receive the dividend.) The reason is that the total return
of buying the stock is greater one day before ex-dividend day because you
will have that $1 dividend.
The day after the dividend payment is made, the price of the stock
will drop approximately the same as the value of the payment. This affects
the option as well. The option price will drop following the payment, even
though the option owner does not receive the payment. This also has the
effect of reducing the value of options that pay high dividends relative to
those that pay low or no dividends. The dividend also has the microscopic
effect on options of having the dividend receiver earn interest on the
dividend.
The same sort of situation exists for options on interest-bearing instru-
ments, such as bonds. The price of the option rises slightly each day until
the interest payment is made. The price of the option then declines. The
daily rise in value is essentially imperceptible though the decline related to
the payment is often easy to note.
Once again, there is the additional microscopic effect on the value of
the option of being able to earn interest on the interest. This compounding
effect is virtually unnoticed unless you are holding multiyear options or the
total value of your portfolio is huge enough to see the effect.
The main option traders who pay attention to the compounding of div-
idend or interest payments are the professional market makers in such in-
struments as interest rate caps and long-term over-the-counter equity op-
tions. Just about everybody else ignores the effect of compounding.
c03 JWBK147-Smith April 25, 2008 8:33 Char Count=
The Basics of Option Price Movements 31
KEY OPTIONS CALCULATIONS
There are several key calculations necessary when trading options. What
is the most amount of money I can make? What is the worst that could
happen to me?
Size of Position
The size of the position can make a significant difference in your return.
Commission costs and, to a lesser extent, financing costs are reduced per
unit the more shares, stock index contracts, or futures contracts are writ-
ten against. For example, a covered write program using GM stock will cost
less per trade in commissions using 100,000 shares than using 100 shares.
The net effect is that, the greater the position, the higher the investor’s re-
turns will be and the better the break-even point will be.
Offsetting this may be an increased amount of slippage due to a lack
of liquidity because of the size of position being initiated. Trying to buy
100,000 options contracts at the market will move the market significantly.
You might start buying the options when they are trading at 2.00, but your
buying pressure alone might overwhelm any sell orders in the market, and
the price might blast up to 2.50. Your slippage will be about 0.50 per option
contract. Your commission bill will be small because you will have negoti-
ated a good rate because of your size, but the slippage will be much greater
than the commission savings.
Importance of Price
The returns of any option strategy are affected by the price paid or re-
ceived. This is particularly true with hedged strategies, such as covered
writes, spreads, combos, and straddles. The gain or loss of a tick can
have a profound impact on the return of the investment. This means
that you should be alert to not giving up that last dime when entering a
stock order.
On the other hand, it is also important to be alert to false economies.
You might be trading an option and looking for a huge move in the UI to
drive the value of the option to atmospheric heights. Then it would be smart
to give up ten cents to the market or specialist to get the order filled and
capitalize on the whole move.
You, therefore, need to be looking at the kind of strategy you are us-
ing to determine the importance of price to that strategy. (The discussion
about liquidity in Chapter 2 is relevant in this context as well.) In general
c03 JWBK147-Smith April 25, 2008 8:33 Char Count=
32 WHY AND HOW OPTION PRICES MOVE
it is best to enter orders at a limit price. Thus, you would buy an option by
placing a specific buy price in the order (“Buy 10 July 50 American Widget
options at 1.10”) rather than at the market.
Break-Even Point
The break-even point is the price point where you neither make nor lose
money on your investment. Each option strategy has a different break-even
point. Figure 3.6 shows the break-even point for a purchase of a call: At 55,
the gain in the price of the widget is equal to the cost of the call.
The break-even described here refers only to the break-even at the ex-
piration of the option. You can lose money before the expiration of the
contract if the price of the instrument declines. For example, suppose the
instrument went to $45 on the first day after buying a call. The value of
the call will have dropped below its $4.00 initial price, but not enough to
offset the decline in value of the instrument. This is because the value of the
call is composed mainly of time value rather than intrinsic value. The de-
cline in the UI price causes a decline in the option price but not to the same
extent as if the option were in-the-money and had more intrinsic value.
Don’t forget: The simple break-even point describes the situation only at
the expiration of the option.
Figure 3.6 shows the change in the break-even over time. Eventually,
the position loses all its time value. The valuation curve illustrates the clas-
sic options curve.
The actual break-even point at expiration is the same as the simple
break-even point, but you must take into account transaction costs and
70
60
50
40
30
20
Profit
10
–10
0
25
30 35 40 45 50 55 60 65
Price of Underlying Instrument
70 75 80 85 90 95 100 105 110 115 120
Break-even point
FIGURE 3.6 Break-Even Point
c03 JWBK147-Smith April 25, 2008 8:33 Char Count=
The Basics of Option Price Movements 33
carrying charges. Thus, the formula is:
Actual break-even point = Simple break-even point
− transaction costs + carrying charges
The break-even point is affected by many factors, primarily the type of
account and transaction. For example, a trade using stocks can take place
using cash or margin. The carrying charge for a cash transaction will only
be the opportunity cost. The carrying charge for stock bought on margin
includes the cost of financing for the additional stock.
Also note that carrying charges can be positive or negative. Some
strategies, particularly those with lots of options that are sold, create pos-
itive carrying costs. This means that you will earn money each day on the
carrying charges. Other strategies will cost you money to hold every day.
The formula for the actual break-even point shows that you will add
the carrying charges to the rest of the equation. Of course, if the carrying
charges are negative, then you will be adding a negative number, which is
the same as subtracting. For example, suppose it costs you $1.00 per day
to carry your position. You would then subtract $1.00 from the equation to
find the break-even point.
Net Investment Required
The net investment required is the dollar amount necessary to initiate the
trade. Each option strategy requires a different investment. A major deter-
minant of the amount is the type of trade. Are you buying or writing the op-
tion? Is it a mixed transaction that involves options and other instruments?
Is the trade going to use cash, or will margin be used? The net investment
required is detailed later in the discussion of each specific strategy.
The Investment Return
It is just as important to know the return on your investment as it is to
know the break-even point. There are several major ways to calculate the
return on your investment. Each way presents a different perspective on
the proposed trade.
A key way to make comparisons between various strategies is to annu-
alize the return. For example, you might expect to make 13 percent on one
option strategy for two months but 9 percent on another strategy that you
will hold f or one month. You will likely prefer the one-month investment
because the annualized return of 108 percent (9 percent × 12 months = 108
percent) is greater than the annualized yield of 78 percent (13 percent ×
12
/
2
months = 78 percent) of the other investment.