The Financial Times Guide to Options: The Plain and Simple Guide to Successful Strategies (2nd Edition) (Financial Times Guides)_10 ppt
Bạn đang xem bản rút gọn của tài liệu. Xem và tải ngay bản đầy đủ của tài liệu tại đây (375.35 KB, 23 trang )
214 Part 3
Thinking about options
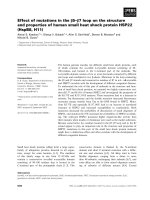
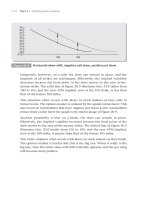
Frequently, however, on a rally the skew can remain in place, and the
implieds of all strikes are unchanged. Effectively, the implied volatility
decreases because the focal point of the skew moves to the new at-the-
money strike. The solid line of Figure 20.9 illustrates this: XYZ rallies from
100 to 105, and the new ATM implied, now at the 105 strike, is less than
that of the former 100 strike.
This situation often occurs with skews in stock indexes as they rally to
former levels. The options market is unfazed by the upside retracement. This
also occurs in commodities that have negative put skews as the commodities
retrace from a rally; there the graph is the mirror image of Figure 20.9.
Another possibility is that on a break, the skew can remain in place.
Effectively, the implied volatility increases because the focal point of the
skew moves to the new at-the-money strike. The dotted line of Figure 20.9
illustrates this: XYZ breaks from 105 to 100, and the new ATM implied,
now at the 100 strike, is greater than that of the former 105 strike.
This latter situation often occurs with skews in stock indexes as they break.
The options market is fearful that this is the big one. When it really is the
big one, then the entire skew will shift vertically upward, and the put wing
will become more positive.
100 105
XYZ
36
38
34
22
32
30
28
26
24
20
Figure 20.9
Horizontal skew shift, negative call skew, positive put skew
20
Volatility skews 215
A note on market sentiment
In all cases where a straight long or short option is chosen for a directional
strategy, skew risk can be minimised by trading the long or short call or
put spread.
Volatility skews are indicators of market senti-
ment. Positive skews indicate fear, while negative
skews indicate complacence. Sentiment, as we
know, can often be wrong, but it cannot be
ignored.
Volatility skews are
indicators of market
sentiment
part
4
Basic non-essentials
Introduction
Most of us won’t spend our options careers trading arbitrage, but when the
opportunity arises, as it does from time to time, it’s an almost risk-free way
to make money. So if you learn about the arb, then you’re prepared to take
advantage of it when you see it.
Read Part 4 at least once. Think about it from time to time. When you’re
scanning the markets, ask yourself, ‘Is there an arbitrage here? Can I lock
in a profit with this trade until expiration?’ If you keep this in mind, then
some day you’ll find yourself making a lot of money in a very short time.
If you’re prepared.
21
Futures, synthetics and
put–call parity
It is possible to combine options and underlying positions in ways that
simulate straight call or put positions. An underlying itself may be simu-
lated with a combination of options. As an example of the former, a long
at-the-money call plus a short underlying position has the same risk/
return profile as a long at-the-money put, and is therefore known as a syn-
thetic put.
Synthetic positions are used primarily by professional market-makers to
simplify the view of their options inventory in order to manage risk better.
They are of little practical use to traders who take options positions based
on market outlooks, but they can be studied in order to understand how
options markets work.
In order to understand synthetics, it is best if you understand why they
exist. Like all options positions, they are based on a relation to an under-
lying contract, which may be a cash investment or a futures contract.
If we briefly take this subject step by step, then we will avoid future
disorientation.
What a futures contract is
A futures contract is simply an agreement to trade a commodity, stock,
bond or currency at a specified price at a specified future date. Because no
cash is exchanged for the time being, the future buyer is said to have a
long position, and the future seller is said to have a short position. As a
result, the holder of the long position profits as the market moves up and
takes a loss as the market moves down. The holder of the short position
has the opposite profit/loss.
222 Part 4
Basic non-essentials
If short selling were not possible, investors would only be able to buy from
those who wanted to sell physical holdings; liquidity would suffer and
market volatility would increase. Most exchanges require a security deposit
in order to open a futures contract, and this deposit is known as initial
margin. The value of the contract as traded on the exchange invariably
fluctuates, and so results in a profit to one party and a loss to the other.
The party who has a loss is then required to deposit the amount of the
loss, and this additional deposit is known as variation margin. Margin
may be in the form of cash, or it may be in the form of liquid securities
such as treasury bills or gilts, for which the depositor still collects interest.
Meanwhile the party who has the profit is credited with variation margin,
and he receives interest on the balance.
Futures contracts have traditionally been used in commodities markets
in order to hedge supply shortages and surpluses. They are now used in
stocks, stock indexes, bonds and currencies. Many excellent books describe
how these forms of futures contracts operate.
An example of a futures contract
Consider the following example of a closing price of the S&P 500 index
with the settlement price of the December futures contract and the settle-
ment prices of the at-the-money call and put on the futures contract.
S&P index: 1133.68
December future: 1140.70
December 1140 call: 34.40
December 1140 put: 33.70
Here, the S&P futures contract multiplier is $250. An investor who
trades one of the above December contracts is hedging 1140.70 × $250 =
$285,175 worth of stocks that track the index. The options contract multi-
plier is $25.
We know that the December future, here with approximately six weeks
until expiration, trades at a premium to the cash. This is because taking a
long position in the futures contract instead of buying all the stocks in the
index requires a margin deposit only. The holder of the futures position
therefore has the use of his cash for the next six weeks. The value of the
futures contract is increased by the cost of carrying on the stocks.
21
Futures, synthetics and put–call parity 223
On the other hand, the holder of the long futures position forgoes the
dividends payable for the next six weeks, and therefore the value of the
December future is decreased by that amount. The formula for the value of
the futures contract is approximated as follows:
Futures contract = cash value of index + interest or cost of carry on
index until expiration – dividends payable until expiration
In practice, the formula is more complicated because annualised rates of
carry and dividend yields are used. Here, we are simply concerned with
why the above future trades above or below the cash.
Until recently short-term interest rates paid more than dividend yields,
and so stock index futures traded at a premium to their underlying
indexes. The situation is now reversed, and it is
similar to the 1950s, where dividend yields paid
more than short-term interest rates in order to
compensate for the risk of owning stock. This was
a holdover from the crash of 1929, when many
stock-holders’ investments were wiped out. The
reason now, however, is that after the recent bank-
ing crisis, the central banks are trying to maintain
liquidity by keeping interest rates low.
Occasionally, shortly before expiration, there may be a large amount of
dividends payable in a stock or stock index. Then the dividend outweighs
the interest amount and the future trades at a discount to the index. Once
the dividend or dividends are paid, then the future trades above the cash.
In any event, the futures contract and the cash index converge at expira-
tion because then there is no remaining differential between cost of carry
and payable dividends. The futures contract simply expires to the current
cash value of the index.
There, the holder of the long futures contract pays the cash value of all the
stocks in the index. The holder of the short futures contract receives the cash
value of all the stocks in the index. The ultimate amount exchanged is deter-
mined by the value of the index at expiration times the contract multiplier.
In the case of a physical commodity such as corn or crude oil, the futures
contract is deliverable to the quantity of the commodity specified in the
contract at the settlement price.
The futures contract
and the cash index
converge at expiration
because then there is
no remaining differential
between cost of carry
and payable dividends
224 Part 4
Basic non-essentials
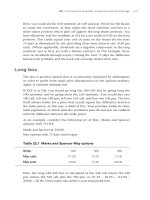
Synthetic futures contract
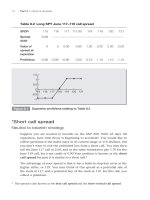
As we already know, a long XYZ 100 call, by virtue of its right to buy,
equals a long XYZ position when XYZ is above 100 at expiration. We also
know that a short XYZ 100 put, by virtue of its obligation to buy, equals a
long XYZ position when XYZ is below 100 at expiration. The sum of these
two options positions, therefore, equals a synthetic long XYZ position
with a strike price of 100. This is a result of the combined right and obliga-
tion. Consider the example in Figure 21.1.
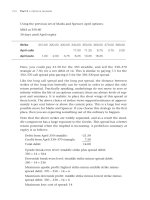
We also know that a short XYZ 100 call, by virtue of its obligation to sell,
equals a short XYZ position when XYZ is above 100 at expiration. A long
XYZ 100 put, by virtue of its right to sell, equals a short XYZ position
when XYZ is below 100 at expiration. The sum of these options positions,
therefore, equals a synthetic short position with a strike price of 100. This
again is a result of the combined right and obligation. Consider the exam-
ple in Figure 21.2.
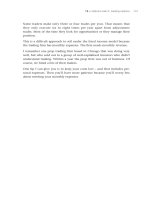
Assuming that interest rates will eventually rise, then the S&P 500 exam-
ple above is typical of the modern era. A long December 1140 call plus a
short December 1140 put equals a synthetic long futures contract valued
at 1140. If you pay 34.40 for the call, and sell the put at 33.70, then you
have paid a net 0.70 for the synthetic at 1140. In other words, you have
paid 0.70 to go long the future at 1140. You have paid 1140.70 for the
synthetic long future.
XYZ
P/L
95
100 105
Long 100 call
Short 100 put
Figure 21.1
Long XYZ synthetic
21
Futures, synthetics and put–call parity 225
Note that the actual December future is valued at 1140.70. Your synthetic
options position is valued the same, and always will be, as a futures contract.
If, on the other hand, you sell the call at 34.40 and pay 33.70 for the put,
then you have sold the synthetic future at 1140.70. Here, you have the
obligation to sell the future above 1140, and the right to sell the future
below 1140.
The profit/loss of the two synthetics is graphed in Figure 21.3.
XYZ
P/L
95
100 105
Long 100 put
Short 100 call
Figure 21.2
Short XYZ synthetic
XYZ
P/L
1140.70
Long December 1140 put
Short December 1140 put
Long December 1140 call
Short December 1140 call
Figure 21.3
Synthetic long December SPZ futures contract + synthetic short
December SPZ futures contract
226 Part 4
Basic non-essentials
Synthetics on individual stocks
In the case of individual stocks, there are also a synthetic futures posi-
tion, because the holder of a long call plus short put position at any strike
controls a long stock position without having to pay for the stock. The
situation is the same as with the S&P example above, but often there is no
underlying future for comparison. Still,the synthetic future exists. In the
stock options the synthetic future is often spoken of simply as the syn-
thetic, or occasionally, the combo.
Synthetic long call position
When a long XYZ 100 put is combined with a long underlying position,
the profit/loss’s of the put and the underlying cancel each other below
100, leaving the upside, profit-making leg of the underlying. The sum
equals a synthetic long call. For the purpose of illustration, let’s assume
that the call was purchased for free. At expiration, the synthetic position
would be as shown in Figure 21.4.
Now let’s return to the example based on the S&P 500 futures and options
on the futures:
XYZ
P/L
100
Long XYZ 100 put
Long XYZ
Long XYZ
Figure 21.4
Synthetic long 100 call
21
Futures, synthetics and put–call parity 227
S&P 500 December future: 1140.70
December 1140 call: 34.40
December 1140 put: 33.70
Suppose you take a long position in the futures contract at 1140.70 and
at the same time you pay 33.70 for the December 1140 put. You know
that below 1140 the profit/loss of the put and the futures contract offset
each other because below 1140 you have the right to sell what you own
at the price at which it was purchased less the cost of the put. Above 1140
you are simply long the futures contract. Being net long a futures contract
above 1140 is the same as owning a December 1140 call. The cost of your
synthetic call breaks down as follows.
The futures contract costs 1140.70, and the right to sell it at 1140 costs 33.70.
With your futures contract you have paid 0.70 more for what you own than
for your potential selling price. With your put your total cost is 0.70 + 33.70
= 34.40, or the price of the December 1140 call. Compare the profit/loss
tables for the 1140 call (Table 21.1) and the 1140 synthetic call (Table 21.2).
Table 21.1 Profit/loss of SPZ December 1140 call at expiration
SPZ
1080.00 1140.00 1174.40 1200.00
Cost of December 1140
call
–34.40
Value of call at
expiration
0.00 0.00 34.40 60.00
Call profit/loss
–34.40 –34.40 0.00 25.60
Table 21.2 Profit/loss of SPZ December 1140 synthetic call at
expiration
SPZ
1080.00 1140.00 174.40 1200.00
Profit/loss of long December
futures at expiration
–60.70 –0.70 33.70 59.30
Cost of December 1140 put
–33.70
Value of put at expiration
60.00 0.00 0.00 0.00
Profit/loss of synthetic long
call
–34.40 –34.40 0.00 25.60
228 Part 4
Basic non-essentials
Synthetic short call position
If instead XYZ is sold at 100, and at the same time a 100 put is sold, a syn-
thetic short 100 call results. Below 100 the profit on the short underlying
position and the loss on the short put offset each other. Above 100, a loss
is taken on the short underlying position. Let’s assume that the put was
sold for free. The graph at expiration would be as shown in Figure 21.5.
Returning to our SPZ example, suppose the above December 1140 put
is sold for 33.70 and a short position is taken in the futures contract at
1140.70, the result is a synthetic short call. The profit/loss is the opposite
to the above long synthetic long call (see Table 21.3).
Table 21.3 Profit/loss of synthetic short SPZ December 1140 call
at expiration
SPZ
1080.00 1140.00 1174.40 1200.00
Profit/loss of short December
futures at expiration
60.70 0.70 –33.70 –59.30
Income from December 1140 put
33.70
Value of put at expiration
–60.00 0.00 0.00 0.00
Profit/loss of synthetic short call
34.40 34.40 0.00 –25.60
XYZ
P/L
100
Short XYZ
Short XYZ 100 put Short XYZ
Figure 21.5
Synthetic short XYZ call
21
Futures, synthetics and put–call parity 229
Synthetic long put position
When a long XYZ 100 call is combined with a short underlying position,
the profit/loss of the call and the underlying cancel each other above 100,
leaving the downside, profit-making leg of the underlying. The sum equals
a synthetic long put. We’ll assume that the put is traded for free. At expira-
tion, the profit/loss graph is shown in Figure 21.6.
Returning to our SPZ example, suppose the December 1140 call is pur-
chased for 34.40, and a short position in the futures contract is taken at
1140.70. The result is a synthetic long put purchased for 33.70. Tables 21.4
and 21.5 show a comparison of the profit/loss of the synthetic and the
straight put.
Table 21.4 Profit/loss of long SPZ December 1140 put at
expiration
SPZ
1080.00 1106.30 1140.00 1200.00
Cost of December 1140 put
–33.70
Value of put at expiration
60.00 33.70 0.00 0.00
Put profit/loss
26.30 0.00 –33.70 –33.70
XYZ
P/L
100
Short XYZ
Short XYZ
Long XYZ 100 call
Figure 21.6
Synthetic long XYZ put
230 Part 4
Basic non-essentials
Table 21.5 Profit/loss of long SPZ December 1140 synthetic put
at expiration
SPZ
1080.00 1106.30 1140.00 1200.00
Profit/loss of short December
futures at expiration
60.70 34.40 0.70 –59.30
Cost of December 1140 call
–34.40
Value of call at expiration
0.00 0.00 0.00 60.00
Profit/loss of synthetic long
put
26.30 0.00 –33.70 –33.70
Synthetic short put position
When a short XYZ 100 call is combined with a long underlying position,
the profit/loss of the call and the underlying cancel each other above 100,
leaving the downside, loss-taking leg of the underlying. The sum equals a
synthetic short put. Again, we’ll assume that the put is traded for free. At
expiration, the profit/loss graph is shown in Figure 21.7.
Returning to our SPZ example, if the December 1140 call is sold at 34.40,
and a long position is taken in the underlying at 1140.70, the result is a
synthetic short put sold at 33.70. The profit/loss is the opposite of the
above long synthetic put (see Table 21.6).
XYZ
P/L
100
Long XYZ
Short XYZ 100 callLong XYZ
Figure 21.7
Synthetic short XYZ 100 put
21
Futures, synthetics and put–call parity 231
Table 21.6 Profit/loss of short SPZ December 1140 synthetic
put at expiration
SPZ
1080.00 1106.30 1140.00 1200.00
Profit/loss of long
December futures
at expiration
–60.70 –34.40 –0.70 59.30
Income from
December 1140
call
34.40
Value of call at
expiration
0.00 0.00 0.00 –60.00
Profit/loss of
synthetic short put
–26.30 0.00 33.70 33.70
The complex problem of put–call parity
The above are illustrations of put–call parity, which tells us that by know-
ing the value of the underlying, the strike price, and either the call or put,
the price of the unknown call or put can be determined. The formulas for
determining the value of a corresponding call or put at a particular strike
are as follows.
Call – put = futures – strike price (34.40 – 33.70 = 1140.70 – 1140),
therefore
Call = futures – strike price + put (34.40 = 1140.75 – 1140 + 33.70), or
Put = call – futures + strike price (33.70 = 34.40 – 1140.70 + 1140)
This equation can also be solved for the other two variables.
Futures = call – put + strike price (1140.70 = 34.40 – 33.70 + 1140), and
Strike price = futures + put – call (1140 = 1140.70 + 33.70 – 34.40)
All this really tells us is that a call and a put at the same strike have the
same amount of time premium, or volatility coverage. If you’ve read this
book with open eyes, you’ve already arrived at the same conclusion, at
least intuitively. The mysterious and complex world of put–call parity is
now exposed as a trifle. You, the intelligent reader, have more important
things to think about, such as choosing your socks in the morning.
232 Part 4
Basic non-essentials
The real problem of put–call parity is that for
many options contracts it doesn’t apply. It
assumes that in-the-money options have no early
exercise premium, which is only true of European-
style options. Put–call parity works with a straight
Black–Scholes model only, and only when deep in-
the-money options with their carrying costs are not involved.
If the above S&P 500 options were deep in the money, there would be
small discrepencies in the put–call parity values. If the put–call parity for-
mula were applied to options on the OEX or other American-style index
options, large discrepencies would result due to early exercise premium.
Significant discrepancies also result with American-style options on indi-
vidual stocks, i.e. most stock options.
Put–call parity can be a helpful way of pricing options, but its limitations
must be considered.
A call and a put at the
same strike have the
same amount of time
premium, or volatility
coverage
22
Conversions, reversals, boxes
and options arbitrage
Conversions, reversals, and boxes are used almost exclusively by market-
makers and risk managers to neutralise the risk of large options portfolios.
At one time, they were traded in order to profit from small price discrep-
ancies in synthetic positions, but now most mature options markets have
eliminated this opportunity.
A short synthetic underlying position can be combined with an actual
long underlying position to yield a forward conversion, or conversion.
Likewise, a long synthetic position can be com-
bined with an actual short underlying position to
yield a reverse conversion, or reversal. The profit/
loss of these positions does not change regardless
of market movement, and their only practical risks
are those of pin risk and early assignment.
A long box is the purchase of a synthetic underlying at a lower strike and
the sale of a synthetic underlying at a higher strike. A short box is the
opposite position. Because the box is both long and short the underlying,
its profit/loss does not change regardless of market movement. Again, the
only practical risks are pin risk and early assignment.
Conversion
A conversion is a long underlying plus a short call and a long put at the
same strike.
If XYZ is at 100, you could sell one 100 call, buy one 100 put, and buy
or go long XYZ to create a conversion. Because the sum of the position is
short the synthetic and long the underlying there is no profit/loss change
Conversions, reversals,
and boxes are used
almost exclusively to
neutralise the risk of
large options portfolios
234 Part 4
Basic non-essentials
regardless of underlying price movement. At expiration, the synthetic
pairs off against the underlying to leave no position.
Consider again the example from S&P 500 futures, and options on futures.
December S&P 500 future at 1140.70
December 1140 call at 34.40
December 1140 put at 33.70
Here, you could sell the call at 34.40, pay 33.70 for the put, and pay
1140.70 for the future. You have then sold the synthetic at 1140.70 and
you have bought the future at the same price. There is no profit or loss
to this position, nor will it change for the life of the options contract. At
expiration the short synthetic pairs off against the long future, and the
result is no position. There is minimal risk. Figure 22.1 shows is a graph of
the conversion.
Occasionally, there is a small amount of profit to be made by trading
the components of a conversion separately. For example, a trader might
be able to sell the above call at 34.50, thereby making 0.10 profit on the
whole position. This 0.10 is secure until expiration when all the compo-
nents pair off. Some traders spend the best part of their youth trying to
trade these small price discrepancies, and it is good for the rest of us that
they do so. Their form of trading is called arbitrage.
SPZ
P/L
1140.70
Long 1140 put
Long futures
Long futures
Short 1140 call
Figure 22.1
SPZ 1140 conversion
22
Conversions reversals, boxes and options arbitrage 235
By keeping the conversions in line, the arbitrageurs, or arbs, help to main-
tain efficient pricing in the market. As a result, we benefit by getting a fair
price for our options.
Reverse conversion, or reversal
A reversal is a short underlying plus a long call and a short put at the same
strike.
If XYZ is at 100, you could buy one 100 call, sell one 100 put, and sell or
go short one XYZ to create a reversal. Because the sum of the position is
long the synthetic and short the underlying, there is no profit/loss change
regardless of underlying price movement. At expiration, the synthetic
pairs off against the underlying to leave no position.
With the S&P example, you could pay 34.40 for the call, sell the put at
33.70, and sell the future at 1140.70. Here you have paid 1140.70 for the
synthetic and sold the future at the same price. Figure 22.2 shows a graph
of the entire position.
Again, the arbs exploit the smallest price discrepancy with any of the com-
ponents of the reversal. Here, they might pay 34.30 for the call, or sell the
put at 33.80, or pay 1140.60 for the future. Rarely is more than one com-
ponent out of line at one time.
SPZ
P/L
1140.70
Short futures
Short 1140 put
Long 1140 call
Short futures
Figure 22.2
SPZ 1140 reversal
236 Part 4
Basic non-essentials
Conversion and reversals on individual stocks
and on other stock indexes
The conversion and reversal markets on stocks operate in basically the
same manner. Remember that with stocks there are no futures contracts,
but that the options combine to form synthetic futures contracts. The situ-
ation is similar to the S&P 500 cash–futures–options relationship given in
Chapter 20:
S&P 500 cash index at 1133.68
December future at 1140.70
December 1140 call at 34.40
December 1140 put at 33.70
If the futures contract were eliminated, and the options were exercisable
instead to cash, then the relationship would be the same as between stocks
and stock options.
The OEX options are traded in this manner, without an underlying futures
contract; they are American style. Because there is no underlying cash
instrument, apart from an unwieldy basket of stocks, there is no conver-
sion or reversal tradable in the OEX.
The SPX options on the S&P 500 index, traded at the CBOE, are also based
solely on the underlying index; they are European style. Traders here
sometimes used the S&P 500 futures contract at the CME in order to create
a conversion or reversal.
The FTSE-100 contract is a hybrid. The options are assigned to cash at
monthly expirations like the OEX. There is a futures contract as well, like
the S&P 500, which trades in the March–June–September–December cycle.
During these four months, expiration for options and futures coincides at
10:30 on the third Friday, making conversions possible.
An example of a conversion in stocks is found in the following set of
Marks and Spencer options:
M&S at 350.60
May options, 75 DTE
May 350 call: 15.75
May 350 put: 14.75