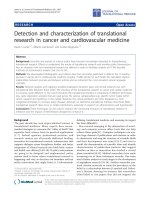
Báo cáo toán học: " Synthesis and characterization of CuO nanowires by a simple wet chemical method" pdf
Bạn đang xem bản rút gọn của tài liệu. Xem và tải ngay bản đầy đủ của tài liệu tại đây (288.88 KB, 12 trang )
This Provisional PDF corresponds to the article as it appeared upon acceptance. Fully formatted
PDF and full text (HTML) versions will be made available soon.
Synthesis and characterization of CuO nanowires by a simple wet chemical
method
Nanoscale Research Letters 2012, 7:70 doi:10.1186/1556-276X-7-70
Anita SAGADEVAN Ethiraj ()
Dae Joon Kang ()
ISSN 1556-276X
Article type Nano Express
Submission date 13 September 2011
Acceptance date 5 January 2012
Publication date 5 January 2012
Article URL />This peer-reviewed article was published immediately upon acceptance. It can be downloaded,
printed and distributed freely for any purposes (see copyright notice below).
Articles in Nanoscale Research Letters are listed in PubMed and archived at PubMed Central.
For information about publishing your research in Nanoscale Research Letters go to
/>For information about other SpringerOpen publications go to
Nanoscale Research Letters
© 2012 Ethiraj and Kang ; licensee Springer.
This is an open access article distributed under the terms of the Creative Commons Attribution License ( />which permits unrestricted use, distribution, and reproduction in any medium, provided the original work is properly cited.
Synthesis and characterization of CuO nanowires by a simple wet chemical
method
Anita Sagadevan Ethiraj
1
and Dae Joon Kang*
1
1
BK21 Physics Research Division, Department of Energy Science, Institute of Basic Science,
Sungkyunkwan University, 300 Cheoncheon-dong, Jangan-gu, Suwon, 440-746, South Korea
*Corresponding author:
Email addresses:
ASE:
DJK:
Abstract
We report a successful synthesis of copper oxide nanowires with an average diameter of 90 nm
and lengths of several micrometers by using a simple and inexpensive wet chemical method. The
CuO nanowires prepared via this method are advantageous for industrial applications which
require mass production and low thermal budget technique. It is found that the concentration and
the quantity of precursors are the critical factors for obtaining the desired one-dimensional
morphology. Field emission scanning electron microscopy images indicate the influence of
thioglycerol on the dispersity of the prepared CuO nanowires possibly due to the stabilization
effect of the surface caused by the organic molecule thioglycerol. The Fourier transform infrared
spectrum analysis, energy dispersive X-ray analysis, X-ray diffraction analysis, and X-ray
photoemission spectrum analysis confirm clearly the formation of a pure phase high-quality CuO
with monoclinic crystal structure.
Introduction
Since the discovery of carbon nanotubes, the synthesis of one-dimensional morphology such as
nanowires and nanorods has gained much attention because this constitutes an important building
block of nanodevices and integrated nanosystems [1-5]. Among the available transition metal
oxides, such as Ni, Cu, Zn, and Fe, synthesis of CuO is an important topic of research. Cupric
oxide, CuO, which is a p-type semiconductor [6-7] (indirect bandgap of 1.2 to 1.5 eV) has been
widely exploited for diverse applications, such as an active electrode material for Li-ion
batteries, field emission [FE] emitters, heterogeneous catalysts, gas sensors, and solar cells [8-
13]. Moreover, the evidence of a spin-dependent quantum transport phenomenon in CuO
nanowires was already reported [14]. Till now, many methods have been developed to synthesize
CuO nanowires or nanorods, such as thermal oxidation of copper foil, hydrothermal route,
aqueous reaction, vapor-liquid-solid synthesis, solution-liquid-solid synthesis, laser ablation, arc
discharge, precursor thermal decomposition, electron beam lithography, and template-assisted
synthesis [5, 15-19]. However, all these methods either require high temperatures, sophisticated
instrumentation, inert atmosphere, or long reaction time. The difference between the method in
this manuscript and the aqueous reaction referred earlier is the starting precursor material used
and the stabilizer. In our case, the precursor used is copper acetate, while in the aqueous reaction,
copper chloride. We used the organic molecule thioglycerol [TG] as stabilizer, while no
stabilizer was used in the latter case.
Moreover, until now, few reports are available in literature for the synthesis of CuO nanowires
using the organic molecule TG. Therefore, in the present study, a systematic effort has been
made to synthesize CuO nanowires by a simple and inexpensive wet chemical method using
copper acetate and NaOH as the precursor material in the presence of organic molecule TG. The
possible formation mechanism of CuO nanowires via this chemical method is also discussed.
Experimental detail
All the reagents were of analytical grade and were used without further purification. Copper
acetate [(CH
3
COO)
2
·H
2
O] and sodium hydroxide [NaOH] were used as precursors in the present
experiment. Two separate solutions, copper acetate (0.5 M) in deionized [DI] water and NaOH
(5 M) in DI water, were prepared. Aqueous copper acetate and aqueous NaOH solutions were
referred to as solution A and solution B, respectively. Stirring is continued until the respective
metal salts are completely dissolved in DI water. Later 1 µL of TG is added to solution A, and
the solution is stirred for a few minutes. Solution B is then added to the reaction mixture, and
water is immediately added. Further stirring continued for a few minutes. Centrifugation is done
to collect the precipitate. Washing of the precipitate is carried out using the DI water for five to
six times. Finally, the collected precipitate is dried overnight at 35°C.
The morphology of the CuO nanowires obtained in the present work was investigated by a field
emission scanning electron microscope [FE-SEM] (JEOL JSM-7401F; JEOL Ltd., Akishima,
Tokyo, Japan) operated at an accelerated voltage of 10 kV. The energy dispersive X-ray analysis
[EDX] was carried out on the scanning electron microscopy [SEM] system. X-ray diffraction
[XRD] spectra of the CuO samples were obtained using a powder X-ray diffractometer (D8
FOCUS 2200 V Bruker AXS, Bruker Optik Gmbh, Ettlingen, Germany), using Cu Kα radiation
(λ = 1.5418 Å) with 2θ ranging from 20° to 80°. The Fourier transform infrared spectrum [FTIR]
of CuO samples in the form of pellets was recorded using a Perkin Elmer 1615 spectrometer
(PerkinElmer, Waltham, MA, USA). Pellets were prepared by mixing CuO powder with KBr,
and spectrum was recorded in the range of 400 to 4,000 cm
−1
. X-ray photoelectron spectroscopy
[XPS] measurements were performed on ESCA MK II (VG Scientific Ltd., London, England)
set up by using an Al Kα X-ray source (hν = 1486.6 eV). All the experiments were carried out at
a base pressure of approximately 10
−9
mbar, and a C 1s spectrum at 285.0 ± 0.2 eV served as
the internal reference.
Results and discussion
CuO nanowires were synthesized by a wet chemistry route in the presence of organic molecule
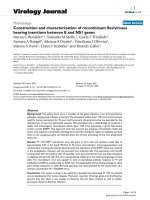
TG. Figure 1a represents the FE-SEM image of the as-synthesized CuO nanowires without TG,
and Figure 1b, in the presence of TG. The morphology of the CuO samples without TG shows
the formation of CuO flowers consisting of individual nanowires, whereas when the same
synthesis is carried out in the presence of organic molecules TG, isolated CuO nanowires were
obtained. Thus, the presence of a small amount of TG can render the nanowires of CuO well-
dispersed, as seen clearly in the micrograph of CuO with TG. The average diameter of the CuO
nanowires was observed to be around 90 nm with a length of about 2 to 5 µm.
In the synthesis of CuO nanowires, when copper acetate reacted with sodium hydroxide in the
aqueous medium, the following reaction takes place as stated in Equation 1. This particular
reaction does not involve any templates or substrates or any structure-directing agent like
cetyltrimethylammonium-bromide [CTAB] or hexamethylene tetramine [HMTA] [20, 21].
However, we introduced the organic molecule TG to the copper acetate solution before reacting
with NaOH. In the present synthesis, the concentration of Cu(OAc)
2
and NaOH and the reaction
time are the critical parameters to obtain the nanowire morphology. Since the surface passivation
of quantum dots using TG is well documented in literature [22, 23], we have tried to utilize for
the very first time the same organic molecule TG in the synthesis of CuO. From the SEM results,
we observe that when no TG was used, we obtained CuO flowers consisting of individual
nanowires. This result is in good agreement with the work reported by Zhu et al [24, 25].
(
)
(
)
TG
3 2 3 2
2
CuCH COO ·H O NaOH CuO 2Na CH COO H O
+ → + +
(1)
When the reaction in Equation 1 proceeds with the nucleation and crystal growth, the Gibbs free
energy of the nanocrystallite surfaces is very high, and in order to decrease the Gibbs free
energy, the nanocrystallites tend to aggregate [26]. Therefore, the flower morphology of CuO is
obtained. However, when a small amount of TG is introduced in the synthesis of CuO, instead of
a flower morphology, well-dispersed CuO nanowires are obtained, which can be speculated due
to the stabilization effect caused by the use of organic molecule TG. Moreover, the role of TG is
different from what structure-directing agents such as CTAB and HMTA are doing. In our case,
without any structure-directing agent, we are able to generate CuO nanoflowers. When we
carried out the CuO synthesis using TG, we obtained only separated CuO nanowires which
clearly imply that the role of TG is definitely different from the role of CTAB and HMTA, where
use of these agents leads to some kind of morphological changes in the material formation.
Hence, the role of TG in our case is just for dispersion due to surface stabilization. An in-depth
study is required, and further experiments are underway to understand and investigate the exact
mechanism and the role of TG in the synthesis of CuO nanowires.
In order to detect the elements present in the CuO samples, EDX analysis was carried out. The
spectrum (not shown) indicates the presence of copper [Cu], oxygen [O], and silicon [Si]. No
other impurity was detected. The presence of Si was from the substrate. Thus, the formation of
CuO was confirmed from the EDX.
The X-ray diffraction pattern of the CuO samples prepared in the presence of TG is depicted in
Figure 2. It can be clearly seen that all the peaks in the XRD patterns are consistent with the
JCPDS data (48-1548) of the CuO with a monoclinic phase. No characteristic peaks of any other
impurities such as Cu(OH)
2
, Cu
2
O, or precursors used are observed, indicating the formation of a
pure phase CuO.
In order to understand the chemical and structural nature of the synthesized CuO and the effect
of the chemicals used in the synthesis of CuO nanowires, FTIR analysis was carried out. Figure 3
represents the FTIR spectrum recorded for the CuO nanowires in the range of 400 to 4,000 cm
−1
.
The three characteristic bands observed at 432.3 cm
−1
, 497 cm
−1
, and 603.3 cm
−1
can be assigned
to the Au mode, Bu mode, and the other Bu mode of CuO [27]. The high-frequency mode at
603.3 cm
−1
may be attributed to the Cu-O stretching along the [101] direction, while the peak at
497 cm
−1
can be assigned to the Cu-O stretching vibration along the [101] direction [28].
Moreover, no other IR active mode was observed in the range of 605 to 660 cm
−1
, which totally
rules out the existence of another phase, i.e., Cu
2
O [29]. Moreover, the C-S bond observed at
661.4 cm
−1
can be attributed to the organic molecule TG used in the synthesis of CuO nanowires.
Thus, the pure phase CuO with monoclinic structure is also confirmed from the FTIR analysis.
The elemental composition and oxidation states of the CuO samples were analyzed using XPS.
The survey scan recorded (not shown) for the sample shows the presence of Cu and O. A trace
amount of sulfur which is detected comes from the TG. A selected area scan is also recorded for
the individual elements (Cu 2p, S 2p, and O 1s) and is shown in Figure 4a,b,c, respectively. The
Cu 2p core-level spectrum (Figure 4a) represents two peaks located at 934 and 953.8 eV which
corresponds to the Cu 2p3/2 and Cu 2p1/2, respectively. These values match well with the data
reported for the Cu(2p) in CuO [18, 30-32]. Also, the width of approximately 19.8 eV between
these two Cu peaks is the same as in the standard spectrum of Cu. In addition, the shake-up
satellite peaks located at 942.7 eV and 944.8 eV are at a higher binding energy value of 8.8 and
10.1 eV, respectively, when compared with the main sharp peak of Cu 2p3/2 located at 934 eV
[30]. The strong shake-up satellites recorded in the CuO sample confirm the Cu(II) oxidation
state and rule out the possibility of the existence of a Cu
2
O phase [18, 32]. The O 1s core level
spectrum is shown in Figure 4c, which demonstrates a broad Gaussian peak and is deconvulated
as peaks I, II, and III, respectively. The peak I at the low binding energy value of 529 eV is due
to the oxygen in the CuO crystal lattice, which corresponds to the O-Cu bond, whereas the peaks
II and III located at the higher binding energy values of 530.5 eV and 532.3 eV are due to the
chemisorbed oxygen caused by surface hydroxyl groups which are associated with the O-H bond
[18]. From the elemental scan of sulfur (Figure 4b), one can see that a small amount of sulfur
detected in XPS indicates the presence of TG on the surface of the CuO nanowires synthesized.
Conclusions
Using a simple and inexpensive wet chemical method, the synthesis of copper oxide nanowires
with diameters of 90 nm and lengths of several micrometers has been successfully carried out.
The concentration and quantity of precursors are the critical factors for obtaining the desired 1-D
morphology. SEM micrographs clearly indicate the influence of TG on the dispersity of the
prepared CuO nanowires which may be due to the stabilization effect of the surface caused by
the organic molecule TG. The FTIR and XPS data analyses confirm the formation of a pure
phase CuO with monoclinic crystal structure. EDX and XRD data support the same finding.
Competing Interests
The authors declare that they have no competing interests.
Authors' contributions
ASE did the synthesis and performed tests on the samples. DJK conceived and designed the
experiments. ASE and DJK wrote the manuscript. All authors read and approved the final
manuscript.
Acknowledgements
This work was supported by the Korea Science and Engineering Foundation (KOSEF) and the
National Research Foundation of Korea (NRF) grants funded by the Korean government (KRF-
2006-311-C00050), R31-2008-000-10029-0 (World Class University Program), and 2011-
0011775 (Basic Science Research Project).
References
1. Patzke GR, Krumeich F, Nesper R: Oxidic nanotubes and nanorods-anisotropic modules
for a future nanotechnology. Angew Chem Int Ed. 2002, 41:2446-2461.
2. Dekker C: Carbon nanotubes as molecular quantum wires. Phys Today 1999, 52:22.
3. Huang Y, Duan XF, Cui Y, Lauhon LJ, Kim KH, Lieber CM: Logic gates and computation
from assembled nanowire building blocks. Science 2001, 294:1313-1317.
4. Hu J, Odom TW, Lieber CM: Chemistry and physics in one dimension: synthesis and
properties of nanowires and nanotubes. Acc Chem Re 1999, 32:435-445.
5. Martel R, Schmidt T, Shea HR, Hertel T, Avouris P: Single-and multi-wall carbon nanotube
field-effect transistors. Appl Phys Lett 1998, 73:2447-2449.
6. Marabelli F, Parravicini GB, Salghetti-Drioli F: Optical gap of CuO. Phys Rev B 1995,
52:1433-1436.
7. Fan H, Yang L, Hua W, Wu X, Wu Z, Xie S, Zou B: Controlled synthesis of monodispersed
CuO nanocrystals. Nanotechnology 2004, 15:37-42.
8. Switzer JA, Kothari HM, Poizot P, Nakanishi S, Bohannan EW: Enantiospecific
electrodeposition of a chiral catalyst. Nature 2003, 425:490-493.
9. Anandan S, Wen X, Yang S: Room temperature growth of CuO nanorod arrays on copper
and their application as a cathode in dye-sensitized solar cells. Mater Chem Phys 2005,
93:35-40.
10. Chowdhuri A, Sharma P, Gupta V, Sreenivas K, Rao KV: H
2
S gas sensing mechanism of
SnO
2
films with ultrathin CuO dotted islands. J Appl Phys 2002, 92:2172-2180.
11. Bennici S, Gervasini A: Catalytic activity of dispersed CuO phases towards nitrogen
oxides (N
2
O, NO, and NO
2
). Appl Catal B 2006, 62:336-344.
12. Ghosh S, Avasthi DK, Shah P, Ganesan V, Gupta A, Sarangi D, Bhattacharya R, Assmann
W: Deposition of thin films of different oxides of copper by RF reactive sputtering and
their characterization. Vacuum 2000, 57:377-385.
13. Hsieh CT, Chen JM, Lin HH, Shin HC: Field emission from various CuO nanostructures.
Appl Phys Lett 2003, 83:3383-3385.
14. Gillingham DM, Müller C, Hong J, Wu RQ, Bland JAC: Evidence of spin-dependent
quantum transport effects in CuO nanowires. J Phys Cond Matter 2006, 18:9135-9142.
15. Kaur M, Muthe KP, Despande SK, Choudhury S, Singh JB, Verma N: Growth and
branching of CuO nanowires by thermal oxidation of copper. J Cryst Growth 2006, 289:670-
675.
16. Cao MH, Wang YH, Guo CX, Qi YJ, Hu CW, Wang EB, Nanosci J: A simple route
towards CuO nanowires and nanorods. Nanotech 2004, 4:824-828.
17. Wang WZ, Varghese OK, Ruan CM, Paulose M, Grimes CA: Synthesis of CuO and Cu
[sub 2] O crystalline nanowires using Cu (OH)[sub 2] nanowire templates. J Mater Res
2003, 18:2756-2759.
18. Xu C, Lin Y, Xu G, Wang G: Preparation and characterization of CuO nanorods by
thermal decomposition of CuC
2
O
4
precursor. Mater Res Bull 2002, 37:2365-2372.
19. Jiang XC, Herricks T, Xia YN: CuO nanowires can be synthesized by heating copper
substrates in air. Nano Lett 2002, 2:1333-1338.
20. Zhang H, Yang D, Ji Y, Ma X, Xu J, Que D: Low temperature synthesis of flowerlike
ZnO nanostructures by cetyltrimethylammonium bromide-assisted hydrothermal process.
J Phys Chem B 2004, 108:3955-3958.
21. X. Gao, X. Li and W. Yu: Flowerlike ZnO nanostructures via hexamethylenetetramine-
assisted hermolysis of zinc−ethylenediamine complex. Phys. Chem. B 2005, 109:1155-1161.
22. Ethiraj AS, Hebalkar N, Kulkarni SK, Pasricha RDem C, Schmitt M, Kiefer W, Weinhardt L,
Joshi S, Fink R, Heske C, Kumpf C, Umbach E: Enhancement of photoluminescence in
manganese-doped ZnS nanoparticles due to a silica shell. J Chem Phys 2003, 118:8945-8953.
23. Khosravi AA, Kundu MM, Kuruvilla BA, Shekhawat GS, Gupta RP, Sharma AK, Vyas PD,
Kulkarni SK: Manganese doped zinc sulphide nanoparticles by aqueous method. Appl Phys
Lett 1995, 67:2506-2508.
24. Zhu J, Chen H, Liu H, Yang X, Lu L, Wang X: Needle-shaped nanocrystalline CuO
prepared by liquid hydrolysis of Cu(OAc)
2
. Mater Sci and Eng 2004, A 384:172-176.
25. Zhu J, Bi H, Wang Y, Wang X, Yang X, Lu L: Synthesis of flower-like CuO
nanostructures via a simple hydrolysis route. Mater Lett 2007, 61:5236-5238.
26. Wang JZ, Xu J, Zhu J, Chen HY: Preparation of CuO nanoparticles by microwave
irradiation. J Cryst Growth 2002, 244:88-94.
27. Nyquist RA, Kagel RO: Infrared Spectra of Inorganic Compounds. New York and London:
Academic Press; 1997:220.
28. Kliche K, Popovic ZV: Far-infrared spectroscopic investigations on CuO. Phys Rev B
1990, 42:10060-10066.
29. Zheng L, Liu X: Solution-phase synthesis of CuO hierarchical nanosheets at near-
neutral pH and near-room temperature. Mater Lett 2007, 61:2222-2226.
30. Moulder J, Sticke W, Sobol P, Bomben K: Standard ESCA spectra of the elements and
line energy information. In Handbook of X-ray Photoelectron Spectroscopy. Edited by Chastain
J. USA: Perkin Elmer Coorporation: Physical Electronics Division; 1992.
31. Hong ZS, Cao Y, Deng JF: A convenient alcohothermal approach for low temperature
synthesis of CuO nanoparticles. Mater Lett 2002, 52:34-38.
32. Zarate RA, Hevia F, Fuentes S, Fuenzalida VM, Zuniga A: Novel route to synthesize CuO
nanoplatelets. J Solid State Chem 2007, 180:1464-1469.
Figure 1. SEM micrograph for the CuO nanowires prepared (a) without TG and (b) with
TG.
Figure 2. XRD pattern of the as-synthesized CuO nanowires with TG.
Figure 3. The FTIR spectrum of the as-synthesized CuO nanowires in the presence of TG.
Figure 4. X-ray photoelectron spectra. (a) Cu
2p,
(b) S 2p, and (c) O
1s deconvolution of the
CuO nanowires synthesized with TG.
(a) (b)
Figure 1
20 30 40 50 60 70 80
004
311
220
022 , 311
113
202
020
112
202
112
111
111
110
2 theta (deg)
Intensity (arb. Units)
CuO Nanowires
Figure 2
500 1000 1500 2000 2500 3000 3500
0.80
0.85
0.90
0.95
1.00
3435
2924
1632.8
661.4
603.3
497
Transmittance ( % )
Wavenumber (cm
-1
)
432.3
Figure 3
930 940 950 960 970
0
20000
40000
60000
80000
100000
120000
Shake-up
Cu 2p1/2
Relative Intensity (c/s)
Binding Energy (eV)
Cu2p
Cu 2p3/2
Shake-up
(a)
160 165 170 175
0
200
400
600
800
1000
Relative Intensity
Binding Energy (eV)
S 2p
(b)
524 526 528 530 532 534 536 538
0
5000
10000
15000
20000
25000
30000
35000
40000
Relative Intensity ( c/s)
Binding Energy (eV)
I
II
III
CuO Nanowire Data
Fitted Data
O1s
(c)
Figure 4