Báo cáo khoa học: Expression and characterization of cyanobacterium heme oxygenase, a key enzyme in the phycobilin synthesis Properties of the heme complex of recombinant active enzyme potx
Bạn đang xem bản rút gọn của tài liệu. Xem và tải ngay bản đầy đủ của tài liệu tại đây (560.42 KB, 12 trang )
Expression and characterization of cyanobacterium heme oxygenase,
a key enzyme in the phycobilin synthesis
Properties of the heme complex of recombinant active enzyme
Catharina T. Migita
1
, Xuhong Zhang
2
and Tadashi Yoshida
2
1
Department of Biological Chemistry, Faculty of Agriculture, Yamaguchi University, Japan;
2
Department of Biochemistry,
Yamagata University School of Medicine, Japan
An efficient bacterial expression system of cyanobacterium
Synechocystis sp. PCC 6803 heme oxygenase gene, ho-1,
has been constructed, using a synthetic gene. A soluble
protein was expressed at high levels and was highly
purified, for the first time. The protein binds equimolar
free hemin to catabolize the bound hemin to ferric-bili-
verdin IX
a
in the presence of oxygen and reducing
equivalents, showing the heme oxygenase activity. During
the reaction, verdoheme intermediate is formed with the
evolution of carbon monoxide. Though both ascorbate
and NADPH-cytochrome P450 reductase serve as an
electron donor, the heme catabolism assisted by ascorbate
is considerably slow and the reaction with NADPH-
cytochrome P450 reductase is greatly retarded after the
oxy-heme complex formation. The optical absorption
spectra of the heme-enzyme complexes are similar to those
of the known heme oxygenase complexes but have
some distinct features, exhibiting the Soret band slightly
blue-shifted and relatively strong CT bands of the high-
spin component in the ferric form spectrum. The heme-
enzyme complex shows the acid-base transition, where
two alkaline species are generated. EPR of the nitrosyl
heme complex has established the nitrogenous proximal
ligand, presumably histidine 17 and the obtained EPR
parameters are discriminated from those of the rat heme
oxygenase-1 complex. The spectroscopic characters as well
as the catabolic activities strongly suggest that, in spite of
very high conservation of the primary structure, the heme
pocket structure of Synechocystis heme oxygenase
isoform-1 is different from that of rat heme oxygenase
isoform-1, rather resembling that of bacterial heme
oxygenase, Hmu O.
Keywords: cyanobacterium heme oxygenase isoform-1;
EPR; heme complex; protein expression; spectroscopy.
Photoreceptor chromophores in the plant kingdom are
categorized into two groups of chlorophyll and phycobilin.
Chlorophyll, which is contained in all plants including
cyanobacteria and protoflorideophyceae, is synthesized
from protoporphyrin IX, a precursor of heme. Phycobilins
of open-chain tetrapyrroles are produced from biliverdin
that is a product of heme degradation. Accordingly, the
chlorophyll and phycobilin syntheses share the pathway of
protoporohyrin synthesis from d-aminolevulinic acid [1,2].
Phycobilins work as the main photoreceptor of photosyn-
thesis in procaryophyta, cyanobacteria and other primitive
eucaryotic algae. Phycobilin synthesis branches from chlo-
rophyll synthesis at the iron insertion to protoporphyrin IX
to form heme that is catalyzed by ferrochelatase. Then,
heme is converted to biliverdin IX
a
by an enzyme named
heme oxygenase (HO). Biliverdin IX
a
is further reduced and
isomerized to produce phycobilins such as phycoerythro-
bilin and phycocyanobilin [3–5]. The enzymes catalyzing
these reactions, phycobilin synthase(s), have not been
identified yet. In higher plants, phytochromobilins are also
supposed to be synthesized from biliverdin IX
a
[6]. The
phytochromobilins are precursors of the chromophore of
phytochromes, which are photo-reversible light signal-
transducing biliproteins and have closely related structure
with phycobilins [7].
HO was first established in mammalian systems as a
membrane-bound microsomal enzyme that catalyzed the
regiospecific oxidative degradation of heme [8]. The
enzymatic reaction requires three molecules of oxygen
and six electrons to convert ferric heme to the ferric-
biliverdin complex and CO [9–13]. NADPH coupled with
cytochrome P450 reductase supplies the electrons in
mammalian systems. The mammalian HOs (inducible
isoform-1 and conserved isoform-2 are known) and their
heme complexes have been characterized relatively well
Correspondences to C. T. Migita, the Department of Biological
Chemistry, Faculty of Agriculture, Yamaguchi University,
1677–1 Yoshida, Yamaguchi 753–8515, Japan.
Fax/Tel: + 81 83 933 5863,
E-mail:
Abbreviations: hemin, ferric protoporphyrin IX; heme, iron proto-
porphyrin IX either ferrous or ferric form; hydroxyheme, iron
meso-hydroxyl protoporphyrin IX; HO, heme oxygenase;
Syn HO-1, Synechocystis heme oxygenase isoform 1.
Enzymes: heme oxygenase (EC 1.14.99.3); NADPH cytochrome P450
reductase (EC 1.6.2.4).
(Received 17 September 2002, revised 9 December 2002,
accepted 10 December 2002)
Eur. J. Biochem. 270, 687–698 (2003) Ó FEBS 2003 doi:10.1046/j.1432-1033.2003.03421.x
using recombinant proteins [14–16]. The crystal structures
of the human HO-1 [17] and rat HO-1 [18] have been
published. The reaction mechanism of heme degradation,
especially that of the first oxygenation step from heme to
a-hydroxyheme, has been clarified by recent works [19,20].
Recently, heme oxygenase has also been found in some
pathogenic bacteria [21–28]. They are water-soluble pro-
teins and mainly function to release iron from heme of the
host cells, which is necessary for the survival of bacteria
and for causing diseases. The crystal structure of the
bacterial HO (Hem O) has been reported [27]. The
reaction mechanism is supposed to be analogous to those
of mammalian HOs [22,23,25].
Algal and cyanobacterial HOs have been studied as a cell
extract for the last 20 years [29–33]. The proteins possessing
heme oxygenase activity have been obtained from red alga,
Cyanidium caldarium, and cyanobacterium, Synechocystis
sp. PCC 6701 and PCC 6803 [33], to date. The algal HO is a
soluble protein, localized in the plastids. The in vitro heme
oxygenase activity is supposed to need reduced ferredoxin
and the second reductant such as ascorbate. In 1993, the
HO gene of rhodophyta Porphyra purpurea (pbsA)was
isolated [34] and in 1996, the entire genome sequence of
Synechocystis sp. PCC 6803 was determined, identifying
two different HO genes (ho1 and ho2) [35]. Trials of cloning
and expression of these genes in Escherichia coli yielded
single active protein, HO-1, from the ho1 gene [36]. Another
cyanobacterial HO gene was identified in the complete
genomic sequence of Nostoc (Anabaena) sp. PCC 7120, very
recently [37]. On the other hand, recent research has
reported that, in higher plants, the Arabidopsis thaliana
hy1 gene encords a protein related to HO [38–40]. Thus, HO
seems to present ubiquitously in the plant kingdom, as a key
enzyme for the synthesis of photon-accepting chromo-
phores. However, knowledge of the characteristics of plant
HO is limited because large amounts of purified protein
have not been available so far.
In this study, we have constructed an efficient bacterial
expression system of the HO-1 protein, based on the ho1
gene sequence of cyanobacteria, Synechocystis sp. PCC
6803 [35] and have succeeded in obtaining highly purified
soluble protein, Syn HO-1, in a large scale. This is the first
report of the characterization of the isolated cyanobacterial
HO-1 protein and its heme complexes, applying the optical
absorption and electron paramagnetic resonance (EPR)
spectroscopies.
Experimental procedures
Construction of
Synechocystis
heme oxygenase-1
expression plasmid, pMWSynHO1
Plasmid purification, subcloning, and bacterial transfor-
mations were carried out as previously described [23]. A
T7 promoter-based expression vector, pMW172 (a gift
from K. Nagai, MRC Laboratory of Molecular Biology,
Cambridge, UK) was used to make the expression
plasmid pMWSynHO1 for the recombinant Synechocystis
heme oxygenase-1 by incorporating a double-stranded
synthetic oligonucleotide with unique restriction enzyme
sites for SpeI, SacI, AvrII, ClaI, and MluI between the
NdeIandHindIII sites. A 720-base pair synthetic gene
coding for the entire Syn HO-1 was synthesized from
nine oligonucleotides and their complements constructed
by 55–99mer nucleotides. Double strand DNAs, Oligo I
to Oligo IX, were ligated step by step into the restriction
enzyme sites of the plasmid, by use of T
4
ligase. Oligo I
and Oligo II were inserted between the sites of NdeIand
SpeI; Oligo III, between the sites of SpeI and SacI; Oligo
IV and Oligo V, between SacIandAvrII; Oligo VI,
between AvrII and ClaI; Oligo VII and VIII, between
ClaIandMluI; Oligo IX, between MluIandHindIII.
Escherichia coli strain JM109 was used for DNA
manipulation. The nucleotide sequence of the expression
plasmid, pMWSynHO1, was determined by an Applied
Biosystems 373A DNA sequencer.
Protein expression and purification
A 10-mL inoculumin Luria–Bertani medium (+ 50 lgÆmL
)1
ampicillin : 0.1% glucose) was prepared from plates of
transformed E. coli BL21 (DE3) cells carrying pMWSyn-
HO1. Cultures (500 mL) were inoculated with 1 mL
of the inocula and grown in Luria–Bertani medium
(+ 200 lgÆmL
)1
ampicillin) at 37 °CuntilD
600
reached
0.8–1.0. The cells were grown for an additional 16 h at 25 °C,
harvested by centrifugation, and stored at )80 °C until use.
Typical yield of cells from a 500-mL culture was 2 g.
The E. coli cells (10 g), resuspended into 90 mL Tris
buffer (pH 7.4, + 2 m
M
EDTA), were lyzed (2 mg lyso-
zyme per g cells) with stirring at 4 °C for 30 min. After
sonication (Branson 450 Sonifire) and centrifugation at
39 000 g for 1 h, the resulting supernatant was converted
into 35–60% (NH
4
)
2
SO
4
fraction and centrifuged. The
subsequent precipitates, containing the Syn HO-1 protein,
were dissolved in 20 m
M
potassium phosphate buffer
(pH 7.4) and applied to a Sephadex G75 column
(3.6 · 50 cm), pre-equilibrated with the same buffer. The
protein fractions eluted in the potassium phosphate buffer,
with the intense 27 kDa band on SDS/PAGE, were
gathered and directly loaded onto a DEAE-cellulose
(DE-52) column (2.6 · 28 cm). After washing the column
with 50 mL of 20 m
M
potassium phosphate (pH 7.4)-
50 m
M
KCl, the protein was eluted with 400 mL of 20 m
M
potassium phosphate (pH 7.4) using a linear gradient,
50–250 m
M
KCl. Collected fractions with high protein
content were further run through a hydroxylapatite column
(2.6 · 20 cm). The protein was eluted with 400 mL of
potassium phosphate (pH 7.4) using a linear gradient,
20–200 m
M
. Only fractions with the single band at 27 kDa
on SDS/PAGE were finally collected. The protein concen-
trations were estimated by Lowry’s method using crystalline
bovine serum albumin as standard.
Reconstitution of Syn HO-1 with hemin
An alkaline-hemin solution of 0.86 m
M
in 4.6 lL increments
was added to the 10 l
M
solution of Syn HO-1 in 2 mL of
0.1
M
potassium phosphate buffer (pH 7.0). Optical absor-
bance at 402 nm was monitored for each addition of
the hemin solution and plotted against the volume of
added hemin solutions to construct titration curves. The
heme–Syn HO-1 complex was purified by Sephadex G-25
and DEAE-cellulose (DE-52) column chromatography.
688 C. T. Migita et al.(Eur. J. Biochem. 270) Ó FEBS 2003
Optical absorption spectroscopy
Optical absorption spectra were recorded on a Shimadzu
UV-2200 spectrophotometer at 25 °C. The ferrous heme-
Syn HO-1 complex was prepared in a sealed cuvette by the
addition of dithionite to the 0.1
M
potassium phosphate
(pH 7.0) solution of hemin-Syn HO-1 that was previously
deoxygenated by use of oxygen absorber (Iuchi, A500–50S)
and saturated with argon. The CO complex of heme-Syn
HO-1 was prepared by displacing argon filled in the space of
a sealed cuvette containing the ferrous-Syn HO-1 solution
with CO. The oxy complex was prepared by introducing air
into the anaerobic sample of ferrous heme-Syn HO-1
generated by the reduction of the ferric complex with
NADPH/reductase. pH titration of the hemin-Syn HO-1
complex was conducted with the 1
M
Tris solution from
pH 6.0–8.5 and with the 1
M
NaOH solution from
pH 8.5–11.0. Determination of the pK
a
value was per-
formed by a curve fitting with the calculated curves of the
fraction of alkaline form vs. pH for given pK
a
values in the
Henderson–Hasselbalch equation.
EPR spectroscopy
EPR spectra were measured by a Bruker E500 spectrometer,
operating at 9.35–9.55 GHz, with an Oxford liquid helium
cryostat. The
15
NO-bound heme–Syn HO-1 complex was
prepared by adding dithionite to the argon-saturated
solution of Syn HO-1 and
15
NaNO
2
in EPR tubes.
Reaction of the heme–Syn HO-1 complex with ascorbic
acid and NADPH-cytochrome P450 reductase
Ascorbic acid (final concentration 10 m
M
) was added to an
optical cell containing heme–Syn HO-1 (8.4 l
M
)in2mL
of 0.1
M
potassium phosphate buffer (pH 7) at 25 °C.
Spectral changes between 240 and 900 nm were recorded
until the reaction was completed by monitoring the
maximum loss of the Soret band (A
402
) and the formation
of biliverdin (A
730
). In the experiments using NADPH-
reductase, the 14 equivalent of NADPH was added to the
solution of heme–Syn HO (8.5 l
M
) containing 55 n
M
of
the reductase. Soluble cytochrome P450 reductase is a
recombinant human enzyme, which lacks hydrophobic
region consisting of N-terminal 50 amino acid residues.
For construction of expression plasmid, we used the gene
gifted from F. J. Gonzalez of the National Institute of
Health (Bethesda, Maryland, USA), to be published
elsewhere.
HPLC analysis of the heme–Syn HO-1 reaction products
For the ascorbate-assisted reaction, ascorbate (final con-
centration 100 m
M
) was added to a mixture of heme–Syn
HO-1 (20 l
M
) and desferrioxamine (2 m
M
)in2mLof
0.1
M
Tris/HCl buffer (pH 7.4). For the NADPH/reduc-
tase supported reaction, NADPH (final concentration,
0.5 m
M
) was added to the solution of heme–Syn HO-1
(20 l
M
) and reductase (55 n
M
)in2mLof0.1
M
Tris/HCl
buffer (pH 7.4). After 2 h, the reactants were hydrolyzed
with HCl to ensure the full conversion into free biliverdin.
Each solution was subjected to a Supelclean LC-18 solid
phase extraction column prewashed with acetonitrile/water
(1 : 9, v/v) and eluted with acetonitrile/water (1 : 1, v/v).
Lyophilization of the collected fractions gave green
pigment, which was then dissolved in 5% HCl/methanol
and kept at 4 °C overnight. The product was extracted
with chloroform and analyzed by a column of Capcell
Pak C18 (SG 120, 4.6 · 150 mm) pre-equilibrated with
degassed acetonitrile/water (3 : 2, v/v) at a flow rate of
1mLÆmin
)1
. The biliverdin standards were eluted in the
order a (21.5 min), d (23.0 min), b (24.7 min), and c
(37.0 min).
Results
Expression and purification of Syn HO-1
We have successfully expressed a recombinant cyanobac-
terial Syn HO-1 protein using a synthetic gene constructed
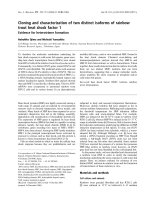
from nine oligonucleotides. Amino acid sequence of the
Synechocystis sp. PCC 6803 heme oxygenase (Syn HO-1)
has been compared with those of related mammalian and
bacterial HOs in Fig. 1. The harvested BL21 cells carrying
the Syn HO-1 expression vector, pMWSynHO1, were
green, same as reported for the cloned protein from
Synechocystis sp. PCC 6803 ORF sll1184 [36] and for
other mammalian and bacterial heme oxygenase proteins
[23,25,28,42]. Accumulation of a green pigment strongly
suggests the production of biliverdin, so that the Syn
HO-1 is supposed to be expressed as a catalytically active
protein, which has been confirmed as described later.
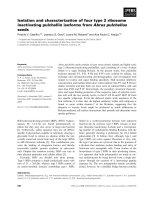
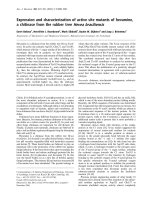
Recombinant Syn HO-1 was obtained as a soluble
protein. The purified protein through a hydroxylapatite
column showed a single band at 27 kDa on the SDS/
PAGE (Fig. 2, lane 2 and 3). Three litters of cell-cultured
solution ( 12 g of cell) yielded 30 mg of the purified
protein.
Formation of the heme–Syn HO-1 complex
When an aliquot of the alkaline-hemin solution is added
into the solution containing Syn HO-1, the resultant
solution gives the optical absorption spectrum which has a
Soret band at 402 nm, that is apparently distinguishable
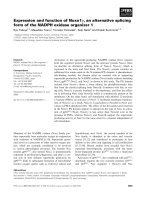
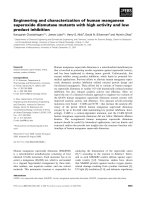
from the Soret band of free hemin. Utilizing this
difference, the stoichiometry of the heme binding reaction
ratio to Syn HO-1 was examined. The inset of Fig. 3
illustrates obtained titration plots. It clearly indicates that
the Syn HO-1 protein (10 l
M
) is saturated at a ratio of
1 : 1 hemin to protein, thereby establishing that Syn HO-1
binds equimolar hemin to form the hemin-enzyme
complex, same as mammalian and bacterial HOs
[14,23,25].
Spectroscopic characterization
Figure 3 exhibits optical absorption spectra of the ferric-,
ferrous-, oxy-, and CO-bound forms of heme–Syn HO-1.
The Soret bands of the ferric and ferrous forms, having
maxima at 402 and 427 nm, respectively, are slightly
blue-shifted compared with those of mammalian (404
and 431 nm) and bacterial (404, 406 and 434 nm) heme–
HO complexes. By contrast, absorption maxima of the
Ó FEBS 2003 Recombinant of cyanobacterium heme oxygenase (Eur. J. Biochem. 270) 689
Soret and Q (a and b) bands of the oxy form and the
CO-bound form do not show specific differences from
those of mammalian or bacterial HOs. The small band
at 634 nm seen in the spectrum of the CO-bound form is
thought to come from the verdoheme-CO complex
generated by the reaction of ferrous Syn HO-1 with
oxygen contaminated. Compared with the visible spec-
trum of the ferric form of heme-rat HO-1, the spectrum
of ferric heme–Syn HO-1 shows distinctively stronger CT
bands (498 and 630 nm) and weaker Q-bands (575 and
535 nm) in pH 7.0 potassium phosphate solutions (data
not shown). Optical absorption data of the heme-HO
complexes with different taxonomical origins are sum-
marized in Table 1. The absorption coefficient at 402 nm
for the ferric heme–Syn HO-1 complex is determined to
be 128 m
M
)1
Æcm
)1
by the pyridine hemochrome method
[23], which is the smallest among the values reported for
the mammalian and bacterial HOs.
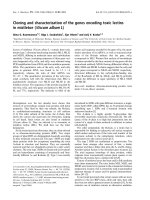
EPR of the heme–Syn HO-1 complex at pH 7 exhibits
an axially symmetric high-spin spectrum originated from
the ferric ion in approximately tetragonal ligand field
(g ¼ 6andg ¼ 2, upper spectrum in Fig. 4). The axially
symmetric spectra and g-values are similar to the ferric
high-spin state of mammalian and bacterial heme-HO
complexes [14,24].
pH dependence of the heme–Syn HO-1 complex
The optical absorption spectrum of the ferric heme–Syn
HO-1 complexvaries depending on pH. AspHincreases from
6 to 10, the Soret peak shifts from 402 to 418 nm gradually
and the peaks at 498 and 630 nm in the visible region are
alternated with the peaks at 537 and 575 nm, as shown in
Fig. 5, panel A. The expanded visible region spectrum shows
that the CT bands derived from the high-spin species remain
at pH 10. This pH-dependent alteration is reversible between
pH 6 and 10. The pK
a
value of this acid–base transition is
estimated based on the increase of absorbance at 418 nm as
pH increases. Curve fitting of the fraction of thealkaline form
to the calculated values using the Henderson–Hasselbalch
equation yielded the best-fitted result with pK
a
¼ 8.9
(Fig. 5B).
EPR spectra of the heme–Syn HO-1 complex also show
the pH dependency. As the pH increases from 7 to 10,
intensity of the axially symmetric spectrum is reduced and
instead, the low-spin signals newly appear. This change is
also reversible. Apparently two types of low-spin signals are
observed (Fig. 4, the lower spectrum). The major species
(denoted as A) with g
1
¼ 2.78, g
2
¼ 2.14, and g
3
¼ 1.74
shows larger anisotropy than the minor species (denoted as
B) with g
1
¼ 2.68, g
2
¼ 2.20, and g
3
¼ 1.80. Two kinds of
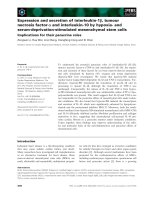
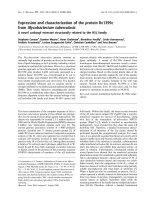
Fig. 1. Amino acid sequence alignment of Synechocystis, mammalian, and bacterial heme oxygenases. The plus sign indicates similar, while the
asterisk indicates identical amino acid residues. Nostocho, cyanobacterial Nostoc sp.PCC7120 [37], Hmu O, C. diphtheriae [23], and Hem O,
N. meningitidis A 2855 [25].
690 C. T. Migita et al.(Eur. J. Biochem. 270) Ó FEBS 2003
alkaline forms have been also observed for the heme
complexes of bacterial HO (Hmu O), while the single
alkaline species detected for the heme–rat HO-1 complex
[14,24]. The g-values of the alkaline forms of heme-HO
complexes are presented in Table 2.
EPR of the nitrosyl heme–Syn HO-1 complex
The EPR spectrum of the
15
NO complex of ferrous heme–
Syn HO-1 is represented in Fig. 6. The rhombic spectrum
typical of a six-coordinated nitrosyl heme complex exhibits a
triplet of doublet splitting at the g
2
component, that comes
from the interaction between nuclear spins of
14
N(I ¼ 1) and
15
N(I¼ ½) and an electron spin, respectively. By compa-
rison of the spectra of known nitrosyl heme–HO complexes
[14,24,41], the doublet component with a hyperfine coupling
constant of 31.1 gauss is reasonably assigned to the
15
N
nucleus of
15
NO on the distal site of heme. Similarly, the
triplet component with the hyperfine splitting of 7.1 gauss is
attributable to the
14
N nuclei of the axial ligand trans to the
nitrosyl ligand. This firmly establishes that the proximal
ligand of the heme–Syn HO-1 complex is a nitrogenous base.
The close value of hyperfine coupling constant of the
proximal
14
N nuclei to those of established histidyl axial
ligand in heme–HOs strongly suggests that the nitrogenous
proximal ligand of the heme–Syn HO-1 complex also has
histidyl origin in the proximal site (Table 3).
Catalytic turnover of the heme–Syn HO-1 complex
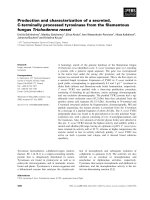
The time course spectra of the heme-conversion reaction in
the presence of ascorbate are depicted in Fig. 7, panel A.
Addition of ascorbate to the heme–Syn HO-1 complex
commences the reaction, which is monitored by the steady
decrease of the Soret and 498 nm bands and the shift of the
band at 630 nm to the longer-wavelength direction. At the
same time, a broad band with the maximum at approxi-
mately 690 nm appears and increases with time. The newly
Fig. 2. SDS/PAGE of purified Syn HO-1 protein. Lane 1, molecular
mass markers; lane 2, 2.4 lg of protein and lane 3, 24 lgofprotein.
Fig. 3. Optical absorption spectra of the heme–Syn HO-1 complexes. The spectra are the ferric (–-–), ferrous (– –), ferrous-CO (––), and oxy (- - - -)
complexes, respectively. Inset, titration of Syn HO-1 (10 l
M
) with hemin detected by the absorbance increase at 402 nm. The background
absorbance shown in Ôwithout Syn HO-1Õ comes from added free hemin. [Heme-Syn HO-1] ¼ 9.7 l
M
,in0.1
M
potassium phosphate (pH ¼ 7.0).
The ferrous form was made by the addition of dithionite (150 l
M
) under anaerobic condition and the spectrum was recorded after 15 min of
incubation. The oxy form was produced by the addition of air in the ferrous complex produced with NADPH (120 l
M
) and the spectrum was taken
after 5 min of incubation.
Ó FEBS 2003 Recombinant of cyanobacterium heme oxygenase (Eur. J. Biochem. 270) 691
Table 1. Optical absorption data for the heme-heme oxygenase complexes with different taxonomical sources. Syn HO-1, cyanobacterial Synechocystis
sp. PCC 6803; rat HO-1, taken from refs [9] and [14]; Pig A, Pseudomonas aeruginosa, taken from ref [28]; Hmu O, Corynebacterium diphtheriae,
taken from ref [23]; Hem O, Neisseriae meningitidis, taken from ref [25].
Protein Syn HO-1 rat HO-1 Pig A HO Hmu O Hem O
Ferric form
k
max
(Soret) (e (m
M
)1
)) 402 (128) 404 (140) 406 (129) 404 (150) 406 (179)
k
max
(visible) 630, 498 631, 500 632 630, 500
Ferrous deoxy form
k
max
(Soret) 427 431 434 434
k
max
(visible) 555 554 550
Oxy form
k
max
(Soret) 410 410 410 410
k
max
(a, b) 574, 537 575, 539 570, 540 570, 540
CO form
k
max
(Soret) 418 419 419 421 421
k
max
(a, b) 566, 536 568, 535 567, 537 568, 538 568, 538
Alkaline form
k
max
(Soret) 418 413
k
max
(a, b) 575, 537 575, 540
pK
a
8.9 7.6 8.0 9.0
Fig. 4. EPR spectra of ferric heme–Syn HO-1 complexes in neutral and
basic solutions. Measuring conditions: T ¼ 8 K, microwave frequency
9.55 GHz, field modulation 100 kHz, modulation amplitude 10 G,
microwave power 0.5 mW. In the pH 10.6 spectrum, the low-spin
region is expanded fivefold. The sample at pH ¼ 7.0, 100 lL of heme–
Syn HO-1 (400 l
M
)in0.1
M
potassium phosphate; the sample at
pH ¼ 10.6, 120 lL of heme–Syn HO-1 (300 l
M
)in1m
M
potassium
phosphate whose pH was adjusted with NaOH (1
M
).
Fig. 5. Determination of pK
a
for the heme–Syn HO-1 complex.
(A) Absorption difference spectra of the alkaline solutions, [heme-Syn
HO-1] ¼ 7.9 l
M
, referring to the spectrum at pH 6.0. The visible-
region is shown in the enlarged absorption spectra. (B) The fraction
of the alkaline form at given pH calculated for each value of pK
a
,8.7
(–-–), 8.9 (––), 9.1(- - -), and 9.3 (– –), based on the Henderson–Has-
selbalch equation. The heavy dots are the fractions estimated from the
experimentally obtained absorbance at 418 nm that is normalized
against the value at pH 10.2.
692 C. T. Migita et al.(Eur. J. Biochem. 270) Ó FEBS 2003
appeared visible band is suggestive of verdoheme or
biliverdin formation, or of their admixture. Then, after
2 h, the reaction mixture was separately analyzed by HPLC,
confirming that the final product was biliverdin IX
a
(data
not shown). To examine the formation of the verdoheme
intermediate, this reaction was performed under the limited
oxygen condition. As exhibited in Panel B in Fig. 7, the
spectrum recorded after 2 h (the dashed-and-dotted line)
has peaks at 534, 637, and 686 nm other than the Soret
peak. The solid-line spectrum recorded after 4 h shows new
peaks at the Soret region (416 nm) and at 566 nm and
indicates the 686 nm band further increased. The combined
double peaks at 600–750 nm are commonly observed in the
heme degradation by mammalian HO, which are markers
of verdoheme formation. Peaks at 534 and 686 nm are
attributable to the ferrous–verdoheme complex and the
peak at 637 nm to the CO-bound verdoheme complex due
to the trapping of CO concomitantly produced. The peaks
at 416 and 566 nm are attributable to the CO-bound heme–
Syn HO-1 complex (Table 1). Addition of CO transforms
the solid-line spectrum into the broken-line spectrum, in
which the peak at 637 nm is much enhanced and new peaks
Table 2. g-Values and g-anisotropy of alkaline forms of heme–heme oxygenase complexes. Data for Hmu O and rat HO-1 are taken from refs [24]
and [14], respectively. g-Anisotropy is defined as Dg ¼ g
1
) g
3
.
Protein Species
Syn HO-1 Hmu O
ABA¢ B¢ rat HO-1
g
1
2.776 2.675 2.72 2.67 2.67
g
2
2.144 2.203 2.16 2.21 2.21
g
3
1.737 1.795 1.76 1.80 1.79
Dg 1.039 0.880 0.96 0.87 0.88
Fig. 6. EPR spectrum of the
15
N-nitrosyl heme–Syn HO-1 complex.
Measuring conditions: T ¼ 30 K, microwave frequency 9.35 GHz,
field modulation 100 kHz, microwave power 0.2 mW, field modula-
tion amplitude 2G. [heme–Syn HO-1] ¼ 430 l
M
,in0.1
M
potassium
phosphate (pH ¼7.0).
Table 3. EPR parameters of the ferrous
15
N-nitrosyl heme–heme oxyg-
enase complexes. Data for Hmu O and rat HO-1 are taken from refer-
ence [24] and [14], respectively. g-Anisotropy is defined as Dg ¼ g
3
–g
1
.
Protein Syn HO-1 Hmu O rat HO-1
g
3
2.079 2.082 2.086
g
2
2.003 2.004 2.008
g
1
1.962 1.966 1.986
Dg 0.117 0.116 0.100
A(
15
N-NO) 31.1 G 30 26
A(
14
N-His) 7.1 G
a
6.8 7.4
a
Value of A(
14
N-L).
Fig. 7. Heme conversion by Syn HO-1 initiated by the addition of
ascorbate. (A) Spectra were recorded at the indicated time after the
addition of ascorbate solution (10 m
M
) to the heme–Syn HO-1 solu-
tion (8.4 l
M
in 0.1
M
potassium phosphate at pH 7.0). The Soret and
498 nm bands decrease with time, while the band at 680 nm appears
and increases. The spectrum recorded after 4 h indicates the formation
of mixture: free biliverdin, verdoheme, and verdoheme-CO. (B) The
reaction was conducted under argon atmosphere. Spectra were
recorded 2 h after the addition of ascorbate (–-–), 4 h after (––), and
after the replacement of Ar in the space of the sealed cell with CO (– –).
Ó FEBS 2003 Recombinant of cyanobacterium heme oxygenase (Eur. J. Biochem. 270) 693
appears at 350 and 541 nm while the peaks at 534 and
686 nm almost disappear. The peaks at 350, 404, 541,
637 nm are very close to those reported for the CO bound
verdoheme–rat HO-1 complex [16]. Accordingly, it can be
concluded that verdoheme is produced during the course of
heme degradation by Syn HO-1, accompanied by releasing
CO simultaneously. The overall rate of the heme degrada-
tion by Syn HO-1 with ascorbate is roughly estimated to be
one-fifth of that by rat HO-1 when the same amount of
enzyme and ascorbate are used.
Time course of the heme catabolic reaction by Syn HO-1
in the presence of NADPH cytochrome P450 reductase was
also examined. As illustrated in Fig. 8, the obtained spectra
are clearly discriminated from those of the ascorbate-
supported reaction. Although addition of 14 equivalent of
NADPH to heme–Syn HO-1 in the presence of reductase
initiates the reaction, the reaction is almost at a standstill
from 6 to 15 min after addition of NADPH. Shift of the
Soret maximum to 410 nm and appearance of the 534 and
573 nm bands in the visible region indicate that the oxy
complex of heme–Syn HO-1 is produced within 3 min and
accumulated. Decomposition of the oxy complex appears
much slower than its formation and does not end even after
210 min, exhibiting the bands of the remaining oxy
complex. The 340 nm-band of NADPH decreases in
proportion to the decrease of Soret band at 410 nm and
to the increases of broad band spreading 600–700 nm. The
latter band was confirmed to belong to biliverdin IX
a
by the
HPLC analysis (data not shown).
Discussion
Overall structure and heme binding
The primary structure of Syn HO-1 has very high identity
(38%) and similarity (67%) to that of human HO-1 [26].
Such resemblance is higher than the 57.4% homology of
cyanobacterial Nostoc sp. PCC7120 [37]. Other prokaryotic
HOs bear less resemblance to Syn HO-1: Hmu O, 31%
identity and 59% similarity; Hem O, 19% identity and 42%
similarity. Then, the tertiary structure of Syn HO-1 protein
is expected to resemble that of mammalian HO-1. Overall
holdings of bacterial HO (Hem O) [27] and mammalian
HO-1 [17,18] are known to be similar though their primary
structure are less similar than that between Syn HO-1 and
mammalian HO-1. Syn HO-1 binds equimolar hemin to
form the stable heme–Syn HO-1 complex. EPR of the
nitrosyl heme–Syn HO-1 complex has established that the
proximal ligand of the heme–enzyme complex is a nitro-
genous base. The aligned sequence depicted in Fig. 1
designates His17 as a potential candidate for the proximal
ligand of heme–Syn HO-1, that corresponds to the estab-
lished proximal ligand of His25 in mammalian HO-1 and
His20 in bacterial Hmu O [15,43].
Axial coordination structure of heme
The cryogenic EPR has revealed that the resting state
of heme–Syn HO-1 is in the axially symmetric ferric high-
spin state at pH 7.0. At alkaline pH values, the high-spin
state is partially converted into the low spin state. This
pH-dependent spin-state conversion is also observed at
room temperatures (Fig. 5). The alkaline forms of heme–
Syn HO-1 have g-values that are close to those of the
alkaline forms of heme–rat HO-1 and Hmu O (Table 1),
which are established to be the hydroxide-bound form
generated by deprotonation of the axially ligated water.
Therefore, the alkaline forms of heme–Syn HO-1 are also
thought to be the hydroxide-bound forms, which are
produced by the coordination of hydroxide originated
from dissociation of the heme-bound or nearby water,
correlating to the change of protonic equilibria of protic
residues in the distal heme pocket. As illustrated in Fig. 5,
the transition to the alkaline form is not completed even at
pH 10.
The determined pK
a
value of 8.9 for the heme–Syn HO-1
complex is higher than that of rat heme–HO-1 and close to
that of bacterial heme–Hmu O (Table 1). Hence, it follows
that the proton dissociation of distal water in Syn HO-1 is
less favorable than that in rat HO-1 but is similar to that in
Hmu O. The amino acid residues constructing the distal
helix in rat HO-1 (Leu129 to Met155) are almost all
Fig. 8. Heme conversion by Syn HO-1 initi-
ated by the addition of NADPH. Spectra were
recorded at the indicated time after the addi-
tion of NADPH (final concentration 120 l
M
)
to the solution of heme–Syn HO-1 (8.5 l
M
,
in 0.1
M
potassium phosphate at pH 7.0)
and reductase (55 n
M
).
694 C. T. Migita et al.(Eur. J. Biochem. 270) Ó FEBS 2003
conserved both in Syn HO-1 and Hmu O though the entire
primary structure of Syn HO-1 is much closer to that of rat
HO-1 than to that of Hmu O. The crystal structure of the
hydroxide-bound heme–rat HO-1 showed that Gly143N is
located within hydrogen bonding distance (2.60 A
˚
)withthe
heme-coordinating hydroxide [18]. Recently, we have found
that the alanine mutation of residues on the distal helix of
rat HO-1 alters the pK
a
value in order of 8.8 (S142A) > 8.6
(D140A) > 8.5 (R136A) > 8.0 (T135A) [44]. It appears
that the closer is the mutated residue to G143, the higher is
the pK
a
value, independent of the nature of the displaced
amino acid. One possible explanation for the high pK
a
value
of heme–Syn HO-1, and of Hmu O, is that the distal
ionizable group(s) that is responsible for the deprotonation
of the distal water is more distant from the heme axial site
than in rat HO-1.
Multiple alkaline forms
The major component (species A) of the two alkaline
forms of heme–Syn HO-1 is present at an approximately
threefold larger quantity than the minor component
(species B) (Fig. 4, Table 2). The bacterial heme-Hmu O
complex also forms two low-spin species, of which one is
far more predominant than the other (species B¢ and A¢ in
Table 2, respectively) [24]. For the low-spin ferric heme
complexes in the ground electronic states with dp spin
orbitals, the small but definite differences in the coordina-
tion circumstances are discriminated by g-values and
g-anisotropy [45]. Species B from Syn HO-1, species B¢
from Hmu O, and the species from rat HO-1 which has
only one alkaline form have very similar g-values and
g-anisotropy. In these species, then, the distal hydroxide
protons are possibly fixed to the same direction relative to
the heme plain. In rat HO-1, Gly143N resides in the
d-meso direction of heme, where the heme-coordinated
hydroxide least destabilizes dp orbitals of the heme iron,
resulting in smaller g-anisotropy. Consistently, g-aniso-
tropy of these species is smaller than that of Species A (Syn
HO-1) and Species A¢ (Hmu O). In the latter species with
the larger g-anisotropy, the hydroxyl ligand might more
lean to the direction of the counter pyrrole N
a
–N
a
axis,
where the dp orbitals are the most destabilized.
Coordination structure of the nitrosyl heme complex
There are considerable numbers of studies aimed at
characterizing the coordination structure of the nitrosyl
heme complexes and heme proteins. The rhombic type of
spectra obtained for the ferrous nitrosyl heme–HO com-
plexes is classified to Ôtype IÕ and supposed to contain a
bent Fe–N–O bond with an angle of 120–150° [46]. The
nitrosyl heme complex of Syn HO-1 has larger nitrogen
hyperfine coupling constant of the nitrosyl-nitrogen nuc-
leus, A
N
(
15
NO), and the smaller one of the proximal-
ligand nitrogen nucleus, A
N
(
14
N-L), compared with those
of the nitrosyl heme–rat HO-1 complex (Table 3). In
addition, each of the g-values of the nitrosyl heme–Syn
HO-1 complex is smaller than that of the rat HO-1 or
Hmu O complexes. The hyperfine interaction in the
nitrosyl heme complex arises from an unpaired electron
that originally occupies the 2 pp* orbital of nitrogen oxide
and is delocalized into the metal d-orbitals through r-and
p-interaction. The larger A
N
(
15
NO) and the smaller A
N
(
14
N-L) mean that the r-delocalization from the NO p*
orbital to the iron d orbitals is reduced. This phenomena
can be interpreted on assumption that the Fe–N(O)
distance is elongated due to the shortening of Fe–L bond.
Recent analysis of g-tensors of the six-coordinated nitrosyl
iron(II) porphyrins with the imidazole ligand by density
function theory describes that g-tensors of the type I
complexes are sensitive to the Fe–N(Im) bond length as
well as to the orientation of the NO ligand (but not to the
orientation of the imidazole ligand) [47]. Changes in the
Fe–N(Im) bond length less than 0.5 A
˚
is reflected in
deviations of the g-component up to 0.02, where the
shorter are the distance, the smaller are the g-tensor
components (g
1
, g
2
,andg
3
). Such small variation in the
bond lengths is detectable only by ultra-high resolution X-
ray crystallography [48]. According to this theoretical
estimation, our observation that all of the g
1
, g
2
,andg
3
components of nitrosyl heme–Syn HO-1 are smaller than
those of the rat HO-1 complex (Table 3) implies that the
Fe–N(L) bond length in nitrosylheme–Syn HO-1 is shorter
than that in nitrosyl heme–rat HO-1, in accordance with
the aforementioned assumption deduced from the consid-
erationonA
N
. The rhombic g-anisotropy thus reflects the
difference of the heme pocket structures that perturb the
coordination structure of the nitrosyl heme complexes. In
this meaning, the structure of either proximal or distal sites
of the heme pocket of heme–Syn HO-1 differs from that of
heme–rat HO-1, and rather resembles that of bacterial
heme–Hmu O.
Protein modification of coordination geometry
in the heme–Syn HO-1 complex
Among the heme complexes of Syn HO-1 and other wild
type HOs reported so far, the Syn HO-1 complex has
distinctively small absorption maximum of the Soret
band with a small absorption coefficient (Table 1). On
the other hand, relative intensities of the 498 and 630 nm
bands compared with those of the 575 and 535 nm
bands in the visible region spectrum are larger than those
observed in the spectrum of heme–rat HO-1. The former
bands, referred as CT bands, are commonly distinctive in
high-spin derivatives of ferric hemoproteins, while the
latter bands (a-andb-bands) are usually weak in
the high-spin derivatives but are distinctly observed in the
low-spin derivatives [49]. As the position and the intensity
of these bands are dependent not only on the spin state
or thermal spin-state equilibria but also on the nature of
the sixth ligand and the type of apoprotein, we could not
attribute these features to one of the possible causes at
present. However, it can be mentioned that the protein
modification of coordination geometry in the heme–Syn
HO-1 complex apparently differs from that in the known
heme–HO complexes.
Heme catabolism by Syn HO-1
The heme bound to Syn HO-1 is transformed into
biliverdin IX
a
regioselectively in the presence of oxygen
and electrons. In the course of reaction, verdoheme
Ó FEBS 2003 Recombinant of cyanobacterium heme oxygenase (Eur. J. Biochem. 270) 695
intermediate is produced accompanied by CO release.
Therefore, the mechanism of heme conversion by Syn
HO-1 is found to be fundamentally the same as that by
mammalian HOs, i.e. heme is converted to biliverdin
IX
a
, carbon monoxide, and iron through the three-step
reaction with the intermediates of a-meso-hydroxyheme
and verdoheme [13]. In the heme–Syn HO-1 reaction,
the final product is free biliverdin even under the
ascorbate-supported reaction, differing from the product,
ferric-biliverdin IX
a
, in the ascorbate-supported heme
catabolism by rat HO-1 and similar to that in the heme
catabolism of bacterial Hmu O under ascorbate [23].
Though both NADPH cytochrome P450 reductase and
ascorbate can support this reaction, the overall rate of heme
degradation is considerably slow in both systems compared
with that by mammalian HO, even slower than that by
bacterial Hmu O [23]. Notably, the heme conversion with
NADPH cytochrome P450 reductase is retarded at the oxy-
complex, which has been observed for the heme catabolism
neither by mammalian nor bybacterial HOs. The collation of
time-course spectra of Panel A in Fig. 7 with those of Fig. 8
makes us realize that reduction of the ferric heme–Syn HO-1
complex followed by the oxy complex formation is unfa-
vorable in the ascorbate-supported reaction as evidenced by
no accumulation of the oxy form. By contrast, conversion of
the oxy complex (to the hydroxyheme complex) is extremely
slow in the NADPH-reductase supported reaction although
reduction of the ferric heme is sufficiently fast. The slow
reduction rate of the ferric heme–Syn HO-1 complex by
ascorbate seems to imply the lower oxidation-reduction
potential of the heme iron in the Syn HO-1 complex
compared with that of the one in the rat HO-1 complex, that
might limit the overall reaction rate. As for the retardation of
heme conversion under NADPH/reductase, the electron
transfer from NADPH cytochrome P450 reductase to the
oxy complex appears to be quite inefficient in the heme–Syn
HO-1 complex. We have observed that the presence of 30
equivalents of ascorbate together with reductase in the
reaction mixture avoids the retardation (data not shown).
This makes us speculate that the long-range electron
tunneling pathway through the Syn HO-1 protein, from
the binding site of reductase to the heme edge, is not the Ôright
pathÕ. The cyanobacterial cell must provide an effective and
successive electron-transfer system for Syn HO-1. Searches
for the inherent reducing system that works in the physio-
logical Syn HO-1 reaction are currently underway.
Conclusive remarks
An effective bacterial expression system of cyanobacterial
Synechocystis heme oxygenase protein, was constructed for
the first time and the highly purified protein, Syn HO-1, was
obtained successfully. Syn HO-1 binds equimolar hemin to
form the heme–Syn HO-1 complex. The resultant complex is
converted to biliverdin IX
a
bythereactionwithoxygeninthe
presence of ascorbate or NADPH cytochrome P450 reduc-
tase, forming detectable intermediates, the oxy-heme and
verdoheme complexes. However, the overall reaction rate of
heme conversion is relatively slow. Characteristics of the
heme–Syn HO-1 complex discriminate from those of
the other heme–HO complexes. The resting state of the
heme–enzyme complex, which has a nitrogenous proximal
ligand, is in the ferric high-spin state. The complex exhibits an
acid–base transition with the pK
a
value of 8.9, which is larger
than that of the heme–rat HO-1 complex, suggesting that the
proton dissociation of the distal water is less efficient. The
heme–enzyme complex generates two kinds of the alkaline
form. The nitrosyl heme–Syn HO-1 complex of type I is
generated, which has a relatively large nitrosyl A
N
,small
proximal ligand A
N
,andsmallg components with large
anisotropy. These characters strongly suggests that the heme
pocket structure is different from that of mammalian HO
and somewhat resembles that of bacterial Hmu O, in spite of
very high conservation of the amino acid residues constitu-
ting the heme pocket among these HOs.
Acknowledgements
This work was supported in part by a grant-in-aid for Scientific
Research 12680625 and 14580641 (to T.Y.) from the Ministry of
Education, Science, Sports and Culture of Japan.
References
1. Beale, S.I. & Cornejo, J. (1983) Biosynthesis of phycocyanobilin
from exogenous labeled biliverdinin Cyanidium caldarium. Arch.
Biochem. Biophys. 227, 279–286.
2. Beale, S.I. (1993) Biosynthessis of phycobilins. Chem. Rev. 93,
785–802.
3. Beale, S.I. & Cornejo, J. (1991) Biosynthessis of phycobilins.
Ferredoxin-mediated reduction of biliverdin catalyzed by extracts
of Cyanidium caldarium. J. Biol. Chem. 266, 22328–22332.
4. Beale, S.I. & Cornejo, J. (1991) Biosynthessis of phycobilins. 3 (Z)-
phycoerythrobilin and 3 (Z)-phycocyanobilin are intermediates in
the formation of 3 (E)-phycocyanobilin from biliverdin IX
a
.
J. Biol. Chem. 266, 22333–22340.
5. Beale, S.I. & Cornejo, J. (1991) Biosynthessis of phycobilins.
15,16-Dihydrobiliverdin IX
a
is a partially reduced intermediate in
the formation of phycobilins from biliverdin IX
a
. J. Biol. Chem.
266, 22341–22345.
6. Matthew, J.T., McDowell, M.T. & Lagarias, J.C. (1995) (3Z)-
and (3E)-phytochromobilin are intermediates in the biosyn-
thesis of the phytochrome chromophore. J. Biol. Chem. 270,
11111–11118.
7. Quail, P.H., Boylan, M.T., Parks, B.M., Short, T.W., Xu, Y. &
Wagner, D. (1995) Phytochromes: photosensory perception and
signal transduction. Science 268, 675–680.
8. Tenhunen, R., Marver, H.S. & Schmid, R. (1969) Microsomal
heme oxygenase. J. Biol. Chem. 244, 6388–6394.
9. Yoshida, T. & Kikuchi, G. (1979) Purification and properties of
heme oxygenase from rat liver microsomes. J. Biol. Chem. 254,
4487–4491.
10. Docherty, J.C., Schacter, B.A., Firneisz, G.D. & Brown, S.B.
(1984) Mechanism of action of hemeoxygenase. A study of heme
degradation to the bile pigment by 180 labeling. J. Biol. Chem. 259,
13066–13069.
11. Matera, K.M., Takahashi, S., Fujii, H., Zhou, H., Ishikawa, K.,
Yoshimura, T., Rousseau, D.L., Yoshida, T. & Ikeda-Saito, M.
(1996) Oxygen and one reducing equivalent are both required for
the conversion of a-hydroxyhemin to verdoheme in heme
oxygenase. J. Biol. Chem. 271, 6618–6624.
12. Liu, Y. & Ortiz de Montellano, P.R. (2000) Reaction
intermediates and single turnover rate constants for the
oxidation of heme by human heme oxygenase-1. J. Biol. Chem.
275, 5297–5307.
13. Yoshida, T. & Migita, C.T. (2000) Mechanism of heme
degradation by heme oxygenase. J. Inorg. Biochem. 82, 33–41.
696 C. T. Migita et al.(Eur. J. Biochem. 270) Ó FEBS 2003
14. Takahashi, S., Wang, J., Rousseau, D.L., Ishikawa, K., Yoshida,
T., Host, J.R. & Ikeda-Saito, M. (1994) Heme-heme oxygenase
complex. J. Biol. Chem. 269, 1010–1014.
15. Ito-Maki, M., Ishikawa, K., Matera. K.M., Sato, M., Ikeda-Saito,
M. & Yoshida, T. (1995) Demonstration that histidine 25, but not
132, is the axial heme ligand in rat heme oxygenase-1. Arch.
Biochem. Biophys. 317, 253–258.
16. Takahashi, S., Matera, K.M., Fujii, H., Zhou, H., Ishikawa, K.,
Yoshida, T., Ikeda-Saito, M. & Rousseau, D.L. (1997) Resonance
Raman spectroscopic characterization of a-hydroxyheme and
verdoheme complexes of heme oxygenase. Biochemistry 36,
1402–1410.
17. Schuller, D.J., Wilks, A., Ortiz de Montellano, P.R. & Poulos,
T.L. (1999) Crystal structure of human heme oxygenase-1. Nature
Struct. Biol. 6, 860–867.
18. Sugishima,M.,Omata,Y.,Kakuta,Y.,Sakamoto,H.,Noguchi,
M. & Fukuyama, K. (2000) Crystal structure of rat heme
oxygenase-1 in complex with heme. FEBS Lett. 471, 61–66.
19. Davydov, R.M., Yoshida, T., Ikeda-Saito, M. & Hoffman, B.M.
(1999) Hydroperoxy-hemeoxygenase generated by cryoreduction
catalyzes the formation of a-meso-hydroxyheme as detected by
EPR and ENDOR. J. Am. Chem. Soc. 121, 10656–10657.
20. Davydov, R.M., Kofman, V., Fujii, H., Yoshida, T., Ikeda-Saito,
M. & Hoffman, B.M. (2001) Catalytic mechanism of heme
oxygenase through EPR and ENDOR of cryoreduced oxy-
hemeoxygenase and its Asp 140 mutants. J. Am. Chem. Soc. 124,
1798–1808.
21. Schmitt, M.P. (1997) Utilization of host iron sources by
Corynebacterium diphtheriae: Identification of a gene whose
product is homologous to eukaryotic heme oxygenases and is
required for acquisition of iron from heme and hemoglobin.
J. Bacteriol. 179, 838–845.
22. Wilks, A. & Schmitt, M.P. (1998) Expression and characterization
of a heme oxygenase (Hmu O). from Corynebacterium diphtheriae.
J. Biol. Chem. 273, 837–841.
23. Chu, G.C., Katakura, K., Zhang, X., Yoshida, T. & Ikeda-Saito,
M. (1999) Heme degradation as catalyzed by a recombinant
bacterial heme oxygenase (Hmu O) from Corynebacterium
diphtheriae. J. Biol. Chem. 274, 21319–21325.
24. Chu, G.C., Tomita, T., Sonnichsen, F.R., Yoshida, T. & Ikeda-
Saito, M. (1999) The heme complex of Hmu O, a bacterial heme
degradation enzyme from Corynebacterium diphtheriae. J. Biol.
Chem. 274, 24490–24496.
25. Zhu, W., Wilks, A. & Stojiljkovic, I. (2000) Degradation of heme
in Gram-negative bacteria: the product of the hem O gene of
Neisseriae is a heme oxygenase. J. Bacteriol. 182, 6783–6790.
26. Zhu, W., Hunt, D.J., Richardson, A.R. & Stojiljkovic, I. (2000)
Use of heme compounds as iron sources by pathogenic Neisseriae
requires the product of the hem O gene. J. Bacteriol. 182,
439–447.
27. Schuller, D.J., Zhu, W., Stojiljkovic, I., Wilks, A. & Poulos, T.L.
(2001) Crystal structure of hemeoxygenase from the Gram-
negative pathogen Neisseria meningitidis and a comparison with
mammalian heme oxygenase-1. Biochemistry 40, 11552–11558.
28. Ratliff, M., Zhu, W., Deshmukh, R., Wilks, A. & Stojiljkovic, I.
(2001) Homologous of neisserial heme oxygenase in Gram-
negative bacteria: degradation of heme by the product of the
pigA gene of Pseudomonas aeruginosa. J. Bacteriol. 183,
6394–6403.
29. Beale, S.I. & Cornejo, J. (1984) Enzymatic heme oxygenase
activity in soluble extracts of theunicellular red alga, Cyanidium
caldarium. Arch. Biochem. Biophys. 235, 371–384.
30. Cornejo, J. & Beale, S.I. (1988) Algal heme oxygenase from
Cyanidium caldarium. J. Biol. Chem. 263, 11915–11921.
31. Rhie, G. & Beale, S.I. (1992) Biosynthesis of phycobilins. J. Biol.
Chem. 267, 16088–16093.
32. Rhie, G. & Beale, S.I. (1995) Phycobilin biosynthesis:
reductant requiments and product identification for heme
oxygenase from Cyanidium caldarium. Arch. Biochem. Biophys.
320, 182–194.
33. Cornejo, J. & Beale, S.I. (1997) Phycobilin biosynthetic reactions
in extracts of cyanobacteria. Photosynth. Res. 51, 223–230.
34. Reith, M. & Munholland, J. (1993) A high-resolution gene map of
the chloroplast genome of the redalga Porphyra purpurea. Plant
Cell 5, 465–475.
35. Kaneko, T., Tanaka, A., Sato, S., Kotani, H., Sazuka, T.,
Miyajima, N., Sugiura, M. & Tabata, S. (1996) Sequence analysis
of the genome of the unicellular cyanobacterium Synechocystis sp.
Strain PCC 6803. II. Sequence determination of the entire genome
and assignment of potential protein-coding regions. DNA Res. 3,
109–136.
36. Cornejo, J., Willows, R.D. & Beale, S.I. (1998) Phytobilin
biosynthesis: cloning and expression of a gene encoding soluble
ferredoxin-dependent heme oxygenase from Synechocystis sp.
PCC 6803. Plant J. 15, 99–107.
37. Kaneko, T., Nakamura, Y., Wolk, C.P., Kuritz, T., Sasamoto, S.,
Watanabe, A., Iriguchi, M., Ishikawa, A., Kawashima, K.,
Kimura,T.,Kishida,Y.,Kohora,M.,Matsumoto,M.,Matsuno,
A., Muraki, A., Nakazaki, N., Shimpo, S., Sugimoto, M., Taka-
zawa, M., Yamada, M., Yasuda, M. & Tabata, S. (2001)
Complete genomic sequence of the filamentous nitrogen-fixing
cyanobacterium Anabaena sp. strain PCC 7120. DNA Res. 8,
205–213.
38. Muramoto, T., Kohchi, T., Yokota, A., Hwang, I. & Goodman,
H.M. (1999) The arabidopsis photomorphogenic mutant hy1 is
deficient in phytochrome chromophore biosynthesis as a result
of amutation in a plastid heme oxygenase. Plant Cell 11,
335–347.
39. Davis, S.J., Kurepa, J. & Vierstra, R.D. (1999) The Arabidopsis
thaliana HY1 locus, required for phytochrome-chromophore
biosynthesis, encodes a protein related to heme oxygenases.
Proc.NatlAcad.Sci.USA96, 6541–6546.
40. Willows, R.D., Mayer, S.M., Foulk, M.S., DeLong, A., Hanson,
K., Chory, J. & Beale, S.I. (2000) Phytobilin biosynthesis: the
Synechocystis sp. PCC 6803 heme oxygenase-encoding ho1 gene
complements a phytochrome-deficient Arabidopsis thaliana hy1
mutant. Plant Mol. Biol. 43, 113–120.
41. Ishikawa, K., Takeuchi, N., Takahashi, S., Matera, K.M.,
Sato, M., Shibahara, S., Rousseau, D.L., Ikeda-Saito, M. &
Yoshida, T. (1995) Heme oxygenase-2. J. Biol. Chem. 270, 6345–
6350.
42. Ishikawa, K., Sato, M. & Yoshida, T. (1991) Expression of rat
heme oxygenase in Escherichia coli as a catalytically active, full-
length form that binds to bacterial membranes. Eur. J. Biochem.
202, 161–165.
43. Chu, G.C., Katakura, K., Tomita, T., Zhang, X., Sun, D., Sato,
M., Sasahara, M., Kayama, T., Ikeda-Saito, M. & Yoshida, T.
(2000) Histidine 20, the crucial proximal axial heme ligand of
bacterial heme oxygenase Hmu O from Corynebacterium
diphtheriae. J. Biol. Chem. 275, 17494–17500.
44. Fujii, H., Zhang, X., Tomita, T., Ikeda-Saito, M. & Yoshida, T.
(2001) A role for highly conserved carboxylate, aspartate-140, in
oxygen activation and heme degradation by heme oxygenase-1.
J. Am. Chem. Soc. 123, 6475–6484.
45. Migita, C.T. & Iwaizumi, M. (1981) Low-temperature EPR
studies of highly anisotropic low-spin (protoporphyrinato) iron
(III) complexes. J. Am. Chem. Soc. 103, 4378–4381.
46. Tyryshkin, A.M., Dikanov, S.A., Reijerse, E.J., Burgard, C. &
Huttermann, J. (1999) Characterization of bimodal coordination
structure in nitrosyl heme complexes through hyperfine couplings
with pyrrole and protein nitrogens. J. Am. Chem. Soc. 121, 3396–
3406.
Ó FEBS 2003 Recombinant of cyanobacterium heme oxygenase (Eur. J. Biochem. 270) 697
47. Patchkovskii, S. & Ziegler, T. (2000) Structural origin of two
paramagnetic species in six-coordinated nitrosoiron (II)
porphyrins revealed by density function theory analysis of the g
tensors. Inorg. Chem. 39, 5354–5364.
48. Roberts, S.A., Weichsel, A., Qiu, Y., Shelnutt, J.A., Walker, F.A.
& Montfort, W.R. (2001) Ligand-induced heme ruffling and bent
NO geometry in ultra-high-resolution structure of nitrophorin 4.
Biochemistry 40, 11327–11337.
49. Smith, D.W. & Williams, R.J.P. (1970) The spectra of ferric
haem and haemoproteins. In Instructure and Bonding
(Hemmerich, K.P. et al., eds), Vol. 7, pp. 1–45. Springer-Verlag,
Berlin.
698 C. T. Migita et al.(Eur. J. Biochem. 270) Ó FEBS 2003