Báo cáo toán học: " Analysis and modeling of spatial characteristics in urban microscenario of heterogeneous network" potx
Bạn đang xem bản rút gọn của tài liệu. Xem và tải ngay bản đầy đủ của tài liệu tại đây (1.52 MB, 12 trang )
RESEARCH Open Access
Analysis and modeling of spatial characteristics in
urban microscenario of heterogeneous network
Jianhua Zhang
1*
, Nan Sheng
1
, Fenghua Zhang
1
, Lei Tian
1
, Guangyi Liu
2
, Weihui Dong
2
, Ping Zhang
1
and
Chia-Chin Chong
3
Abstract
Heterogeneous network (HetNet) is a typical deployment scenario for the IMT-Advanced system whereby the
macro enhanced node B (eNB) provides the wide coverage while the lower power nodes such as micro, pico,
femto, and relay nodes extend the coverage/capacity for coverage hole or hotspot. This literature addresses the
spatial propagation modeli ng for urban micro (UMi) scenario of HetNet. Due to users distributed in canyon streets,
the multipath with high power is not always coming from the line-of-sight (LoS) direction in UMi scenario.
Moreover, considering the impact of the directional antenna pattern, the current IMT-Advance d UMi channel
model may lead to inaccurate interference modeling. To verify this, multiple-input multiple-output (MIMO) field
channel measurement is conducted in downtown Beijing for typical UMi. Based on the measurement data analysis,
the multipath’s angular offset from the LoS direction is clearly observed. In order to capture such spatial
characteristic into the existing IMT-Advanced UMi channel model, the angular offset models are proposed for both
LoS and non-LoS (NLoS) cases. Finally, the interference and capacity simulation prove that it is necessary to capture
the angle offset model into the MIMO channel model in UMi scenario.
Keywords: IMT-Advanced, multiple-input multiple-output (MIMO), channel model, interference, HetNet
1. Introduction
With the expansion of the mobile data market, the
mobile operators have more and more pressure to
expand the cellular capacity by cell splitting or carrier
aggregation [1]. In order to make full use of the expen-
sive spectrum, the cellular technology is required to
improve the spectrum efficiency as much as possible. As
reported in [2], the mobile data market will increase
more than 50 times from 2010 to 2015. In order to
meet the requirements of the future d ata market, 3rd
Generation Partnership Project (3GPP) has started the
research and standardization of the next generation cel-
lular network technology, which is called as LTE-
Advanced [3].
The c ellular system is usually planned as hierarchical
coverage. The macro enhan ced node B (eNB) with high
transmit power and high antenna height is deployed to
provide wide coverage as the basic layer, whereas some
low power nodes such as micro, pico, femto, and relay
[4] nodes are deployed for the coverage/capacity expan-
sion as the secondary layer. In order to alleviate the
complexity of the network planning and optimization in
hierarchical cellular deployment like Global System for
Mobile (GSM) and Universal Mobile Telecommunica-
tion System, the macro eNB and micro/pico nodes are
allocated with different carrier frequencies, and thus the
interference between different coverage layers can be
ignored.
According to the prediction from International Tele-
communicat ion Union-Radio communication sector
(ITU-R) [ 5], the required spectrum for IMT-Advanced
is above 1 GHz, while the spectrum allocated for the
IMT-Advanced by ITU-R is less than 500 MHz now. In
order to fill the spectrum gap between the required and
the available, more aggressive spectrum usage strategies
have to be considered for IMT- Advanced . In 3GPP, the
hierarchical network with the same spectrum allocated
for both basic and secondary layers is defined as hetero-
geneous network (HetNet) [6]. Compared to the
* Correspondence:
1
Key Laboratory of Universal Wireless Communications, Ministry of Education,
Beijing University of Posts and Telecommunications, P.O. Box 92, Beijing
100876, China
Full list of author information is available at the end of the article
Zhang et al. EURASIP Journal on Wireless Communications and Networking 2011, 2011:187
/>© 2011 Zhang et al; licensee Springer. This is an Open Access article distributed under the terms of the Creative Commons Attribution
License ( which permits unrestricted use , distr ibution, and reproduction in any medium,
provided the original work is properly cited.
homogeneous interference among the macro eNBs, the
heterogeneous interference between macro eNB and
lower power nodes becomes more serious. In order to
deal with the serious inter-cell interference, the
enhanced inter-cell interference coordination (eICIC) [6]
and heterogeneous coordinated multiple point transmis-
sion and reception (CoMP) [7,8] are proposed in 3GPP.
To facilitate the corresponding performance evaluation
for HetNet, 3GPP has d efined the evaluation methodol-
ogy f or HetNet and eICIC [6]. However, only the path
loss and shadow fading are explicitly defined based on
the existing models, such as the IMT-Advanced model
[9] and ITU-R M.1225 [10], whereas the fast fading is
not defined explicitly. For the performance evalu ation of
eICIC in time domain, the path loss and shadowing may
be sufficient; however, for the eICIC and CoMP in the
spatial and frequency domains, the fast fading is neces-
sary to show a reliable performance. Therefore, both the
fast fading and slow fadin g of the M IMO channel
should be captured in performance evaluation metho-
dology of HetNet.
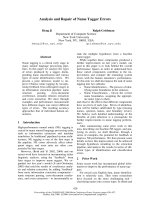
As shown in Figure 1, the eNB sites in typical urban
scenarios are usually surrounded by high-rise build-
ings. For the outdoor users distributed in the streets
outside of the building, the multipaths with high
power are not always coming from the l ine-of-sight
(LoS) direction due to the special street environment
in urban micro (UMi) scenario. However, in the cur-
rent geometry-based spatial channel model (GBSM), e.
g., IMT-Advanced UMi cha nnel model [9 ], the high
power multipath always focuses around the LoS direc-
tion for user equipment (UE). Therefore, the conflict
between the characteristics of the typical UMi scenario
and its corresponding GBSM model may happen,
which lead to inconsistency between the real
propagation characteristics and the corresponding spa-
tial channel modeling.
In this literature, the spatial models of the typical UMi
scenario of HetNet are addressed. Regarding the existing
IMT-Advanced UMi channel model, due to the impact
of the directional antenna pattern of eNB transmitter
and the phenomenon as described above, the intra-site
interference from the neighboring sectors of the same
micro eNB may be underestimat ed and thus, l eads to
overestimation of the single point MIMO system perfor-
mance. Dedicated MIMO field channel measurements
were conducted in downtown Beijing for typical UMi
scenario. The angular offset of the multipath is observed
from the measurement results, and a modified MIMO
channel model is proposed to capture such spatial char-
acteristics into the UMi channel model, where a random
angular offset is captured into the fast fading.
To verify the influence of the proposed model, the
theoretical channel capacity based on the measured data
is a nalyzed, and system level simulatio ns of Time Divi-
sion LTE-Advanced (TD-LTE-Advanced) system [11]
are performed. The numerical results show that the
intra-site interference has been underestimated by the
original IMT-Advanced UMi model, while the proposed
model provide better CoMP gain due to taking into
account the impact of the directional antenna pattern
and the angular offset on the multipath.
The rest of the article is organized as follows. The
limitations of the existing channel models are discussed
in Section 2. The field channel measurement is
described in Section 3. The proposed channel model for
UMi is presented in Section 4. The theoretical analysis
and system level simulation results are given in Sections
5 and 6, respectively. Finally, the conclusions are drawn
in Section 7.
Figure 1 HetNet deployment of macro/micro in typical urban environment.
Zhang et al. EURASIP Journal on Wireless Communications and Networking 2011, 2011:187
/>Page 2 of 12
2. Limitations of existing channel model
Wireless channel consists of many propagation paths,
which diffuse in the spatial domain at both the transmit-
ter and the receiver. T he performance of MIMO system
is greatly affected by the extent of the angular dispersion
of angle of departure (AoD) and angle of arrival (AoA),
which is described by the angular spread (AS) in the
existing chan nel models. Moreover, due to the a pplica-
tion of sectorized antennas, the spatial characteristics of
the channel between the eNB and a certain UE may be
influenced by the antenna pattern of the eNB.
As illustrated in Figure 2, the eNB has three sectors, i.
e., sectors A, B, and C. UE is served by sector A. With-
out loss of generality, we take the downlink interference
from sector B to the UE for example. The intra-site
interference could arrive at the UE either straightly from
the backside of the antenna (the green line in Figure 2)
or from the reflection by remote scatterers (the red line
in Figure 2). In existing GBSM, e.g., IMT-Advanced
channel m odel [9], almost all the intra-site interference
from sector B is supposed to come from the backside of
sector B antenna and has experienced extra 25 dB
attenuation because of the front to back ratio of the
antenna [9].
However, it might not be the case in UMi scenario,
especially in the downtown of dense urban like Beijing.
The canyon-like streets environment in such scenario
may lead to peculiar spatial characteristics of the
propagation channel, e.g., the center of the PAS has
some offset from the LoS direction. Considering the
impact of the sectored antenna pattern, it may influence
the interference modeling much and thus influence the
network capacity.
To facilitate the analysis, the intra-site i nterference
from sector B is defined as follows
I = X ·
−180
◦
<θ ≤180
◦
PL · A
eNB
(θ) · P(θ ) · A
UE
· dθ,
(1)
where X is the transmission p ower of the eNB. PL is
the path loss determined by t he distance betwee n eNB
and UE. A
eNB
( θ)is the antenna gain of the sect or B at
AoD θ. P(θ)isthechannelgainatAoDθ. A
UE
is the
omni-directional antenna gain at UE side which can be
assumed to be constant. Regarding a certain UE loca-
tion, the interference can be rewritten as
I = X · PL · A
UE
·
−180
◦
<θ ≤180
◦
A
eNB
(θ) · P(θ) · dθ .
(2)
Let G(θ)=A
eNB
(θ)·P(θ), which is the channel gain
affected by the eNB transmission antenna. Therefore,
Equation 2 can be transformed into
I = X · PL · A
UE
·
−180
◦
<θ ≤180
◦
G(θ) · dθ .
(3)
The eNB antenna pattern is usually defined as follows
[9]:
A(θ)=10
− min
⎡
⎣
12
θ
θ
3dB
2
,A
m
⎤
⎦
10
,
(4)
where θ
3dB
is the mainlobe’s 3 dB beam width, and
A
m
is the maximum attenuation. Typically, θ
3dB
= 70°
and A
m
= 25 dB.
As illustrated in Figure 2, the green line denotes the
interference departing at θ
1
from the LoS direction,
whereas the red line represents the interference depart-
ing at θ
2
. And the channel gain affected by the eNB
transmission antenna at θ
1
and θ
2
can be calculated as
G(θ
1
)=A
eNB
(θ
1
)·P(θ
1
)andG(θ
2
)=A
eNB
(θ
2
)·P(θ
2
),
respectively. In conventional channel model, P(θ
1
) ≤ P
(θ
2
), thus the v alues of P(θ
1
)andP(θ
2
)determinethe
relative magnitude between G(θ
1
)andG(θ
2
)ifA
eNB
(θ
1
)
and A
eNB
(θ
2
) are not taken into account. However,
according to the antenna pattern gain (the blue curve in
Figure 2) depending on the departure angle of each
path, it is found that A
eNB
(θ
2
) is much larger than A
eNB
(θ
1
). So it is very possible that G(θ
2
) could be in the
same order of magnitude with G(θ
1
). If G(θ
2
)isignored
in the int erference calculation from the channel
eNB
UE
sector B
sector C
sector A
0°
-90°
90°
180°
eNB
antenna pattern
(0 ) 0AdB
0
dB
0
)
dB
0
1
1
2
2
1
() 25AdB
()
1
()
1
B
dB
2
5
2
()P
)
2
1
()P
1
UE
2
()G
(
2
1
()G
1
Figure 2 Intra-site interference in UMi scenario.
Zhang et al. EURASIP Journal on Wireless Communications and Networking 2011, 2011:187
/>Page 3 of 12
modeling, the int erference experienced by the UE will
be inaccurate.
3. Field MIMO channel measurement
In order to verify our hypothesis, the dedicated field
MIMO channel measurements are carried out in down-
town Beijing for typical UMi scenario. This section
introduces the details of the environment, equipment,
and procedures of the field channel measurement.
3.1. Measurement equipment
The measurement was performed with the Elektrobit
PropSound channel sounder, which is described in more
details in [12,13]. The center frequency is 2.35 GHz,
which has been allocate d to the IMT-Advanced systems.
Both eNB and UE employ the three-dimension al (3D)
dual-polarized omni-directional arrays (ODA) with max-
imum 56 elements as shown in Figure 3. The element
spacing of the ODA is half of a wavelength. In our mea-
surements, eNB and UE use 16 and 32 elements of
ODA, respectively, to accurately extract the 3D spatial
characteristics of the MIMO channel. The antenna pat-
tern of the ODA is calibrated in the anechoic chamber.
Thus, the influence of the antenna can be excluded in
data processing and the anten na-independent channel
model can be constructed.
The channel sounding equipment works in a time-
division multiplexing mode. One channel sample of the
whole MIMO matrix is called a cycle. Each antenna
pairs is sounded once in a cycle due to that the high-
speed antenna switching units at both sides, which
enable the channel sounder to cap-ture the channel
response of each antenna pairs during the coherent
time. To capture the delay characteristics, wideband per-
iodic pseudo-random signals are transmitted between
different antenna pairs in sequence. The code length is
set to 255, which is long enough to capture all the
propagation paths in UMi scenario. The transmitter
(Tx) and receiver (Rx) are synchronized by an internal
rubidium clock before the measurement. At Rx side, the
raw data including channel information are collected.
The parameter settings of the channel sounder are sum-
marized in Table 1.
3.1.1 Environment and measurement procedures
To capture the propagation characteristics of the typical
UMi scenario, the measurement site and scenarios are
selected in downtown area of Beijing, China. The bird’s
eye view of the measurement environment is illustrated
in Figure 4. For this scenario, the eNB is usually
deployed near the corner of the cross-streets in order to
provide a thorough coverage to the two roads. In our
measurement, Tx is placed at the site of a GSM base
station, the Rx is moving along the streets around the
Tx as illustrated in Figure 4. To simulat e a user device,
theRxantennaarraywasfixedonatrolleyandmoved
along t he routes marked with yellow color in Figure 4.
The Routes 1 and 2 are under L oS condition, and Route
3 is under non-LoS (NLoS) condition. ODA is applied
at both the Tx and Rx sides to capture the back side
paths. The positions of Rx were recorded by global posi-
tioning system (Figure 5).
The measured data are stored in the memory of the
Rx and the channel characteristics are extracted by
accurate data post processing. LoS and NLoS cases are
processed separately to analyze the possible
differences.
4. Data processing and proposed angle offset
model
In this section, the post-data processing for the field
channel measurement results are introduced. The ran-
dom angle offset from the LoS direction is observed
from the extracted spatial p arameters cycle-by-cycle.
Based on the statistics of the angle offset values from an
amount of measurement cycles, the empirical model is
regressed and proposed to capture such spatial charac-
teristic into the GBSM channel model.
Figure 3 ODA used in measurement.
Table 1 Measurement parameters
Items Settings
Carrier frequency (GHz) 2.35
Bandwidth (MHz) 50
Code length (chips) 255
Transmitting power (dBm) 26
Types of antennas ODA
Number of eNB antenna (N
BS
)16
Number of MS antenna (N
MS
)32
Height of eNB antenna (m) 7
Height of MS antenna (m) 1.8
Zhang et al. EURASIP Journal on Wireless Communications and Networking 2011, 2011:187
/>Page 4 of 12
4.1. Data processing
In data pos t processing, firstly, th e CIRs are converted
from the raw data by sliding correlating the received sig-
nals with a synchronized c opy of the sequence. Then
Space-Alternating Generalized Expectation maximiza-
tion (SAGE) algorithm [14-17], which has widely been
used for channel parameter estimation, is applied in
order to extract the channel parameters from the CIRs.
As an extension of Maximum-Likelihood (ML) met hod,
the SAGE algorithm provides a joint estimation of the
parameter set with no constrains on the response of
antenna array. τ
n
, υ
n
, j
n
,
n
, A
n
, P
n
denote the propaga-
tion delay, Doppler shift, AoD, AoA, polarization matrix,
and the power of the nth pr op-agation path,
respectively.
From the extracted parameters, we can acquire the
channel power at AoD θ as
P( θ )=
N(θ)
n=1
P
n,θ
n,θ
P
n,θ
,
(5)
where N(θ)is the number of paths of which the j
n
= θ,
and the P
n, θ
is the power of the corresponding path.
4.2. Data analysis and angular offset modeling
Figure 6 depicts a spatial sample of the SAGE res ults.
The point s with dif-ferent colors stand for distinct paths
extracted in one cycle in polar coordinate system, with
total of 50 paths. The angles of those points are the j
n
from SAGE results. Besides, the r adius of each point
means the power of the path, P
n
. It is clearly shown that
there are two dominant groups of paths in this cycle,
where one group, drawn with black heavy line, coincides
with the LoS directi on, and the other group reaches the
UE through reflection of buildings in the street.
It is reasonable to assume that the mean angle of all
existent paths locates approximatel y in the middle of
the two groups, which means that the center of the PAS
distribution in this environment is not in accordance
with the LoS direction. It can be explained by the fact
that in the crossroads environment, most of the propa-
gation paths come along the street and are at the same
side of the LoS line. Thus, the offset between the mean
angle of PAS distribution and LoS direction appears and
it de termines the amount of signals deflect ed to nearby
sectors. In typical UMi environment, since the eNB is
deployed at the roof top, where lots of buildings are
higher than the eNB, offset values can easily be observed
for the canyon propagation in the street.
However, in the existing channel models such as IMT-
Advanced channel model, it assumes that the PAS f ol-
lows wrapped Gaussian or Laplacion distribution with
its center along the LoS direction. The offset betwe en
the mean angle of PAS distribution and LoS direction is
ignored.
In order to quantitatively describe this offset, the
angul ar spread of departure (ASD) is defined and calcu-
lated with the equation [9]:
φ
rms
= min
φ
⎛
⎜
⎝
n
(r(φ
n
+ φ − φ
mean
))
2
P
n
n
P
n
⎞
⎟
⎠
(6)
where j
n
is the AoD, the minimization over Δj is to
eliminate the additional angle spread introduced by dif-
ferent selection of reference zero angle. r(·) convert
angles to (-180, 180) degree. j
mean
is the power
weighted mean angle which is derived from
φ
mean
=
N
n
r(φ
n
+ φ)P
n
N
n
P
n
.
For the PAS that follows wrapped Gaussian or Lapla-
cian distribution, j
rms
will reach its minimum value
Figure 4 Bird’s eye view of the measurement scenario in downtown Beijing. (Photo courtesy of Google Earth.)
Zhang et al. EURASIP Journal on Wireless Communications and Networking 2011, 2011:187
/>Page 5 of 12
when Δj is at the center of the distribution. Thus, dur-
ing the data p rocessing of the measur ement data, w e
can obtain the Δj that minimizes j
rms
,whichisalso
the center angle of the PAS distribution.
To find the mean angle de noted in Figure 6, i.e., the
center of all paths in one cycle, the coordinate system in
which the angle spread is minimized need to be
determined. Offset values are obtained by subtracting
the mean angles of all paths from LoS direction in the
coordinate system.
According to the measurement result, it is found that
the distribution center is not in accordance with the
LoS direction (referred as 0 degree) and an angular off-
set is observed. In current channel models, the ASA and
ASD are calculated with Equation 6 from measured
data, and when we use the channel model to generate
j
n
, the center of the Gaussian or Laplacian distribution
is assumed to be the LoS direction, which is in contra-
diction with our observation.
In Figure 7, the examples of measured offset angle for
one LoS route and one NLoS route are shown. It can be
seen that for LoS route the offset angle is quite near 0
degree, but for NLoS routes the offset angle is highly
depend on the specific environment and usually has a
large value. It means that for LoS scenarios, maybe the
offset angle can be neglected just as the previous model-
ing method does. However, for NLoS cases, it is unrea-
sonable to neglect the offset angle with such a large
value. Especially for the UMi scenario at the crossroads,
where the angle offset is very common and has its p hy-
sical explanation that almost all the propagation paths
are arriving along the streets.
To capture such spat ial characteristic into the MIMO
channel model, the offset values in each cycle are collected
(a) T
x
(
b
)
Rx
Figure 5 Pictures of measurement environment. (a) Tx; (b) Rx.
offset
LOS
di r ect i on
cent er of PAS
di st r i but i on
Figure 6 Illustration of angular offset under realistic
environment.
Zhang et al. EURASIP Journal on Wireless Communications and Networking 2011, 2011:187
/>Page 6 of 12
and its empirical distribution is regressed out for model-
ing. Probability density function of the offset values and
their best fits under LoS and NLoS cases are shown in Fig-
ures 8 and 9. Due to the symmetry of the network archi-
tecture, only absolute offset values are considered here.
For LoS case, the absolute value of angular offset a
can be regressed as log-logistic distribution, i.e.,
f (α)=
e
ln α − μ
σ
ασ
⎛
⎜
⎝
1+e
ln α − μ
σ
⎞
⎟
⎠
2
,
(7)
(a) LoS
(b) NLo
S
0 100 200 300 400 500 600
-150
-100
-50
0
50
100
150
Cycle number
Offset angle
0 500 1000 1500
-150
-100
-50
0
50
100
150
Cycle number
Offset angle
Figure 7 Angle offset for LoS and NLoS routes. (a) LoS; (b) NLoS.
0 20 40 60 80 100 120 140 160 18
0
0
0.05
0.1
0.15
0.2
0.25
offset abs values (degree)
Density of abs offsets
offset1 data
log-logistic fit
Figure 8 Absolute offset values under LoS environment.
0 20 40 60 80 100 120 140 160 18
0
0
0.002
0.004
0.006
0.008
0.01
0.012
0.014
0.016
0.018
offset values (degree)
Density of abs offset
offset1 data
logistic fit
Figure 9 Absolute offset values under NLoS environment.
Zhang et al. EURASIP Journal on Wireless Communications and Networking 2011, 2011:187
/>Page 7 of 12
where μ = 1.524 and s = 1.048 are extracted from the
measured results. The a can be set as positive and nega-
tive values in equal probability.
For NLoS case, the abso lute value of a can be
regressed as logistic distribu-tion:
f (α)=
e
α − μ
σ
σ
⎛
⎝
1+e
α − μ
σ
⎞
⎠
2
,
(8)
where μ = 66.461 and s = 18.325. The a can be set as
positive and negative values in equal probability.
It is shown that under LoS environment, the absolute
values of the offset angles are best fitted with log-logistic
distribution, while there are best fitted with logistic dis-
tribution under NLoS environment. So, such spatial
characteristic of typical UMi scenario can be captured
into the IMT-Advanced channel model with the pro-
posed distribution.
In current ITU-R IMT-Advanced channel model, the
downlink AoD of the mth subpath of the nth path, j
n,
m
, is generated LoS-centered. To include the offset, we
can simply replace all the j
n, m
generated in o ne drop
with
φ
n,m
= φ
n,m
+ Y · α
(9)
where a is randomly generated according to the distri-
butions described by Equation 9 for LoS or Equation 10
for NLoS. A random variable Y with uniform distribution
in the discrete set of {1, -1} is multiplied to assign positive
or negative sign to the offset angles. Since the offset is an
overall shift of the PAS in one drop, it should be not ed
that the offset angle a is generated for each link and all
the j
n, m
inthesamelinkshouldbeshiftedwiththe
same offset angle (all the AoD of the paths have the same
offset ). The generation of all the other parameters can be
the same as the original IMT-Advanced channel model.
The proposed angular offset models and parameters
for UMi scenario are summarized in Table 2.
To verify the n ecessity of this offset modeling to the
channel modeling and the corresponding network per-
formance modeling, theoretical capacity and network
capacity analysis are conducted; the results are pre-
sented in the following section.
5. Impact of angular offset on channel capacity
To evaluate the impact of angular offset under different
kinds of antenna configurations and different antenna
patterns, the 50 paths extracted from SAGE algorithm,
where the impact of the measure ment an tenna is
excluded, are used to reconstruct the channel of desired
antenna setup.
It should be noted that before applying the sectored
antenna pattern, zero angle direction should be adjusted
as the bisection of the specified sect or. Referring to [9],
the channel reconstruction is given as follows:
H(τ )
u,s
=
N(τ)
n=1
F
T
Rx,u
(ϕ
n
)A
n
F
Tx,s
(φ
n
)
· exp(jd
s
2πλ
−1
0
sin(φ
n
))
· exp(jd
u
2πλ
−1
0
sin(ϕ
n
))
(10)
where τ
n
, j
n
,
n
are extracted by SAGE algorithm.
Moreo ver, (·)
T
denotes the matrix transpo se; N(τ) repre-
sents the number of paths at the given delay τ; l
0
is the
wavelength of the carrier, and d
u
stands for the distance
between the uth Rx antenna element and the first ele-
ment; F
Rx, u
is the field pattern of the Rx antenna ele-
ment. For Tx antenna e lements, d
s
and F
Tx, s
hold the
same meanings with d
u
and F
Rx, u
, respectively. In the
following studies, a ll Tx and Rx antennas are assum ed
to be isotropic for simplicity, i.e., the field patterns can
be rewritten as [9]
F
Tx,s
(φ
n
)=
F
Tx,s,v
(φ
n
)
F
Tx,s,h
(φ
n
)
=
cos β
Tx
sin β
Tx
cos φ
n
F
Rx,u
(ϕ
n
)=
F
Rx,u,v
(ϕ
n
)
F
Rx,u,h
(ϕ
n
)
=
cos β
Rx
sin β
Rx
cos ϕ
n
(11)
where b indicates the slant angle between the antenna
element and the vertical direction. Finally, H(τ)iscon-
verted into frequency domain by applying Discrete Four-
ier Transform, i.e., H
recon
(f).
j
n
denotes t he angle difference between the nth path
and LoS direc tion at the transmitter, respectively. If the
offset values are not taken into consideration, just as the
traditional channel models do, the coordination system
is shifted to make the center of the paths coincide with
LoS direction. j
n
is then expressed as
φ
n
= φ
n
− α
i
(12)
where a
i
means the off set value of the cycle i. Thus,
the comparison of the channel capacity with and with-
out the offset angle can be c onsidered as the compari-
son of the proposed model and the traditional model.
For capacity analysis, we assume that there is no chan-
nel state information (CSI) available at the transmitter
Table 2 Proposed parameters
Items LoS NLoS
Angular offset distribution Log-logistic Logistic
Parameters (°) μ 1.524 66.461
s 1.048 18.325
Zhang et al. EURASIP Journal on Wireless Communications and Networking 2011, 2011:187
/>Page 8 of 12
side. The transmit power is uniformly allocated across
frequency and space. Thus, with the reconstructed chan-
nel m atrix, the capacity of the l ink can be expressed as
[18]
C =
1
B
B
log
2
det
I
U
+
ρ
U
H
recon
(f )H
∗
recon
(f )
df
(13)
where H
recon
(f) is acquired by transforming the recon-
structed channel impulse response into frequency
domain.
Besides, from the eigenvalues of the channel matrix,
we can get a better understanding of the eigen multi-
path channels which determines the performance of
beamforming. Therefore, the cumulative distributive
function (CDF) of the ratio of the biggest eigenvalue
and the smallest eigenvalues is also presented.
To verify t he angular offset on the theore tical channel
capacity, the MIMO channel statistics for two cases are
compared. Case 1 is named as “measured data excluding
offset” , which is equivalent to the original IMT-
Advanced UMi channel model, where the angle offset
from the LoS direction is ignored. The case 2 is named
as “measured data”, which is equivalent to the modified
IMT-Advanced UMI channel model, where the offset
value from the LoS di rection is taken into account for
the fast fading modeling.
As shown in Fi gure 10, CDF of capacity for these two
cases is given. It can be observed that the impact of
angular offset value is negligible when SNR is -5 dB
since the system suffered from heavy noise. When the
SNR improves, the capacity calculated directly from the
measured data is larger than that when angular offset is
excluded. In other words, the curre nt channel models
might underestimate the ch annel capacity by ignoring
the angular offset.
In Figure 11, the ratios of the two eigenvalues of the
channel matrix are presen ted. It sho ws that when angu-
lar offset is excluded, the ratio of the eigenvalues turns
to be larger which implies that the power of the channel
is more centralized on one of the two eigen spaces. It is
in line with the results in Figure 10, when power is
equally allocated in each antenna element, smaller ratio
of the eigen values will lead to larger capacity.
6. Impact of angular offset on network capacity
To verify the impact of angular offset on the network
interference and capacity, the dedicated network simula-
tion is conducted. The details of the simulation can be
found in [19].
Figure 12 is the typical cellular deployment scenario
used in 3GPP. The interference from the other two
sectors within the same site is defined as intra-cell
interference, while the interference from the other
sites is defined as inter-cell interference. The ratio of
the intra-site interference to inter-site interference is
defined as
R =
I
intra
I
inter
(14)
From the simulation results illustrated in Figure 13,
the proposed angular offset has much impact on the
proportion of intra-site interference. The IMT-Advanced
UMi channel model without considering the angular off-
set leads to underestimation on the intra-site interfer-
ence. F or an intra-site CoMP system, where the three
sectors belonging to the same eNB can coordin ate to
transmit and receive simultaneously, th e intra-si te inter-
ference can be transformed i nto useful signals in intra-
site CoMP system. Therefore, the underestimation on
theintra-siteinterferencewillleadtounderestimation
Figure 10 Comparison of CDF for capacity with and without angular offset.
Zhang et al. EURASIP Journal on Wireless Communications and Networking 2011, 2011:187
/>Page 9 of 12
on the intra-site CoMP performance gain over the con-
ventional single point MIMO system.
To verify the impact of the angular offset on the sys-
tem performance, homogeneous intra-site CoMP in
UMi scenario is simulated. To fa cilitate the comparison,
TD-LTE-Advanced system [11] is assumed for the simu-
lation. The antenna configuration is 4 × 2 in downlink.
For intra-site CoMP, the joint processing with block
diagonalization algorithm is adopted [19] since the
downlink CSI can be obtained at the eNB by upl ink
sounding. The detailed evaluation methodology and
configurations of U Mi can be found in [9]. For TD
LTE-Advanced, the sounding period is 5 ms, dual-polar-
ized antennas are adopted at both eNB and UE, and the
antenna spacing is half a wavelength. The main assump-
tions for the simulation are listed in Table 3.
To show the impact of the proposed angular offset
model, the simulations based on the existing IMT-
Advanced UMi channel models and the modified IMT-
Advanced UMi channel models are performed
independently.
From the simulation results in Table 4, it is found that
the cell average spectrum efficiency of the single point
MIMO system has been overestimated by 20% and the
cell edge spectrum efficiency is overestimated b y 71%.
The cell avera ge spectrum efficiency of intra -site CoMP
has similar performance, whereas the cell edge spectrum
efficiency is underestimated by 61% (Table 3).
Inter-site cells
Intra-site cells
Figure 12 Demonstration on intra-site and inter-site interference.
Figure 11 Comparison of ratio of the two eigen values of the channel matrix.
Zhang et al. EURASIP Journal on Wireless Communications and Networking 2011, 2011:187
/>Page 10 of 12
From Table 3, it is also found that the performance
gain of MU-CoMP over EBB is underestimated by 55
and 80%, respectively, in spectrum efficiency and cell
edge spectrum efficiency by conventional IMT-
Advanced UMi channel model. Whereas 44 and 87%
performance gain of CoMP over MU-BF has been
underestimated by IMT-Advanced UMi channel
model.
The conclusion based on the analysis and simulation
results above quite align with our original hypothesis.
The current GBSM without considering the angular
offset underestimates the intra-site interference of t he
UMi scenario due to the special characteristics of the
environment and the impact of the directional
antenna pattern. The proposed angula r offset is neces-
sary for the IMT-Advanced UMi model to capture the
spatial characteristic of the scenario better and
improve the accuracy of the channel modeling for
UMi of Hetnet.
7. Conclusions
For HetNet resea rch and performance evaluation, accu-
rate channel model is very important. However, the cur-
rent standardization work only explicitly specifies the
path loss and shadowing model. To evaluate the solu-
tions in spatial and frequency domain and to investigate
the interference effects in HetNet scenarios, the accurate
fast fading model is vital. This literature addresses the
spatial propagatio n model ing for UMi of HetNet. Based
on the analysis on angular offset characteristics of the
UMi scenario and the impact of eNB transmitter
antenna pattern on the interference modeling, it is con-
cluded that the existing GBSM model, e.g., IMT-
Advanced UMi channel model, leads to underestimated
-30 -20 -10 0 10 20 30 40 50 6
0
0
0.1
0.2
0.3
0.4
0.5
0.6
0.7
0.8
0.9
1
Intra/Inter Ratio /dB
CDF
C
DF o
f
Intra-site
/
Inter-site Ratio in dB
IMT-Advanced UMi
Modified IMT-Advanced UMi
Figure 13 Impact of angular offset on ratio of intra-site interference to inter-site interference.
Table 3 Simulation parameters
Parameter ITU-R UMi
Site layout 3-sectorized hexagonal grid with 7 cells and wrap-around
Operating bandwidth 10 MHz
DL/UL ratio 2 DL/2 UL
Special subframe [10:2:2] for DwPTS, GP and UpPTS
UpPTS
Antenna boresight points toward flat side of cell
Antenna pattern Polarized antenna/horizontal antenna
eNB transmission power 46 dBm
UE receiver structure Minimum mean square error
UE number 10/sector in full queue
Link-to-system interface for simulations MI-ESM
HARQ combining Chase combining
Penetration loss 20 dB
Details can be found in [19].
Zhang et al. EURASIP Journal on Wireless Communications and Networking 2011, 2011:187
/>Page 11 of 12
intra-site interference. To verify this, field MIMO chan-
nel measurements are carried out in downtown Beijing
for typical UMi scenario. From the measurements, the
angular offset of the multipath is clearly observed. In
the proposed model, the angular offset in LoS and NLoS
cases are modeled as log-logistic and logistic distribu-
tion, respectively. The theoretical channel and the net-
work capacities’ analysis proves that it is necessary to
capture the random angle offset modeling into the IMT-
Advanced UMi channel model.
Acknowledgements
This study was supported in part by the China Important National Science
and Technology Specific Projects under Grant No. 2009ZX03007-003-01 and
by China 863 Program and Major Project under Grant No. 2009AA011502.
Author details
1
Key Laboratory of Universal Wireless Communications, Ministry of Education,
Beijing University of Posts and Telecommunications, P.O. Box 92, Beijing
100876, China
2
China Mobile Communications Corporation, Beijing, China
3
Orange-France Telecom, San Francisco, CA, USA
Competing interests
The authors declare that they have no competing interests.
Received: 2 March 2011 Accepted: 28 November 2011
Published: 28 November 2011
References
1. M Iwamura, K Etemad, F Mo-Han, R Nory, R Love, Carrier aggregation
framework in 3GPP LTE-advanced. IEEE Commun Mag . 48(8), 60–67
(2010)
2. Z Zhao, J Wang, H Guan, P E Mogensen, G Liu, X Shen, TD-LTE Network
Deployment Evolution in a Metropolitan Scenario. in Proceedings of the IEEE
Vehicular Technology Conference (VTC-Fall) USA 1–5 (2011)
3. 3GPP TR 36.806, Evolved universal terrestrial radio access (E-UTRA); relay
architectures for E-UTRA (LTE-Advanced) (2010)
4. R Pabst, BH Walke, DC Schultz, P Herhold, H Yanikomeroglu, S Mukherjee, H
Viswanathan, M Lott, W Zirwas, M Dohler, H Aghvami, DD Falconer, GP
Fettweis, Relay-based deployment concepts for wireless and mobile
broadband radio. IEEE Commun Mag. 42(9), 80–89 (2004). doi:10.1109/
MCOM.2004.1336724
5. ITU-R Report M.2133, Requirements, evaluation criteria and submission
templates for the development of IMT-Advanced (2008)
6. 3GPP TR 36.814, Evolved universal terrestrial radio access (E-UTRA); further
advancements for E-UTRA physical layer aspects (2010)
7. S Venkatesan, Coordinating base stations for greater uplink spectral
efficiency in a cellular network. in Proc IEEE 18th International Symposium
Personal, Indoor and Mobile Radio Communications PIMRC 2007 1–5 (2007)
8. 3GPP RAN1 R1-111086, CoMP Simulation assumptions, NTT DoCoMo (2011)
9. ITU-R report M.2135, Guidelines for evaluation of radio interface
technologies for IMT-Advanced (2009)
10. ITU-R report M.1225, Guidelines for evaluation of radio transmission
technologies for IMT-2000 (1997)
11. ITU-R WP5D Document 5D/580, Submission of TD-LTE-Advanced for IMT-
Advanced candidate technology, China (2010)
12. A Stucki, PropSound system specifications document: concept and
specifications, Switzerland, Technical Report. (2001)
13. Elektrobit, Propsound multidimensional channel sounder. http://www.
propsim.com
14. BH Fleury, M Tschudin, R Heddergott, D Dahlhaus, K Ingeman Pedersen,
Channel parameter estimation in mobile radio environments using the sage
algorithm. IEEE J Sel Areas Commun. 17(3), 434–450 (1999). doi:10.1109/
49.753729
15. BH Fleury, X Yin, KG Rohbrandt, P Jourdan, A Stucki, Performance of a high-
resolution scheme for joint estimation of delay and bidirection dispersion
in the radio channel, in Proceedings of the IEEE Vehicular Technology
Conference (VTC-Spring) Korea. 1, 522–526 (May 2002)
16. BH Fleury, P Jourdan, A Stucki, High-resolution channel parameter
estimation for MIMO applications using the SAGE algorithm. in Proceedings
of International Zurich Seminar on Broadband Communications Switzerland.
30,1–9 (February 2002)
17. BH Fleury, X Yin, P Jourdan, A Stucki, High-resolution channel parameter
estimation for communication systems equipped with antenna arrays. in
Proceedings of the 13th IFAC Symposium on System Identification (SYSID), no.
ISC-379, Netherlands (2003)
18. W Roh, A Paulraj, MIMO channel capacity for the distributed antenna. in
Proceedings of the IEEE Vehicular Technology Conference (VTC-Fall) Canada. 2,
706–709 (September 2002)
19. Q Wang, D Jiang, G Liu, Z Yan, Coordinated multiple points transmission for
LTE-Advanced systems. in Proceedings of the IEEE Int Conf Communications
workshop on LTE-Advanced, Germany 1–4 (2009)
doi:10.1186/1687-1499-2011-187
Cite this article as: Zhang et al.: Analysis and modeling of spatial
characteristics in urban microscenario of heterogeneous network.
EURASIP Journal on Wireless Communications and Networking 2011
2011:187.
Submit your manuscript to a
journal and benefi t from:
7 Convenient online submission
7 Rigorous peer review
7 Immediate publication on acceptance
7 Open access: articles freely available online
7 High visibility within the fi eld
7 Retaining the copyright to your article
Submit your next manuscript at 7 springeropen.com
Table 4 Impact of the proposed angular offset model
Simulation case IMT-
Advanced
UMi
Proposed
UMi
Performance
Loss
SE CSE SE CSE SE CSE
UMi EBB(bps/Hz) 1.81 0.054 1.45 0.016 -20% -71%
MU-BF(bps/Hz) 2.91 0.088 2.21 0.022 -24% -75%
MU-CoMP(bps/Hz) 4.38 0.135 4.31 0.053 -2% -61%
Note: SE, spectrum efficiency; CSE, cell edge spectrum efficiency; EBB, eigen
value-based beamforming; MU-BF, multiuser beamforming; MU-CoMP,
multiuser CoMP.
Zhang et al. EURASIP Journal on Wireless Communications and Networking 2011, 2011:187
/>Page 12 of 12