Báo cáo hóa học: " Nanoscale chemical and structural study of Cobased FEBID structures by STEM-EELS and HRTEM" pptx
Bạn đang xem bản rút gọn của tài liệu. Xem và tải ngay bản đầy đủ của tài liệu tại đây (779.91 KB, 6 trang )
NANO EXPRESS Open Access
Nanoscale chemical and structural study of Co-
based FEBID structures by STEM-EELS and HRTEM
Rosa Córdoba
1,2
, Rodrigo Fernández-Pacheco
1,3
, Amalio Fernández-Pacheco
1,2
, Alexandre Gloter
3
, César Magén
1,2,4
,
Odile Stéphan
3
, Manuel Ricardo Ibarra
1,2,5
and José María De Teresa
1,2,5*
Abstract
Nanolithography techniques in a scanning electron microscope/focused ion beam are very attractive tools for a
number of synthetic processes, including the fabrication of ferromagnetic nano-objects, with potential applications
in magnetic storage or magnetic sensing. One of the most versatile techniques is the focused electron beam
induced deposition, an efficient method for the production of magnetic structures highly resolved at the
nanometric scale. In this work, this method has been applied to the controlled growth of magnetic nanostructures
using Co
2
(CO)
8
. The chemical and structural properties of these deposits have been studied by electron energy loss
spectroscopy and high-resolution transmission electron microscopy at the nanometric scale. The obtained resul ts
allow us to correlate the chemical and structural properties with the functionality of these magnetic
nanostructures.
Keywords: Co deposits, FEBID, EELS, HRTEM
Background
Despite its great potentiality for the synthesis of well-
controlled metallic functional nanostructures for magne-
totransport applications, the use of focused electron
beam induced deposition [FEBID] [1,2] for such purpose
has been quite limited, mainly due to the low purity of
the deposits grown in this way. Organic precursors are
usually dissociated as the sourceofmetalliccontent,
resulting in a mixture of carbon, metal, and oxidized
material, thus producing inappropriate properties for the
desired application in some cases. In the case of cobalt-
based deposits, Co
2
(CO)
8
is commonly used as the pre-
cursor gas, and the first experiments carried out only
achieved a relatively low Co content [3,4].
As a consequence, different strategies have been tested
to improve the cobalt content, including syst ematic stu-
dies of the inf luence of various deposition parameters
[5-8] or the use of a heated substrate [9-11], which
induces high precursor molecule decomposition and
increases significa ntly the metallic content of these
structures, implying a direct impact in their properties
and their applications [12]. When high beam currents
are used in the FEBID process, the cobalt content of the
deposits can be higher than 90%, as measured by elec-
tron dispersive X-ray spectroscopy [EDS] [7]. It has
been argued that beam-induced heating is one of the
mechanisms responsible for the increase of metallic con-
tent with the electron current [6,7,11]. Beyond the con-
firmation of a mu ch higher Co content in these types of
FEBID deposits by EDS, no study had been perfo rmed
at the nanoscale so far to clarify the nature and electro-
nic state of cobalt inside the metallic deposit.
The aim of this paper is to analyze the valence state
and crystal structure of Co in FEBID deposits so as to
find an expl anation from a che mical and structural
point of view at the micro and nanoscale to the mag-
netic, chemical, and structural properties studied pre-
viously. For that, the analytical techniques developed
and implemented in a (scanning) transmission electron
micro scope [(S)TEM] are the most appropriate tools for
this kind of local observation. For this purpose, electron
energy loss spectroscopy [EELS] is the ideal technique
for analyzing the oxidation state and the chemical envir-
onmentatthelocalscaleofthethreeelementspresent
in the deposits: carbon, oxygen, and cobalt. In a STEM,
EELS spectra can be highly resolved spatially and
* Correspondence:
1
Laboratorio de Microscopías Avanzadas (LMA), Instituto de Nanociencia de
Aragón (INA), Universidad de Zaragoza, Zaragoza, 50018, Spain
Full list of author information is available at the end of the article
Córdoba et al. Nanoscale Research Letters 2011, 6:592
/>© 2011 Córdoba et al; licensee Spri nger. This is an Open Access article distributed under the terms of the Creative Commons
Attribution License ( which permits unrestricted use, distribution, and reproduction in
any medium, provided the original wor k is properly cited .
correlated to their position in the sample by the simul-
taneous acquisition of high-angle annular dark field
[HAADF] images. On the other hand, the analysis of
high-resolution transmission electron microscopy
[HRTEM] images yields the information on the crystal-
line structure at an atomic scale. Both techniques con-
firm the high metallic content of the grown deposits
when a high electron beam current was used.
Methods
In order to study th e influence of a deposition para-
meter such as the electron beam current [ I
e
]inthe
microstructure and com position of the Co-based FEBID
nanodeposits at the nanometer scale, two FEBID mag-
netic nanodeposits were fabricated at room tempe rature
using a field emission gun scanning electron microscope
electron column. The deposits were grown on an oxi-
dized silicon wafer SiO
2
//Si substrate using a working
voltage of 30 kV. In order to compare the effect of the
working current I
e
on the final metallic content, one of
the deposits was grown at a low I
e
(in picoampere
range) and another one at a h igh I
e
(in nanoampere
range). In both cases, the Co
2
(CO)
8
precursor gas was
brought onto the substrate surface by means of a gas
injection system and decomposed under the focused
electron beam. Common parameters for this rectangular
shape Co-based deposition process were the following:
Co nanostructures with dimensions (width × length ×
thickness)=0.5×1.0×0.2μm
3
; Vol/dose = 5 × 10
-4
μm
3
/nC; dwell time = 1 μs; beam overlap = 50%; refresh
time = 0 s; base chamber pressure = 1 × 10
-6
mbar; pro-
cess chamber pressure = 4.3 × 10
-6
mbar; scan strategy
= bottom to top in serpentine mode; vertical distance
between gas injection system needle and substrate = 135
μm; horizontal distance = 50 μm; and pitch = 2.21 nm
(deposit 1, 0.044 nA), 13.16 nm (deposit 2, 2.4 nA).
Following the nanodeposit growth, in situ EDS analy-
sis has been performed on them (deposit 1, Co:C:O
64:17:19; deposit 2, Co:C:O 93:5:2). Prior to the lamella
preparation, the Co deposits were covered with a layer
of FEBID-grown platinum and a second layer of focused
ion beam induced deposition [FIBID]-grown platinum.
This standard procedure was carried out to protect the
deposit from the ion beam damage during lamellae pre-
paration. The in situ lift-out and cross section TEM
lamellas of the Co deposits ha ve been fabricated using
the focused ion beam present in the same equipment.
The final thinning and polishing have been done at an
ion beam acceleration voltage of 5 kV to decrease the
amorphization layer. The final lamella thickness was
lower than 50 nm.
The microstructure of the nanodeposits has been
investigated by HRTEM, whose results were obtained
using an image Cs-aberration-corrected FEI Titan
Cubed at 300 kV (FEI Company, Hillsboro, OR, USA).
The correction of the spherical aberration of the objec-
tive lens leads to a spatial resolution of at least 0.1 nm.
The comp osition of t he nanodeposits at the nan-
ometer scale has been investigated by means of spat ially
resolved chemical analysis, carried out in a STEM VG
HB 501 with a field emission gun operated at 100 kV
and fitted with a Gatan 666 spectrometer (Gatan Inc.,
Pleasanton, CA, USA), optically coupled to a CCD cam-
era. Spatially resolved EELS analysis was used to investi-
gate the metallic cobalt content and the oxidation state
in each deposit. Thus, the electron beam is scanned on
the sample, and a series of spectra is collected for each
point; thus, the obtained spectr a can be compared as a
function of the point of collection in the sample. This
technique is known as spectrum-line or line scan acqui-
sition [13]. For each line scan, spectra were acquired at
steps of 1 nm, and then summed every five spectra for
the calculation of intensity ratios of the Co L
2,3
edge (I
(L
2
)andI(L
3
), respectively). I(L
2
)andI(L
3
) were calcu-
lated as the intensity maximum for each edge. For the
analysis of chemical composition as a function of growth
direction, 200 spectra were acquire d for each point, rea-
ligned, and summed. Principal components analysis
[PCA] was applied to each series of spectra to decrease
experime ntal noise and so as to obtain a better signal to
noise ratio [14]. After applying PCA to each spectrum
for a sing le point, five resulting consecutive spectra of a
line scan were summed, and the intensities of the white
lines were calculated after a power-law removal of the
background and a linear fit below the lines. Therefore,
the chemical state of Co has been first estimated by
means of the intensity ratio of the L
2
and L
3
peaks. The
reference values of I(L
2
)/I(L
3
), 0.31 for metallic cobalt
and 0.27 for cobalt oxide [CoO] [15], were calculated
using the same technique.
On the other hand, the relative O/Co concentrations
were also calculated, integrating their respective signal
intensities from a series of 200 summed EELS spectra at
a single point inside the deposit and dividing by their
respective cross sections. An energy dispersion of 0.2
eV/channel was used for the analysis of the fine struc-
ture for each element, whereas an energy dispersion of
0.5 eV/channel was used f or the quantification of the
relative amounts of each elemen t, with a collection
angle of 24 mrad and a convergence angle of 7.5 mrad.
Both types of experiments had an acquisition time of
0.8 s/spectrum.
Results and discussion
For each metallic deposit, a thorough chemical and
structural analysis at the nanoscale has been performed
by means of E ELS and HRTEM. Together with the che-
mical analysis of the inner part of each deposit, spatially
Córdoba et al. Nanoscale Research Letters 2011, 6:592
/>Page 2 of 6
resolved analysis of the interfaces Pt-Co and SiO
2
-Co
has also been performed to understand the differences
in chemical composition between the core and the
surface.
Deposit 1: deposition parameters: V
e
= 30 kV, I
e
= 0.044
nA
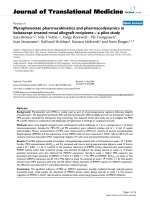
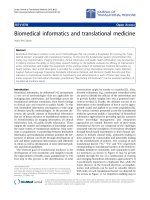
Direct observation of the HRTEM images (Figure 1)
shows that the inside of the deposit is made of polycrys-
talline cobalt nanoparticles embedded in an amorphous
carbon matrix, with approximately 2 to 3 nm of nano-
crystal size. The presence of such small nanoparticles
had been previously reported in the literature [6]. The
HRTEM image is dominated by the amorphous contrast
of the matrix, which gives rise to a fast Fourier trans-
form [FFT] blurred by diffuse scattering. Only weak
reflections associated to metallic hcp Co can be
identified.
Though precise quantitative analysis of these kinds of
granular samples is not fe asible, the presence of metallic
cobalt and cobalt oxide species is evident from the in
situ compositional EDS analysis, where a 19% O content
is observed. On the other hand, to understand the oxi-
dation state of Co, the study of the L
2,3
edge of cobalt
and the K edge of oxygen in the EELS spectra can be
very useful. The obtained spectra can be compared to
EELS data in bibliography to check a shift in energy or
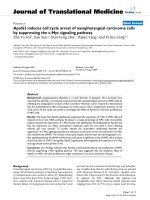
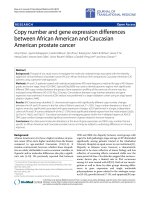
any variation in the shape of the edges. Figure 2a shows
the O K edge of deposit 1 collected at different points
of the sample. Firstly, we confirm the existence of oxy-
gen already in the spectrum collected at the core of the
deposit, as observed by EDS. Furthermore, the presence
of a small pre-peak at 531 eV at the O K edge fine
structure of the deposit and the interface (not ob served
in the SiO
2
spectrum) is a distinctive sign of the pre-
sence of CoO [16]. Also, the analysis of the energy loss
near edge structure [ELNES] of the Co L
2,3
edge can
yield very useful information. Thus, the L
2
/L
3
intensity
ratio between the peaks of the white lines of the cobalt
spectrum gives us an indication of the oxidation state of
Co: when L
2
/L
3
decreases, the oxidation state increase s
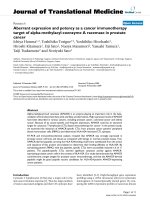
[17]. Figure 3 is a comparison of the white lines of Co
L
2,3
edge for deposits 1 and 2, and references of metallic
cobalt and CoO. The EELS analysis fo r the first deposit
shows the presence of oxidized cobalt, as it can be
inferred from the shape of the L
2,3
edge of the cobalt
Figure 1 HRTEM image and FFT (inset) of deposit 1.
520 540 560 580 600 620
0
10000
20000
30000
40000
50000
I
(
a.u
)
E (eV)
Deposit 1
Interface
SiO
2
a)
520 540 560 580 600
0
10000
20000
30000
40000
50000
60000
70000
80000
I (a.u.)
E
(
eV
)
Deposit 2
Interface
SiO
2
b)
Figure 2 O K edge (532 eV) spectra collected through the
SiO
2
/Co interface. The spectra were collected for deposits 1 (a)
and 2 (b). As the probe scans through the SiO
2
substrate, the
interface between both materials, and finally the inner part of the
deposit, the O K edge changes its shape (apparition of a small pre-
peak, pointed with an arrow), practically disappearing at the inside
of the microstructure for deposit 2.
Córdoba et al. Nanoscale Research Letters 2011, 6:592
/>Page 3 of 6
spectrum, and the low average L
2
/L
3
ratio of around
0.27.
Deposit 2: deposition parameters: V
e
= 30 kV, I
e
= 2.40 nA
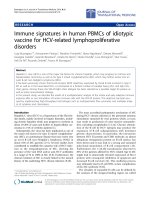
This sample shows a different microstructure and com-
position. The HRTEM image shown in Figure 4 presents
a deposit made of cobalt nanocrystals with 7 to 10 nm
in size. Cobalt grains are more regularly distributed and
compact than in deposit 1. The microcrystalline struc-
ture obtained from t he indexation of the digital diffrac-
togram is compatible with a mixture of Co hexagonal
closed-pack [hcp] and face-centered cubic [fcc] (inset in
Figure 4). Regarding the EELS spectra, the ELNES study
of the cobalt L
2,3
edge yielded homogeneous, regular
spectra with the characteristic white lines of metallic
cobalt (Figure 3). Indeed for metallic Co, the L
3
line
shows a broad asymmetric shape compared to the nar-
rower L
3
line of Co oxide. The metallic character is con-
firmed by the L
2
/L
3
ratioof0.30andnegligibleoxygen
content (O/Co atomic ratio of about 0.04).
On the other hand, Figure 2b shows the EELS spectra
at the O K edge region at the SiO
2
/Co interface. Look-
ing into the fine structure at the interface between the
SiO
2
substrate and the cobalt structure, for the first
nanometers of the growth of the deposit, one can
observe the presence of a pre-peak at 531 eV, which is
characteristic of the presence of CoO. As the probe
scans the inner part of the deposit, the oxygen signal
practically disappears. The presence of the CoO could
be due to the existence of water molecules adsorbed on
the substrate before the start of the FEBID process.
Table 1 is a summary of the preparation conditio ns
for both samples and the quantitative ratio between oxy-
gen and cobalt inside the deposit. The analysis of the
ELNES yields information about the shape and the
intensity of the major features both for Co L
2,3
and O K
edges. In order to estimate the oxidation state of cobalt,
the intensity ratio between the peaks L
2
/L
3
of the Co
L
2,3
edges was analyzed. As expected from previous EDS
analyses, the deposit grown at a high bea m current pre-
sents a lower O/Co ratio and a higher L
2
/L
3
intensities
ratio (close to that of metallic cobalt) than that grown
at a low beam current . Therefore, EELS analysis shows
that deposit 2 presented features characteristic of metal-
lic cobalt, a fact confirmed by the absence of the O K
edge for this particular deposit. On the other hand, oxi-
dized cobalt was found in deposit 1, as it can be inferred
from the shape of the L
2,3
edge of the cobalt spectrum
and the high L
2
/L
3
ratio, as well as from the presence of
a characteristic pre-peak at 531 eV for the O K edge
feature.
However, for deposit 1 HRTEM images revealed the
presence of Co hcp, a fact confirmed by the EELS analy-
sis, which showed minor features of metallic cobalt. To
understand the presence of CoO together with metallic
Co in samples grown at a low beam current, we can
assume that the particles that build up the deposit are
775 780 785 790 795 800
0
1
2
3
4
I
(
a.u.
)
E
(
eV
)
Co
0
Co
II
Deposit 1
Deposit 2
L
3
L
2
Figure 3 Comparison of the EELS spectra.Comparisonofthe
EELS spectra of the Co L
2,3
edge (at an energy of 779 eV) for
deposits 1 and 2, and references for metallic cobalt and cobalt (II).
Figure 4 HRTEM image and FFT (inset) of deposit 2.
Table 1 The preparation conditions for the samples and
quantitative ratio between oxygen and cobalt
Deposit V
e
(kV) I
e
(nA) O/Co I(L
2
)/I(L
3
)
1 30 0.044 0.85 0.27
2 30 2.400 0.04 0.30
Summary of growth parameters, beam energy (V
e
) and current (I
e
), EELS
quantification ratio between oxygen and cobalt and the average L
2
/L
3
intensity ratios in Co L
2,3
edge (see text for details).
Córdoba et al. Nanoscale Research Letters 2011, 6:592
/>Page 4 of 6
so small that most of their atoms are present on the
surface, oxidizing very easily and in a large proportion.
The homogeneity in composition and metallicity along
the direction of deposition has also been studied for
deposit 2, and it is illustrated in Figure 5. A relative
quantification of the elements has been performed a s a
function of the growth direction of the deposit, confirm-
ing the metallic state of cobalt. The ratio O/Co is very
low, lower than 0.1 all along the deposit. Only the first
nanometers of d eposition seem to be partially oxidized.
This is in good agreement with the plotting of the L
2
/L
3
intensity ratios along the deposit, which shows metallic
ratios all through the deposit except in the early stages
of growth where the intensity ratio falls down to 0.27
(Figure 5b).
Summarizing, in the growth conditions chosen, which
are the same as those used in our previous publications
[7,18,19], electron beam current plays a key role in the
purity of the metallic content, thus being one of the
driving force to produce cobalt in metallic state. The
depo sits grown at a high beam current have high cobalt
content, whereas those grown at low beam currents
have low cobalt content, where a significant amount of
oxidized cobalt together with metallic cobalt has been
detected. However, the FEBID process involves complex
phenomena, and other relevant mechanisms have been
also highlighted in literature using different deposition
parameters. For example, the influence of autocatalysis
[20] and the influenc e of the dwell time in the fin al
composition [8] have been put forward. Thus, given a
certain cobalt structure geometry, the final cobalt con-
tent will be determined by the set of the growth para-
meters (precursor flux, dwell time, refresh time, beam
current) and not only by the beam current.
The strong differences in the micros tructure and che-
mical nature of the deposits found in this systematic
study might explain the different transport and magnetic
properties reported in the literature for these Co-based
nanostructures grown by FEBID. Thu s, in the same
deposition conditions chosen in the literature [7,18,19],
samples grown at a high beam current show metallic
electrical transport and ferromagnetic behavior [18,19]
in sharp contr ast with the semiconducting behavior
exhibited by deposits grown at a low beam current [7].
Conclusions
A thorough HRTEM and STEM-EELS study has been
performed to investigate the microstructure of Co-based
FEBID nanostructures grown using the organometallic
precursor Co
2
(CO)
8
. In the same deposition conditions
chosen in the literature [7,18,18], deposits grown at a
high electron-beam current are formed by large cobalt
nanocrystals, present more than 96% of metallic cobalt
content, and exhibit metallic resistivity and ferromag-
netic properties. Conversely, deposits grown at a low
electron beam current present small isolated cobalt
nanocrystals (5 to 7 nm in size) embedded in an amor-
phous carbon matrix with less than 80% of metallic
cobalt content and semiconducting resistivity. In all
cases, the high metallic content of these deposits pro-
duces fascinating magnetic properties, making them
strong candidates in magnetic storage or magnetic sen-
sing applications.
Acknowledgements
The authors acknowledge the Spanish Ministry of Science for the financial
support through Project No. MAT2008-06567-C02, including FEDER funding,
the Aragon Regional Government Grant No. E26. RFP acknowledges F. De la
Peña, K. March, and R. Arenal for the scientific discussions. RFP also
acknowledges the Spanish Ministry of Science for the funding through a
postdoctoral contract.
Author details
1
Laboratorio de Microscopías Avanzadas (LMA), Instituto de Nanociencia de
Aragón (INA), Universidad de Zaragoza, Zaragoza, 50018, Spain
2
Departamento de Física de la Materia Condensada, Universidad de
a)
Figure 5 Reference image and profiles of relative
concentration. (a) STEM-HAADF reference image of deposit 2. (b)
Profiles of relative concentration of the O/Co and L
2
/L
3
intensity
ratios along the growth direction (blue line).
Córdoba et al. Nanoscale Research Letters 2011, 6:592
/>Page 5 of 6
Zaragoza, Facultad de Ciencias, Zaragoza, 50009, Spain
3
STEM Group-
Laboratoire de Physique des Solides (CNRS-UMR 8502), Université Paris-Sud,
Bat. 510, Orsay Cedex, 91405, France
4
Fundación ARAID, Zaragoza, 50004,
Spain
5
Instituto de Ciencia de Materiales de Aragón (ICMA), CSIC-Universidad
de Zaragoza, Facultad de Ciencias, Zaragoza, 50009, Spain
Authors’ contributions
JMDT and OS conceived the collaborative study and coordinated it. RC, AFP,
JMDT, and MRI defined the geometry and the composition of the deposits.
RC grew the deposits and carried out the TEM lamella preparation. RFP, AG,
and OS performed the STEM and EELS characterization. CM and RC carried
out the HRTEM characterization. All the authors discussed the results,
contributed to the manuscript, and approved its final version.
Competing interests
The authors declare that they have no competing interests.
Received: 21 July 2011 Accepted: 15 November 2011
Published: 15 November 2011
References
1. Van Dorp WF, Hagen CW: A critical literature review of focused electron
beam induced deposition. J App Phys 2008, 104:081301-081342.
2. Utke I, Hoffmann P, Melngailis J: Gas assisted focused electron beam and
ion beam processing and fabrication. J Sci Vac Technol B 2008,
26:1197-1276.
3. Utke I, Hoffmann P, Berger R, Scandella L: High resolution magnetic force
microscopy supertips produced by focused electron beam induced
deposition. App Phys Lett 2002, 80:4792-4794.
4. Lau YM, Chee PC, Thong JTL, Ng V: Properties and applications of cobalt-
based material produced by electron-beam-induced deposition. J Vac Sci
Technol A 2002, 20:1295-1302.
5. Utke I, Bret T, Laub D, Buffat Ph, Scandella L, Hoffmann P: Thermal effects
during focused electron beam induced deposition of nanocomposite
magnetic-cobalt-containing tips. Microelectron Eng 2004, 73:553-558.
6. Utke I, Michler J, Gasser P, Santschi C, Laub D, Cantoni M, Buffat P A, Jiao C,
Hoffmann P: Cross-sections investigations of compositions and sub-
structures of tips obtained by focused electron beam induced
deposition. Adv Eng Mater 2005, 7:323-331.
7. Fernández-Pacheco A, De Teresa JM, Córdoba R, Ibarra MR:
Magnetotransport properties of high-quality cobalt nanowires grown by
focused-electron-beam-induced deposition. J Phys D Appl Phys 2009,
42:055005-055010.
8. Bernau L, Gabureac M, Erni R, Utke I: Tunable nanosynthesis of composite
materials by electron-impact reaction. Angew Chem 2010, 122:9064-9068.
9. Córdoba R, Sesé J, De Teresa JM, Ibarra MR: High purity cobalt
nanosctructures grown by focused-electron-beam-induced deposition at
low current. Microel Eng 2010, 87:1550-1553.
10. Mulders JJL, Belova LM, Riazanova A: Electron beam induced deposition at
elevated temperatures: compositional changes and purity improvement.
Nanotechnol 2011, 22:055302-055308.
11. Belova LM, Dahlberg ED, Riazanova A, Mulders JJL, Christophersen C,
Eckert J: Rapid electron beam assisted patterning of pure cobalt at
elevated temperatures via seeded growth. Nanotechnol 2011,
22:145305-145310.
12. Gabureac M, Bernau L, Utke I, Boero G: Granular Co-C nano-Hall sensors
by focused-beam-induced deposition. Nanotechnol 2010,
21:115003-115007.
13. Jeanguillaume C, Colliex C: Spectrum-image: the next step in EELS digital
acquisition and processing. Ultramicroscopy 1989, 28:252-257.
14. Trebbia P, Bonnet N: EELS elemental mapping with unconventional
methods. 1. Theoretical basis: image-analysis with multivariate-statistics
and entropy concepts. Ultramicroscopy 1990,
34:165-178.
15. A Gloter and O Stéphan, private communication. .
16. Mitterbauer C, Kothleitner G, Grogger W, Zandbergen H, Freitag B,
Tiemeijer P, Hofer F: Electron energy-loss near-edge structures of 3d
transition metal oxides recorded at high-energy resolution.
Ultramicroscopy 2003, 96:469-480.
17. Golla-Schindler U, Benner G, Putnis A: Laterally resolved EELS for ELNES
mapping of the Fe L2,3- and O K-edge. Ultramicroscopy 2003, 96:573-582.
18. Fernández-Pacheco A, De Teresa JM, Córdoba R, Ibarra MR, Petit D,
Read DE, O’Brien L, Lewis ER, Zeng HT, Cowburn RP: Domain wall conduit
behavior in cobalt nanowires grown by focused-electron-beam-induced
deposition. App Phys Lett 2009, 94:192509-192511.
19. Fernández-Pacheco A, De Teresa JM, Szkudlarek A, Córdoba R, Ibarra MR,
Petit D, O’Brien L, Zeng HT, Lewis ER, Read DE, Cowburn RP: Magnetization
reversal in individual Co micro- and nano-wires grown by focused-
electron-beam-induced deposition. Nanotechnol 2009, 20:475704-475712.
20. Utke I, Golzhauser A, Angew : Small, minimally invasive, direct: electrons
induce local reactions of adsorbed functional molecules on the
nanoscale. Chem Int Ed 2010, 49:9328-9330.
doi:10.1186/1556-276X-6-592
Cite this article as: Córdoba et al.: Nanoscale chemical and structural
study of Co-based FEBID structures by STEM-EELS and HRTEM.
Nanoscale Research Letters 2011 6:592.
Submit your manuscript to a
journal and benefi t from:
7 Convenient online submission
7 Rigorous peer review
7 Immediate publication on acceptance
7 Open access: articles freely available online
7 High visibility within the fi eld
7 Retaining the copyright to your article
Submit your next manuscript at 7 springeropen.com
Córdoba et al. Nanoscale Research Letters 2011, 6:592
/>Page 6 of 6