Báo cáo hóa học: " Texture-adaptive image colorization framework" potx
Bạn đang xem bản rút gọn của tài liệu. Xem và tải ngay bản đầy đủ của tài liệu tại đây (15.75 MB, 15 trang )
Kawulok and Smolka EURASIP Journal on Advances in Signal Processing 2011, 2011:99
/>
RESEARCH
Open Access
Texture-adaptive image colorization framework
Michal Kawulok* and Bogdan Smolka
Abstract
In this paper we present how to exploit the textural information to improve scribble-based image colorization.
Although many methods have been already proposed for coloring grayscale images based on a set of color
scribbles inserted by a user, very few of them take into account textural properties. We demonstrate that the
textural information can be extremely helpful for this purpose and it may greatly simplify the colorization process.
First, based on a scribbled image we determine the most discriminative textural features using linear discriminant
analysis. This makes it possible to boost the initial scribbles by adjoining the regions having similar textural
properties. After that, we determine the color propagation paths and compute chrominance of every pixel in the
image. For the propagation process we used two competing path cost metrics which are dynamically selected for
every scribble. Using these metrics it is possible to efficiently propagate chrominance both over smooth and rough
image regions. Texture-based scribble boosting followed by competitive color propagation is the main
contribution of the work reported here. Extensive experimental validation documented in this paper demonstrates
that image colorization can be substantially improved using the proposed technique.
Keywords: image colorization, textural properties, distance transform, linear discriminant analysis
1 Introduction
Color images are usually perceived as definitely more
attractive and appealing than their grayscale versions.
Therefore, a lot of efforts are often engaged into image
colorization, which is a process of adding colors to
monochromatic images or videos. First attempts in
1920s were fully manual, performed for every individual
shot on the film print. The colorization process was
computerized in 1970s by Wilson Markle and Christian
Portilla. Its most famous application was colorization of
the Apollo mission footage. The first well-known monochrome film colorization was that of Casablanca in
1980s. Although it was widely criticized at that time,
colorization of old movies appeared desired in the mass
culture world and many films have been converted into
color versions since then. Apart from enhancing visual
attractiveness of monochrome photographs or videos
whose color versions are not available, image colorization has found many other applications like marking
regions of interest in medical images, interior design, or
make-up simulators.
* Correspondence:
Faculty of Automatic Control, Electronics and Computer Science, Silesian
University of Technology, Akademicka 16, 44-100 Gliwice, Poland
Using the recent methods an image can be colorized
based on color scribbles which are propagated over the
whole image surface. Although the existing techniques
work well for colorizing plain areas, they fail for rough,
textured regions. This is because the color is propagated
from the scribbles following an assumption that pixels
of similar luminance should have similar chrominance.
This explains why the existing algorithms and available
commercial solutions occur to be inefficient when a
highly textured regions are to be colorized. In some
cases, even large image regions expected to have uniform chrominance should be precisely annotated with
the scribbles to avoid artifacts. The final colorization
result often depends on the scribbles’ shape and exact
position. Hence, although the image is automatically
colorized after adding the scribbles, drawing them is
often a tedious task itself.
In the work reported here we have focused on how to
reduce density and precision of the scribbles, in order to
simplify the colorization process. More specifically, we
have investigated how the textural information can be
exploited to achieve this goal. As a result, based on our
earlier works [1,2] we propose a double-level method,
consisting of scribble boosting followed by surface-specific competitive color propagation. A very important
property of the method is that at both levels it is
© 2011 Kawulok and Smolka; licensee Springer. This is an Open Access article distributed under the terms of the Creative Commons
Attribution License ( which permits unrestricted use, distribution, and reproduction in
any medium, provided the original work is properly cited.
Kawulok and Smolka EURASIP Journal on Advances in Signal Processing 2011, 2011:99
/>
adapted to the textures which appear in the image and
are marked by the scribbles.
The first-level works by extracting the discriminative
textural features (DTF) which make distinction between
the textures covered by different scribbles [1]. DTF are
obtained using linear discriminant analysis (LDA) performed over simple image statistics computed locally.
After that, the scribbles are boosted by adjoining the
regions which have similar textural features. DTF are
determined independently for every image to maximize
the discriminative power between the textures covered
by different scribbles. This makes the method adaptive
to every scribbled image.
At the second level, the boosted scribbles serve as the
source for the color propagation. The propagation paths
are obtained using Dijkstra algorithm by minimizing
local pixel distance integrated along the path. In conventional techniques [3] the local pixel distance is proportional to a luminance difference. This works
correctly for colorization of plain areas, but fails for textured surface. Therefore, we adapt the distance to the
textural properties of the region where the scribble is
placed. Our experiments indicated that this double-level
approach make it possible to limit the necessary human
assistance and facilitates the colorization process.
The paper is organized as follows. In Section 2, a general literature overview is presented. Then, in Section 3,
the baseline techniques used in the proposed method
are outlined. The main contribution of the reported
work is presented in the following two sections. In Section 4, competitive color propagation is described, and
in Section 5, we present the texture-based scribble
boosting technique. Finally, the obtained colorization
results are shown and discussed in Section 6, and the
conclusions are presented in Section 7.
2 Related work
The first method of adding colors to the image was proposed by Gonzalez and Woods [4] in a form of luminance keying. It operates based on a function which
maps every luminance level into color space. Obviously,
the whole color space cannot be covered in this way
without increasing manual input from the user. Welsh
et al. [5] proposed a method of color transfer which colorizes a grayscale image based on a given reference
color image. This method matches pixels based on their
luminance and standard deviation in 5 × 5 neighborhood, which serves as a basic textural feature. Every
pixel in the colorized image is assigned the best matching pixel from the source image and its chrominance is
transferred. The matching process can be performed
automatically, but it gives better results with user assistance. This method was improved by Lipowezky [6],
who proposed to extend the textural features.
Page 2 of 15
Sykora et al. [7] proposed an unsupervised method for
image colorization by example, which at first matches
similar image feature points to predict their color. After
that, the color is spread all over the image by probabilistic relaxation. Horiuchi [8] proposed an iterative probabilistic relaxation, in which a user defines colors for
selected grayscale values, based on which the image is
colorized. Furthermore, Horiuchi [9] proposed a method
for texture colorization which defines pixel similarity
based on their Euclidean distance and difference in
luminance values. Hence, even if two neighboring pixels
differ much in luminance, which is often observed for
textured regions, their similarity will be high due to low
Euclidean distance. This approach works better for colorizing textures than the earlier methods, but it does
not perform any analysis of textural features.
Many methods are focused on using prior information
delivered by a user in a form of manually added color
scribbles. Levin et al. [10] formulated an optimization
problem based on an assumption that neighboring pixels
of similar intensity should have similar color values
under the limitation that the colors indicated in the
scribbles remain the same. Yatziv and Sapiro [3] proposed a method for determining propagation paths in the
image by minimizing geodesic distances from every scribble. Based on the distances from each scribble, pixel color
is obtained by blending scribble chrominances. In other
works, the color is also propagated from scribbles with
probabilistic distance transform [11], using cellular automaton [12] or by random walks with restart [13].
During our earlier research, we also exploited scribblebased image colorization. First, we proposed modified
color propagation paths and we improved the chrominance blending procedure [2]. This method was suitable
for colorizing the details having strong gradients, but still
required high scribble coverage. Later, we proposed to
use textural features as a domain for color propagation
[1], which made it possible to colorize larger areas using
small scribble coverage. However, the main drawback of
that approach lies in the precision. At the boundaries of
regions having different texture, the pixels were often
misclassified which resulted in observing unnatural artifacts. In the work reported here, we have modified the
procedure for obtaining the textural features and proposed the scribble boosting technique, which eliminates
the main drawbacks of these earlier algorithms.
3 Color propagation paths and chrominance
blending
In order to colorize a monochromatic image Y based on
a set of n initial scribbles {Si}, i = 1,..., n, frst it is necessary to determine the propagation paths from each
scribble to every pixel in the image. A path from a pixel
x to another pixel y is defined as a discrete function p
Kawulok and Smolka EURASIP Journal on Advances in Signal Processing 2011, 2011:99
/>
(t): [0, l] ® Z2, which maps a position t in the path to
the pixel coordinate. The position is an integer ranging
from 0 for the path beginning (p(0) = x) to l for its end
(p(l) = y). Also, if p(i) = a and p(i+1) = b, then a and b
are neighboring pixels. The paths should be determined,
so as to minimize a number of expected chrominance
changes along the path. Hence, in the image they should
follow the objects having uniform chrominance. Also,
any two pixels inside a region that is supposed to have
uniform chrominance are expected to be connected
with a path which should not leave this region.
3.1 Propagation paths optimization
The propagation paths from a scribble to every pixel are
determined by minimizing a total path cost:
l−1
ρ{p(i), p(i + 1)},
C(p) =
(1)
i=0
where r is a local dissimilarity measure between two
neighboring pixels and l is the path length. The minimization is performed using Dijkstra algorithm [14] in the
following way:
1. A priority queue Q is initialized with all scribbled
pixels.
2. Distance array D which covers all image pixels is
created. Every pixel q Ỵ Q is assigned a zero distance (D(q Ỵ Q) = 0) and all remaining pixels are
initialized with an infinite distance.
3. A pixel q, for which the distance D(q) is minimal
in Q, is popped from Q and for each of its 7 neighbors N i (q) (excluding the source) two actions are
performed:
(a) Local distance r(q, s) between q and its
neighbor s is calculated to find a total cost of ps,
i.e., C(ps) = C(q) + r(q, s).
(b) If C(ps)
with a new path ps.
4. If the queue is empty, the algorithm terminates.
Otherwise, step (3) is repeated.
The path route depends mainly on how the local costs
are computed. Following the conventional approach [3],
the local cost is obtained by projecting the luminance
gradient onto a line, tangent to the path direction. This
means that the cost is proportional to the difference in
luminance between the neighboring pixels.
3.2 Chrominance blending
Chrominance of each pixel is determined based on the
propagation paths from every scribble. Its value is computed as a weighted mean of scribbles’ colors with the
Page 3 of 15
weights obtained as a function of the total path cost.
Usually two or three strongest components are taken
into account, which provides a good visual effect of
smooth color transitions. The final color value v(x) of a
pixel x is obtained as
v(x) = Y(x)
i vi wi (x)
i wi (x)
(2)
where vi is the chrominance of an ith scribble and wi
(x) is its weight in pixel x. We use YCr Cb color space
and calculate color values separately for Cr and Cb channels. The weights are obtained as
wi (x) = (Ci (x) + 1)−2 ,
(3)
where Ci(x) is the total path cost from ith scribble to
pixel x. In our earlier work [2], we justify that it is beneficial to use modified cost Cb (x) for the blending
i
instead of the original path cost, computed as
Cb (x) =
i
l
Ci (x) + αl,
σi
(4)
where si is ith scribble strength normalized from 0 to
1, a is a topological penalty, and r indicates the original
path cost. By default the topological penalty was set to
a = 0.02 and the scribble strength si = 1; this parameter
gives the user possibility to indicate how far the scribble
is supposed to propagate. This is particularly important
when an image is intended to be colorized using few
scribbles. In such a case the scribble strength should be
decreased for the scribbles which indicate tiny details
and therefore should not propagate much.
4 Competitive propagation paths
Yatziv [3] in his method determines the path by minimizing integrated luminance gradient in the path direction. This is an interesting approach, appropriate to
determine paths supposed to cross easily plain areas
without strong edges. It is suitable if luminance difference is proportional to probability of chrominance
change. This approach is similar to a traveler who
intends to cross an island with beaches along the coast
and mountains in its interior part. He would choose a
longer way along the coast rather than a shorter one
across the mountains. However, if he wants to move
between two mountains, he may prefer to head for the
coast, follow the beach to get as close the second mountain as possible, and then walk inside again. This is reasonable, but for the colorization purposes we would
prefer not to leave the rough area as long as it is
expected to have uniform chrominance. Here, the
roughness would mean a texture with many edges
which would generate a very high cost of crossing it
Kawulok and Smolka EURASIP Journal on Advances in Signal Processing 2011, 2011:99
/>
using the conventional methods. In practice, this means
that the scribbles would not propagate well in such a
region, and as a result it must be annotated with many
scribbles.
When a scribble is placed in rough area, it is better to
follow high gradients without much cost. It is similar to
the intelligent scissors [15] for interactive image segmentation. This algorithm joins a starting point and a
mouse pointer with a path, which is sticky to the strongest gradient. Local cost between two neighboring pixels
depends on the Laplacian zero-crossings, gradient magnitude and direction. Basically, the cost is lower if the
path follows the gradient direction and the gradient
magnitude of the path pixels is high.
4.1 Local distance metrics
Following the presented analysis, we identified two ways
of calculating the local distances which are individually
appropriate for homogenous and highly textured
regions. We called them respectively: plain distance and
gradient-sticky distance.
Plain distance is similar to those used in other wellestablished methods. Its aim is to minimize intensity
changes along the path and it is calculated as:
ρp (x, y) = 1 − exp(−|Y(x) − Y(y)|/hp ),
(5)
where hp is a normalization factor, set experimentally
to 30. This distance is suitable for determining paths in
uniform regions whose texture is not characterized by
strong gradients.
However, for objects whose texture is not smooth, the
paths cannot be found correctly in this way.
a)
b)
Page 4 of 15
Furthermore, the distance grows rapidly when high gradients are crossed, which affects the result of chrominance blending. Therefore, in such cases the distance
should be inversely proportional to the gradient
strength, so that the path is sticky to high gradients.
Hence, we take into account the propagation direction
to decrease the cost if the path follows an edge. We
defne a gradient-sticky distance as:
ρg (x, y) = 1 − exp
−1
,
hg |∇Y(y)|(cos β + 1)
(6)
where b is an angle between the gradient vector in y
and propagation direction from x to y. Factor hg was set
to 0.5.
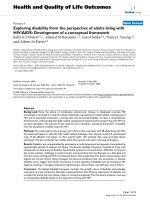
Propagation paths obtained by minimizing these two
distances integrated along the path, as well as the conventional distance metric defined by Yatziv [3], are presented in Figures 1 and 2. Figure 1 shows the paths
propagated from scribbles placed over highly textured
regions (hair and tree). In the background, a gradient
magnitude image is presented for the upper row and
original image for the tree in the bottom row. It may be
noticed that in (c) the paths are sticky to the gradient
directions, while in (a, b) they prefer smooth areas.
Moreover, in the bottom row (a, b) the left part of the
tree is accessed by the paths which first leave the tree
region, go round the tree through the sky region, and
enter the tree region again from the opposite side. This
is a good illustration of the traveler’s problem described
at the beginning of this section. As a result, the left
region of the tree would be influenced by scribbles
annotated over the sky.
c)
Figure 1 Propagation paths determined using distance defined by Yatziv [3](a), plain distance (b), and gradient-sticky distance (c).
Kawulok and Smolka EURASIP Journal on Advances in Signal Processing 2011, 2011:99
/>
a)
b)
Page 5 of 15
c)
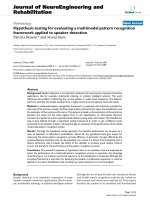
C(p) = 0.35
C(p) = 4.6
C(p) = 1.14
C(p) = 0.16
C(p) = 1.38
C(p) = 1.53
Figure 2 A single point reached by paths obtained with distance defined by Yatziv [3](a), plain distance (b), and gradient-sticky
distance (c).
Figure 2 presents propagation paths to a selected pixel
of a human hair, reached from two different scribbles
added to hair and skin region. The total path cost is
depicted in this figure. The path leading from the hair
scribble should not leave the hair region which is
obtained only using the gradient-sticky distance (c).
However, the path leading from the skin scribble is correct only for plain distances (a, b). In case of the gradient-sticky distance, the path crosses an eye which is
definitely incorrect.
This example clearly shows that the distance type used
for determining a path should depend on the properties
of a texture which is to be colorized. This choice may
be left to a user who adds the scribbles. However, in
our method we intend to decrease the time-consuming
interaction, so we provide automatic selection following
a competitive approach. For every scribble we start the
propagation algorithm with both types of paths and for
each pixel we select that kind of a path, for which the
distance is smaller. Hence, for harsh surfaces the gradient paths usually prevail, while on smooth areas the
plain paths propagate better. This selection can be done
either separately for every starting pixel or for a whole
scribble. In our experiments, we found the latter
approach performing better.
Competitive propagation can be effective only if the
competing metrics are well balanced. Otherwise, one
would dominate the other. Exponential distance definition in (5) and (6) normalizes plain and gradient-sticky
distances. A proper balance between them is achieved
using appropriate values of the normalization factors hg
and h p . It is worth observing that the propagation is
performed for small values of the local distances, where
the dependence is close to linear.
5 Texture-based image colorization
Competitive propagation paths presented in Section 4
allow for efficient colorization despite of strong
gradients that are often observed in textured regions.
This makes it possible to colorize such image areas
using just a few scribbles, similarly as in case of smooth
regions. However, this technique does not extract the
underlying textural features, so the propagation paths
can easily cross boundaries between different textures. It
is worth noting that regions of uniform texture quite
often have similar chrominance, and chrominance
boundaries may be determined based on the textural
features. Unfortunately, this is neglected by many existing techniques, which assume that the chrominance
boundaries are correlated exclusively with the luminance
changes. Following this assumption, the raw pixel values
in luminance channel are used as the color propagation
domain [3,16].
In this section, we focus on how to exploit the textural features for image colorization. At first, we determine which textural features are most discriminating
between the scribbles to obtain appropriate color propagation domain, adapted to the specific conditions. Subsequently, we allow the scribbles to conquer the regions
of similar texture, without defining the exact color
boundaries (the precision at the boundaries is unsatisfactory). After this procedure, which we call scribble
boosting, we perform the competitive propagation as
described earlier in this paper.
5.1 Discriminative textural features
Various methods have been reported on texture-based
image segmentation [17], including Haralick features
[18], local binary patterns [19], wavelets [20], or filter
banks [21]. It is worth noting that the considered case is
not identical to the widely investigated segmentation
task. Here, the aim is to define a suitable domain for
color propagation. Among the existing colorization
methods, textural features have been exploited for color
transfer [5,6]. However, only simple texture descriptors
are used there, which may be helpful in some cases, but
Kawulok and Smolka EURASIP Journal on Advances in Signal Processing 2011, 2011:99
/>
Page 6 of 15
does not guarantee the distinctiveness between the
regions marked with different scribbles.
The color propagation domain should induce low
costs between pixels belonging to a single scribble. On
the other hand, the cost should be high, when the path
crosses a boundary between areas marked with different
scribbles. It is therefore important to find such image
properties that would be uniform within a single scribble and different between the scribbles. In the work
reported here, we select the distinctive properties for
every scribbled image using LDA. It is performed over a
set of simple image features extracted from pixels which
belong to the scribbles. In this way we obtain the color
propagation domain which is dynamically conformed to
every specific case.
five kernel sizes ranging from 3 × 3 to 11 × 11. Hence,
every pixel x is described by an M-dimensional basic
feature vector ux (M = 23 in the presented case). The
feature vectors of the scribble pixels are subsequently
subject to LDA. Every scribble forms a separate class, so
the analysis determines the most discriminative features
between the scribbles for a given image. The feature
vectors (v) obtained using LDA are further termed discriminative textural features (DTF). The distance
between any two feature vectors v1 and v2 in the DTF
space is computed as:
5.1.1 Linear discriminant analysis
During our experiments, we observed that for the
majority of analyzed cases it is sufficient to reduce the
dimensionality of DTF vectors to m = 2. Also, we limit
the number of the input vectors in each class to 100 so
as to reduce the LDA training time. If a scribble contains more pixels, 100 of them are randomly selected.
We have not observed any noticeable difference in the
outcome compared to using all the scribble pixels, while
the training time is definitely shorter.
Linear discriminant analysis [22] is a supervised statistical feature extraction method frequently used in
machine learning. It finds a subspace defined by the
most discriminative directions within a given training
set of M-dimensional vectors classified into K classes.
The analysis is performed first by computing two covariance matrices: within-class scatter matrix
T
SW = K
uk ∈Ki (uk − μi )(uk − μi ) , and betweeni=1
class scatter matrix SB = K (μi − μ)(μi − μ)T , where
i=1
μ is a mean vector of the training set and μi is a mean
vector of the ith class (termed Ki ). Subsequently, the
matrix S = S−1 SB is subjected to the eigen decomposiW
tion S = FΛFT, where Λ = diag(l1,..., lM) is the matrix
with the ordered eigenvalues along the diagonal and F
= [u 1 |... |u M ] is the matrix with the correspondingly
ordered eigenvectors as columns. The eigenvectors form
the orthogonal basis of the feature space. Originally, the
feature space has M dimensions, but only those associated with the highest eigenvalues have strong discriminative power, while the remaining can be rejected. In
this way the dimensionality is reduced from M to m,
where m
the feature vectors are obtained by projecting the original vectors u onto the feature space: ν = F T u. The
similarity between the feature vectors is computed based
on their Euclidean distance in the feature space.
5.1.2 LDA for texture analysis
In order to determine the discriminative features, first
we calculate basic image features from every pixel. They
are composed of: (a) luminance, (b) gradient intensity,
(c) local binary pattern, (d) mean value and (e) standard
deviation computed in many kernels of different size, (f)
the difference between maximum and minimum values
in the kernels, and (g) the pixel value in the median filtered image. The basic features (d)-(g) were obtained for
m
(v1i − v2i )2 .
dDTF =
(7)
i=1
5.2 DTF-based color propagation domain
After training, a projection matrix F is obtained and
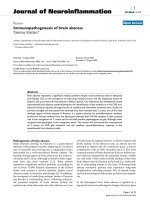
every pixel in the image is projected onto m-dimensional DTF space. Examples of three scribbled images
and their projection onto three leading LDA components are shown in Figure 3. They represent the most
discriminative textural features and the eigenvalues associated with them are given underneath. It may be
observed that these projections differentiate well
between the areas marked with the scribbles. Also, 10
highest eigenvalues obtained for every image are plotted
in the figure (rightmost column). The values on the vertical axis are given in relation to the highest eigenvalue.
Figure 4 shows four images annotated with scribbles.
The luminance of the pixels scaled from 0 to 100 is
shown in (b) on the horizontal axis, while the vertical
axis was added only to differentiate between the scribbles. Different colors (red, blue, and green) indicate pixels from particular scribbles. The scribble pixels
projected onto 2D DTF subspace are shown in (c). For
the image in the first row, the “forest” pixels (F–blue)
are generally darker than the “sky” pixels (S–red), but
the luminance alone is not a discriminative feature here.
However, two classes are well separated after projecting
onto the DTF subspace, and the same observation concerns the flower image. Two subsequent images were
annotated with scribbles of three various colors, each of
them being a separate class. “Sky” (S–green) and “grass”
Kawulok and Smolka EURASIP Journal on Advances in Signal Processing 2011, 2011:99
/>
Page 7 of 15
1
0.8
0.6
0.4
02
0.2
0
a)
λ1 = 1361
λ2 = 946
1 2 3 4 5 6 7 8 9 10
Eigenvalue
λ3 = 263
1
0.8
0.6
0.4
0.2
02
0
b)
λ1 = 758
λ2 = 569
λ3 = 335
1 2 3 4 5 6 7 8 9 10
Eigenvalue
1
0.8
0.6
0.4
0.2
02
0
c)
λ1 = 965
λ2 = 727
1 2 3 4 5 6 7 8 9 10
Eigenvalue
λ3 = 488
Figure 3 Projections of scribbled images onto the leading LDA components, and 10 highest eigenvalues.
0
20
40
60
Luminance
80
100
S - sky scribble
F - forest scribble
B
F
0
20
40
60
Luminance
80
100
B - background scribble
F - flower scribble
S
T
G
0
20
40
60
Luminance
80
100
S - sky scribble
T - tree scribble
G - grass scribble
B
S
H
0
20
40
60
Luminance
80
100
B - background scribble
S - skin scribble
H - hair scribble
Figure 4 Scribble pixels (a) projected onto luminance (b) and 2D LDA (c) subspaces.
Second DTF dimension
S
F
Second DTF dimension
c)
40
20
0
-20
-40
-30
-15
0
15
30
First DTF dimension
50
0
-50
-100
-100
0
100 200
First DTF dimension
Second DTF dimension
b)
Second DTF dimension
a)
200
100
0
-100
-100
0
100 200
First DTF dimension
50
0
-50
-100
-150
-400
-200
0
200 400
First DTF dimension
Kawulok and Smolka EURASIP Journal on Advances in Signal Processing 2011, 2011:99
/>
(G–red) scribbles in the tree image are overlapping each
other even in the DTF subspace, but they both are well
separated from the tree class. Although the achieved
result is not perfect, it appeared sufficient to colorize
the image properly as presented later in this section. For
the last image, the three classes, i.e., “skin” (S–blue),
“background” (B–green), and “hair” (H–red) are well
separated.
For every scribble, a mean DTF feature vector is
obtained and its DTF-distance dDTF (7) to every pixel in
the image is computed in the DTF space. In this way, a
DTF-distance map di is obtained for every ith scribble.
Examples of the DTF-distance maps generated for two
images are presented in Figure 5. Darker shade indicates
smaller distance, i.e., greater similarity to the source
scribble. It is clear from the Figure that the DTF-distance maps better differentiate between the scribbled
regions than the original images themselves.
Potentially, the distance maps could be used directly
for chrominance blending. In such a case, to obtain an
ith weight for a pixel x, the distance in DTF space di(x)
could be used instead of the total path cost Ci(x) in (3).
However, such approach does not beneft from pixels
location and their geometrical distance from the scribbles. Also, continuity of the regions would not be guaranteed in this way. The DTF-distance maps can be used
directly for some other applications, e.g., color transfer
or video colorization, but here we found it better to
treat them as a domain for color propagation. The local
cost r from pixel x to y equals the y pixel value in the
DTF-distance map (r(x, y) = di(y)). For example, it can
be concluded from Figure 5 (grass) that the upper-right
sky region is texturally similar to the grass. This results
from the overlapping in the DTF subspace observed earlier in Figure 4. Fortunately, these regions are located far
Scribbled image
Page 8 of 15
from each other, which can be utilized using the propagation strategy. In this way these regions can be properly colorized, which would not be achieved using the
distance maps directly for blending.
The propagation paths are determined so that they
follow the texture similar to that covered by the source
scribble. This is contrary to FIVC approach, with which
the path is determined to minimize the luminance
changes. An example of a difference between these two
alternative approaches is given in Figure 6. It shows the
propagation paths leading from a scribble to a selected
pixel obtained using two methods. The paths determined using our method (b) do not leave the striped
area, which makes it possible to colorize the image correctly (c). The paths obtained using a conventional
method (d) show that the textural information is not
taken into account during the propagation. This results
in wrong colorization outcomes (e).
5.3 Scribble boosting
The method presented earlier in this section makes it
possible to implement a complete colorization system;
however, it has a serious drawback concerned with the
precision. Although the regions having different texture
are properly classified and separated in the DTF subspace, pixels lying at the region boundaries may be misclassified. The size of such misclassified areas depends
on the kernel dimensions used for obtaining the basic
textural features. This results in observing small halos at
the region boundaries, which decreases the reality of the
colorized images. Examples of these artifacts are presented in Figure 7.
If an image is densely annotated with scribbles, such
effects are usually not observed using conventional
methods. Following this observation, we decided to use
DTF-distance from the scribbles marked over:
(sky)
(volcano)
(ground)
(grass)
Figure 5 Examples of DTF-distance maps obtained for scribbled images.
(tree)
(sky)
Kawulok and Smolka EURASIP Journal on Advances in Signal Processing 2011, 2011:99
/>
a)
b)
c)
d)
Page 9 of 15
e)
Figure 6 Scribbled images (a), propagation paths and colorized image obtained using our (b, c) and Yatziv’s approach (d, e).
on the path. Hence, the total path cost is obtained
as Cboost (p) = max {d(p(i))} . In this way the
the DTF-based propagation to significantly enlarge
(boost) the original scribbles, so that they cover the
inner parts of the regions having similar texture without
defining their boundaries. After that, the image with
boosted scribbles is subject to the competitive propagation procedure presented in Section 4.
A flowchart of the proposed colorization method is
given in Figure 8, and examples of resulting images
obtained at subsequent steps of the procedure are
demonstrated in Figure 9. The process consists of the
following steps:
1. Basic textural features are extracted from every
pixel in the original image as explained in Section
5.1.2. This operation creates an M-channel basic features image.
2. Each scribble forms an individual class of the
basic feature vectors, extracted from the pixels covered by that scribble. This establishes a classified
train set for LDA, which generates the projection
matrix during training.
3. Based on the LDA projection matrix, the basic
feature image is transformed into a DTF-features
image.
4. A distance map in the DTF domain is obtained
for every scribble as described in Section 5.2, using
Equation (7).
5. Optimal paths from each scribble to every pixel in
the image are determined using the DTF-distance
maps. Here, we found it better to compute the total
path cost as a maximal DTF-distance encountered
i=0...(l−1)
image is divided into mutually exclusive DTF
regions, in which the individual scribbles win.
6. Every DTF region conquered by an individual
scribble is shrunk using distance transform from the
region’s boundary. The shrinking margin size is
determined based on an average length of the paths
leading from the scribble to the boundary (¯b ) . Durl
ing our experiments we set it to 0.75 0.75¯b , and we
l
additionally provide that the original scribbles
remain untouched after the shrinking. The shrunk
regions are treated as the boosted scribbles for competitive propagation.
7. Competitive colorization is performed from the
boosted scribbles (as outlined in Section 4). This
operation generates the final colorized image.
Texture-based scribble boosting greatly facilitates the
colorization of large image regions of uniform texture
which are expected to obtain common chrominance.
However, tiny image details are usually annotated with
scribbles of specific colors which should not propagate
far. Moreover, taking them into account for DTF computation may affect the discrimination power of the
obtained feature space. Therefore, we allow the user to
decide which scribbles are supposed to propagate only
in their close neighborhood. We do not consider them
for scribble boosting, and we also apply decreased scribble strength for them (e.g., si = 0.1). Although it may be
Figure 7 Examples of the halo efect observed for DTF-based colorization.
Kawulok and Smolka EURASIP Journal on Advances in Signal Processing 2011, 2011:99
/>
Page 10 of 15
Original image
Basic-features
image
LDA
projection
matrix
DTF-distance
maps from
each scribble
DTF-features
image
DTF regions
User-defined
scribbles
Figure 8 Flowchart of the proposed scribble boosting method.
Scribbled images
DTF-distance maps from every scribble
DTF regions before shrinking
Boosted scribbles
Result obtained after competitive colorization from boosted scribbles
Figure 9 Examples of results obtained at selected steps of the colorization procedure.
Boosted
scribbles
Colorized
image
Kawulok and Smolka EURASIP Journal on Advances in Signal Processing 2011, 2011:99
/>
argued that this increases the user interaction, the overall gain attributed to the proposed technique is definitely
beneficial.
6 Experimental validation
Experimental validation of the proposed colorization framework was focused on two main aspects. First, we
investigated how sensitive the method is to amount and
density of the scribbles. Then, we evaluated the obtained
colorization result for a group of images, on the basis of
mean opinion score (MOS). We compared the proposed
method with two well-established colorization techniques: (1) Colorization using optimization (CUO) proposed by Levin [10] and (2) Fast image and video
colorization (FIVC) proposed by Yatziv [3]. The first
one is published in the form of MATLAB code and for
the latter we used our implementation.
In Figures 10 and 11, we present two images colorized
based on three scribble sets of different coverage (i.e.,
area covered by the scribbles expressed as percentage of
the whole image area). The images were colorized using
three methods, namely: (1) FIVC [3], (2) competitive
image colorization [2], and (3) the proposed method. To
provide fair comparison, we applied the blending
weights to the FIVC method as well, as it is outlined in
Section 3.2. The similarity measures between the
obtained images are documented in Tables 1 and 2.
Here, the images colorized using the highest scribble
coverage (9 and 5.8%, accordingly) are compared with
all the other images. We measured the similarity using
a) Scribbled image
b) FIVC method
Page 11 of 15
Peak Signal-to-Noise Ratio (PSNR), Structural Similarity
Index (SSIM) [23], Normalized Color Distance (NCD)
[24], and Universal Image Quality Index (UIQI) [25].
It may be observed that for large scribble coverage,
three investigated methods deliver very similar outcome
(top row in the Figures), and the differences are hardly
visible, which is confirmed by the quantitative results.
However, for smaller coverage, the images obtained
using these methods differ significantly. It may be seen
that both visually and quantitatively FIVC method is the
most sensitive to the scribble coverage and it fails to
colorize the images correctly for fewer scribbles. Competitive image colorization has higher stability, making it
possible to colorize the image based on medium scribble
coverage. However, it is only the proposed boosting
technique which is very little dependent on the density
and precision of the scribbles. Here, the colorized
images are almost identical regardless of the scribble
coverage, as it can be seen in the rightmost column in
the Figures. Also, the similarity scores (highlighted in
the tables) are very high between these images. It may
be therefore concluded that using the proposed scribble
boosting technique, it is possible to colorize images
even from sparse scribble sets.
We have demonstrated that the scribble boosting does
not depend much on the scribble coverage, making it
possible to colorize images using small amount of scribbles. Furthermore, we have also investigated whether the
location of scribbles may affect the colorization result.
Figure 12 presents two images colorized from two
c) Competitive
d) Boosting
9.0 % coverage
3.0 % coverage
0.7 % coverage
Figure 10 Facial image colorized using diferent methods based on three levels of scribble coverage.
Kawulok and Smolka EURASIP Journal on Advances in Signal Processing 2011, 2011:99
/>
a) Scribbled image
b) FIVC method
Page 12 of 15
c) Competitive
d) Boosting
5.8 % coverage
1.8 % coverage
0.8 % coverage
Figure 11 Landscape image colorized using diferent methods based on three levels of scribble coverage.
alternative sparse scribble sets. Although the scribbles
supposed to colorize larger areas of uniform texture
were positioned in different locations (upper row), it is
hardly possible to spot any visual differences in the
obtained results (bottom row). This is also indicated by
high similarity scores presented in the Figure. Basically,
it can be concluded that the scribble boosting is insensitive to changes in scribble location.
It is worth noting that the aim of image colorization is
to achieve plausible visual impression on a human
observer, and it is the visual effect which should determine how good an algorithm is. As it is difficult to
measure visual attractiveness, we presented a group of
34 images to 38 observers. They were asked to rate the
quality and naturalness of the images (scaled from 1 to
10). Thus, we obtained mean opinion scores (MOS)
which are demonstrated in Table 3. Some examples of
the images presented during this survey, as well as the
scribbled grayscale images, are shown in Figure 13. All
images used for the survey can be viewed at http://sun.
aei.polsl.pl/~mkawulok/boosting/survey.pdf. The rest of
images colorized using the proposed technique are
shown in Figure 14. For the majority of cases the original color versions were available, and they were also
Table 1 Similarity scores between the images presented in Figure 10
↓ Method ®
FIVC
Coverage ®
Competitive
Boosting
3%
0.7%
9%
3%
0.7%
9%
3%
-
27.29
21.42
34.03
29.64
22.93
34.02
33.24
32.5
-
0.973
0.905
0.994
0.982
0.930
0.994
0.992
0.991
NCD
UIQI
Comp. (9%)
9%
PSNR
SSIM
FIVC (9%)
0.7%
-
0.067
0.802
0.207
0.699
0.024
0.746
0.053
0.677
0.164
0.726
0.026
0.775
0.032
0.781
0.036
0.741
34.03
26.41
21.29
-
31.19
23.04
37.27
34.22
33.06
SSIM
0.994
0.969
0.903
-
0.987
0.931
0.997
0.994
0.992
NCD
0.024
0.075
0.21
-
0.46
0.16
0.018
0.03
0.034
UIQI
0.746
0.765
0.709
-
0.569
0.687
0.795
0.781
0.78
PSNR
34.02
26.53
21.2
37.27
30.63
22.89
-
37.46
35.49
SSIM
0.994
0.97
0.901
0.997
0.985
0.93
-
0.997
0.995
NCD
UIQI
Boost. (9%)
PSNR
0.026
0.775
0.075
0.877
0.212
0.822
0.018
0.795
0.051
0.704
0.164
0.691
-
0.017
0.935
0.021
0.947
Bold values indicate the best score.
Kawulok and Smolka EURASIP Journal on Advances in Signal Processing 2011, 2011:99
/>
Page 13 of 15
Table 2 Similarity scores between the images presented in Figure 11
↓ Method ®
FIVC
Coverage ®
Competitive
Boosting
1.8%
0.8%
5.8%
1.8%
0.8%
5.8%
1.8%
0.8%
PSNR
-
27.55
25.07
30.26
30.46
28.45
37.6
36.51
36.51
SSIM
-
0.942
0.919
0.966
0.963
0.949
0.987
0.985
0.985
NCD
FIVC (5.8%)
5.8%
-
0.069
0.102
0.03
0.035
0.054
0.013
0.022
0.022
UIQI
0.891
0.874
0.92
0.917
0.901
0.937
0.938
0.937
30.26
28.86
25.73
-
37.45
31.01
30.45
30.78
30.79
0.966
0.965
0.941
-
0.992
0.975
0.975
0.976
0.976
NCD
UIQI
0.03
0.92
0.053
0.927
0.086
0.9
-
0.014
0.961
0.034
0.941
0.022
0.954
0.03
0.953
0.03
0.953
PSNR
37.6
27.12
24.74
30.45
30.81
28.41
-
40.00
39.97
SSIM
0.987
0.944
0.919
0.975
0.971
0.954
-
0.996
0.996
NCD
0.013
0.068
0.101
0.022
0.028
0.049
-
0.015
0.015
UIQI
Boost. (5.8%)
-
PSNR
SSIM
Comp. (5.8%)
0.937
0.91
0.885
0.954
0.948
0.926
-
0.975
0.975
Bold values indicate the best score.
presented to the observers in order to establish the
reference level. It may be noticed that the colorized
images differ much from the originals. This is because
the scribbles do not indicate all the details, and in some
cases the chrominance assigned to a scribble is different
from the chrominance in the original image. Moreover,
the chrominance variance is much higher in the originals, while the colorized images inherit only a mixture
of the chrominance values assigned to the scribbles.
This disadvantage may be overcome by assigning a color
palette to every scribble instead of a single chrominance,
analogously to the luminance keying [4]. Despite of that,
the colorized images scores were quite close to those
obtained by the originals, and even higher in some
cases. This was mainly due to the fact that the area conquered by the individual scribbles appears correct and
natural using the proposed scribble boosting. Although
these rates are lower than for the originals, they are
0.7 % coverage
0.64 % coverage
PSNR=38.69, SSIM=0.9978
NCD=0.0121, UIQI=0.9891
definitely better than those obtained for the alternative
conventional techniques.
7 Conclusions and future work
This paper presents a new method for image colorization which utilizes local textural features. We have
demonstrated that texture is a powerful source of information that supports the colorization process. The proposed scribble boosting technique increases the original
scribbles on the basis of discriminant textural features.
This facilitates interactive image colorization, and
decreases the required density and precision of the
scribbles. DTF are determined for every individual
image using linear discriminant analysis, which makes
the method adaptive to local conditions.
The method can be further extended and used for
color transfer and video colorization. Once the DTF
space is created for a given image, it may be applied to
0.84 % coverage
0.67 % coverage
PSNR=54.71, SSIM=0.9999
NCD=0.0005, UIQI=0.9994
Figure 12 Images colorized using two alternative scribble locations (for small scribble coverage).
Kawulok and Smolka EURASIP Journal on Advances in Signal Processing 2011, 2011:99
/>
Page 14 of 15
any other image having similar contents. This extension
will be explored during our future works.
Table 3 Mean opinion scores obtained for original and
colorized images
Original
image
FIVC
method
CUO
method
Scribble
boosting
Elephant
8.91 ± 1.26
3.39 ± 2.12
3.26 ± 1.78
7.97 ± 1.29
Face A
7.76 ± 1.78
4.91 ± 1.75
4.38 ± 1.99
7.53 ± 1.73
Face B
8.44 ± 1.85
2.03 ± 1.17
2.24 ± 1.65
4.15 ± 2.05
Acknowledgements
This work has been supported by the Polish Ministry of Science and Higher
Education under R&D grant no. N N516 374736 from the Science Budget
2009-2011.
Face C
Face D
5.82 ± 2.26
-
4.09 ± 2.17
5.47 ± 2.03
4.24 ± 1.99
6.18 ± 2.11
7.41 ± 1.99
6.97 ± 1.93
Competing interests
The authors declare that they have no competing interests.
Flower
8.91 ± 1.56
4.21 ± 2.12
3.71 ± 1.99
8.03 ± 1.88
Forest
8.56 ± 1.88
4.97 ± 1.88
3.88 ± 2.23
7.44 ± 1.62
Meadow
8.24 ± 1.72
4.71 ± 1.99
5.74 ± 1.96
6.94 ± 1.92
-
3.06 ± 1.52
3.82 ± 1.66
4.82 ± 1.95
8.09 ± 1.08
4.09 ± 1.09
4.16 ± 1.2
6.81 ± 1.38
Tree
Average
Received: 1 April 2011 Accepted: 10 November 2011
Published: 10 November 2011
References
1. M Kawulok, J Kawulok, B Smolka, Textural features for scribble-based image
colorization, in Computer Recognition Systems 4, Advances in Intelligent and
Face C, 1.3% scribble coverage
(Scribbled)
(Original)
(FIVC)
(CUO)
(Boosting)
(FIVC)
(CUO)
(Boosting)
(FIVC)
(CUO)
(Boosting)
Meadow, 0.4% scribble coverage
(Scribbled)
(Original)
Elephant, 0.8% scribble coverage
(Scribbled)
(Original)
Figure 13 Selected examples of colorized images used in the survey.
Flower
Tree
Face A
Face B
Figure 14 Examples of images used in the survey, colorized using scribble boosting.
Face D
Forest
Kawulok and Smolka EURASIP Journal on Advances in Signal Processing 2011, 2011:99
/>
2.
3.
4.
5.
6.
7.
8.
9.
10.
11.
12.
13.
14.
15.
16.
17.
18.
19.
20.
21.
22.
23.
24.
25.
Soft Computing, vol. 95, ed. by R Burduk, M Kurzynski, M Wozniak, and A
Zolnierek (Springer, Berlin, 2011), pp. 269–278
M Kawulok, B Smolka, Competitive image colorization, in IEEE ICIP, IEEE,
Hong Kong, pp. 405–408 (2010)
L Yatziv, G Sapiro, Fast image and video colorization using chrominance
blending. IEEE Trans Image Proc. 15(5), 1120–1129 (2006)
R Gonzalez, R Woods, Digital Image Processing, (Addison Wesley Publishing,
Boston, 1987)
T Welsh, M Ashikhmin, K Mueller, Transferring color to greyscale images.
ACM Trans Graph (TOG). 21(3), 277–280 (2002)
U Lipowezky, Grayscale aerial and space image colorization using texture
classifcation. Pattern Rec Lett. 27(4), 275–286 (2006). doi:10.1016/j.
patrec.2005.08.009
D Sykora, J Burianek, J Zara, Unsupervised colorization of black-and-white
cartoons, in SIGGRAPH, ACM, Los Angeles, California, pp. 121–127 (2004)
T Horiuchi, Colorization algorithm using probabilistic relaxation. Image Vis
Comput. 22(3), 197–202 (2004). doi:10.1016/j.imavis.2003.08.004
T Horiuchi, H Kotera, Colorization for monochrome image with texture, in
Proceedings of 13th Color Imaging Conference, IS&T, Scottsdale, Arizona, pp.
245–250 (2005)
A Levin, D Lischinski, Y Weiss, Colorization using optimization, in SIGGRAPH,
ACM, Los Angeles, California, pp. 689–694 (2004)
P Lagodzinski, B Smolka, Digital image colorization based on probabilistic
distance transform, in ELMAR, 2008, vol. 2. (IEEE, Zadar, Croatia, 2008), pp.
495–498
V Konushin, V Vezhnevets, Interactive image colorization and recoloring
based on coupled map lattices, GraphiCon, (GraphiCon, Novosibirsk
Akademgorodok, Russia, 2006), pp. 231–234
T Kim, K Lee, S Lee, Edge-preserving colorization using data-driven random
walks with restart, IEEE ICIP, (IEEE, Cairo, Egypt, 2009), pp. 1661–1664
L Ikonen, P Toivanen, Distance and nearest neighbor transforms on graylevel surfaces. Pattern Rec. Lett. 28(5), 604–612 (2007). doi:10.1016/j.
patrec.2006.10.010
E Mortensen, W Barrett, Interactive segmentation with intelligent scissors.
Graph Models Image Proc. 60(5), 349–384 (1998). doi:10.1006/
gmip.1998.0480
J Heu, D Hyun, C Kim, S Lee, Image and video colorization based on
prioritized source propagation, in IEEE ICIP, IEEE, Cairo, Egypt, pp. 465–468
(2009)
J Zhang, S Lazebnik, C Schmid, Local features and kernels for classifcation
of texture and object categories: a comprehensive study. Int J Comput Vis.
73, 213–238 (2007). doi:10.1007/s11263-006-9794-4
RM Haralick, Statistical and structural approaches to texture. Proc IEEE. 67(5),
786–804 (1979)
T Ojala, M Pietikäinen, T Mäenpää, Multiresolution gray-scale and rotation
invariant texture classifcation with local binary patterns. IEEE Trans Pattern
Anal Mach Intell. 24(7), 971–987 (2002). doi:10.1109/TPAMI.2002.1017623
J Portilla, E Simoncelli, A parametric texture model based on joint statistics
of complex wavelet coefficients. Int J Comput Vis. 40(1), 49–71 (2000).
doi:10.1023/A:1026553619983
M Varma, A Zisserman, A statistical approach to texture classifcation from
single images. Int J Comput Vis. 62, 61–81 (2005)
G Seber, Multivariate Observations, (Wiley, New York, 1984)
Z Wang, A Bovik, HR Sheikh, EP Simoncelli, Image quality assessment: from
error visibility to structural similarity. IEEE Trans Image Process. 13(4),
600–612 (2004). doi:10.1109/TIP.2003.819861
R Lukac, K Plataniotis, D Hatzinakos, M Aleksic, A novel cost efective
demosaicing approach. IEEE Trans Consum Electron. 50(1), 256–261 (2004).
doi:10.1109/TCE.2004.1277871
Z Wang, A Bovik, A universal image quality index. IEEE Signal Process Lett.
9(3), 81–84 (2002). doi:10.1109/97.995823
doi:10.1186/1687-6180-2011-99
Cite this article as: Kawulok and Smolka: Texture-adaptive image
colorization framework. EURASIP Journal on Advances in Signal Processing
2011 2011:99.
Page 15 of 15
Submit your manuscript to a
journal and benefit from:
7 Convenient online submission
7 Rigorous peer review
7 Immediate publication on acceptance
7 Open access: articles freely available online
7 High visibility within the field
7 Retaining the copyright to your article
Submit your next manuscript at 7 springeropen.com