Báo cáo hóa học: " Effects of crystallization and dopant concentration on the emission behavior of TiO2: Eu nanophosphors" potx
Bạn đang xem bản rút gọn của tài liệu. Xem và tải ngay bản đầy đủ của tài liệu tại đây (685.19 KB, 12 trang )
NANO COMMENTARY Open Access
Effects of crystallization and dopant
concentration on the emission behavior of TiO
2
:
Eu nanophosphors
Mou Pal
*
, Umapada Pal, Justo Miguel Gracia Y Jiménez and Felipe Pérez-Rodríguez
Abstract
Uniform, spherical-shaped TiO
2
:Eu nanoparticles with di fferent doping concentrations have been synthesized
through controlled hydrolysis of titanium tetrabutoxide under appropriate pH and temperature in the presence of
EuCl
3
·6H
2
O. Through air annealing at 500°C for 2 h, the amorphous, as-grown nanoparticles could be converted to
a pure anatase phase. The morphology, structural, and optical properties of the annealed nanostructures were
studied using X-ray diffraction, scanning electron microscopy, energy-dispersive X-ray spectroscopy [EDS], and UV-
Visible diffuse reflectance spectroscopy techniques. Optoelectronic behaviors of the nanostructures were studied
using micro-Raman and photoluminescence [PL] spectroscopies at room temperature. EDS results confirmed a
systematic increase of Eu content in the as-prepared samples with the increase of nominal europium content in
the reaction solution. With the increasing dopant concentration, crystallinity and crystallite size of the titania
particles decreased gradually. Incorporation of europium in the titania particles induced a structural deformation
and a blueshift of their absorption edge. While the room-temperature PL emission of the as-grown samples is
dominated by the
5
D
0
-
7
F
j
transition of Eu
+3
ions, the emission intensity reduced drastically after thermal
annealing due to outwards segregation of dopant ions.
Keywords: titania nanoparticles, europium doping, optical properties, photoluminescence
Introduction
Luminescent nanomaterials have gained considerable
attention in recent years due to the breakthrough devel-
opments of technology in various areas such as electro-
nics [1,2], photonics [3], displays [4,5], optical
amplifications [6], lasers [7], fluorescent sensing [8], bio-
medical engineering, [9] and environmental control [10].
The long emission lifetime and rich spectral properties
of certain rare-earth [RE] ions a re highly attractive in
many ways. However, RE ions alone are weakly fluores-
cent due to the parity forbidden f-f transitions [11].
Therefore, the use of host materials is crucial to excite
the R E ions efficiently in a wide spectral range in order
to utilize their full potential in optoelectronic devices.
Oxide lattices have proved to be an excellent host mate-
rial due to their good thermal, chemical, and mechanical
stabilities [12,13]. Among them, Y
2
O
3
is a promising
host for RE ions due to its low phonon frequencies,
which make the nonradiative relaxation of the excited
states inefficient [14]. However, the high costs associated
with synthesis have restricted its further use. A s an
alternative, TiO
2
, a well-known wide bandgap semicon-
ductor, has demonstrated the possib ility to be a good
sensitizer to absorb light and transfer energy to RE ions.
Moreover, the high refractive index and high transpar-
ency of TiO
2
in the visible and infrared regions make it
possible to use in optical devices. The additional advan-
tages of using TiO
2
are its low fabrication cost and
good thermal and mechanical stabilities. However, due
to the large mismatch of ionic radii (Eu
+3
=0.95Åand
Ti
+4
= 0 0.68 Å) and charge imbalance between the Ti
+4
and Eu
+3
ions, successful incorporation of Eu ions into
TiO
2
nanocrystals through a soft, wet-chemical route
still remains a great challenge. In most of the cases, Eu
+3
ions either tend to locate on a crysta l surface, causing
an undesired Eu-Eu interaction, or form Eu
2
O
3
aggre-
gates, which act as quenching sites, resulting in a drastic
* Correspondence:
Instituto de Física, Benemérita Universidad Autónoma de Puebla, Apartado
Postal J48, Puebla, Pue., 72570, México
Pal et al. Nanoscale Research Letters 2012, 7:1
/>© 2012 Pal et al; licensee Springer. This is an Open Access article distributed under the terms of t he Creative Commons Attribution
License (http://creat ivecommons. org/lic ense s/by/2.0), which permits unrestricted use, distribution, a nd reproduction in any medium,
provided the original work is properly cited.
decrease in the luminescent intensity [15]. Numerous
studies have been realized on the synthesis and optical
characterization of Eu
+3
-doped TiO
2
with the objective
of improving the luminescence of the E u
+3
ions by
energy transfer from TiO
2
. It has bee n reported that the
mesoporous, semicrystalline TiO
2
films are ideal
matrices for incorporating Eu
+3
ions in which the sensi-
tized photoluminescence [PL] emission is due to the
energy transfer from the TiO
2
to Eu
+3
ions in an amor-
phous TiO
2
region [16]. However, the emission intensity
of Eu-doped TiO
2
nanostructures has been found to
reduce greatly or even disappear completely after
annealing at high temperatures [17]. In the literature,
we can find several explanations for this behavior such
as phase transition [ 18], segregation of Eu
2
O
3
from
TiO
2
[19], or formation of a highly symmetric structure
of Eu
2
Ti
2
O
7
at high temperatures [20]. Therefore, the
fabrication of structurally pure, concentration-con-
trolled, single-phase TiO
2
:Eu nanostructures with a con-
trolled emission behavior is still a challenging task for
their utilization in optoelectronics.
For the application in luminescent devic es, small
phosphor particles of a spherical morphology, narrow
size distribution, and low dispersity are desired to
improve their emission intensity and screen packing
[21]. To meet these demands, a variety of synthesis
methods have been applied to fabricate RE-doped
titania nanoparticles. Luo et al. could prepare Eu-
doped TiO
2
nanodots in the 50- to 70-nm size range
by a phase-separation-induced self-assembly method
[15]. Yin et al. have studied the luminescence proper-
ties of spherical mesoporous Eu-doped TiO
2
particles
of 250 nm in diameter obtained through a nonionic
surfactant-assisted soft chemistry method [16].
Ningthoujametal.couldobtainEu
+3
-doped TiO
2
nanoparticles by urea hydrolysis in an ethylene glycol
medium at a temperature of 150°C [17]. Chi et al.
have synthesized Eu-doped TiO
2
nanotubes by a two-
step hydrothermal treatment [22]. On the other hand,
Julian et al. could synthesize Eu
+3
-doped nanocrystal-
line TiO
2
and ZrO
2
by a one-pot sol-gel technique
[23].
In the present work, we report the incorporation of Eu
+3
ions in TiO
2
nanoparticles by a simple and versatile
sol-gel technique which could be extended to different
lanthanide and transition metal ions in order to obtain
multifunctional materials. The particles thus obtained
have shown a perfectly spherical shape, improved size
distribution, and excellent luminescent characteristics,
elucidating the possibility of applying RE-doped titania
nanoparticles as an efficient luminescent material. The
dependence of the PL intensity of the nanophosphors
on doping concentration and thermal annealing has
been discussed.
Experimental details
Eu-doped TiO
2
nanoparticles were prepa red according
to the following procedures: 2.5 ml of titanium tetrabut-
oxide (97%, Aldrich) was added slowly to 25 ml of anhy-
drous ethanol inside a glove box under nitrogen
atmosphere and kept under magnetic stirring for 1 h at
room temperature. Hydrolysis of the m ixture was car-
ried out by dropwise addition into 50 ml of deionized
water inside a round-bottom flask under vigorous stir-
ring. Prior to the addition, the pH of the water was
adjustedto3.0byaddinganitricacid(0.1M)solution
in order to avoid the formation of europium hydroxide.
The temperature of the mixture was maintained at 4°C
to retard the hydrolysis rate.
Eu(III)-dope d samples were prepared following the
same procedure but d issolving the required amounts of
Eu(NO
3
)
2
·6H
2
O corresponding to 0.5, 1, 2.5, and 5 mol
% (nominal) in water before the addition of the Ti pre-
cursor. The white precipitate of TiO
2
was separated
through centrifugation, washed several times with water
and ethanol, and finally dried at room temperature to
obtain resulting materials. In order to induce crystalliza-
tion, the as-grown samples (both the undoped and Eu-
doped) were thermally treated at 500°C for 2 h in air
atmosphere.
The crystalline phase of the nanoparticles was ana-
lyzed by X-ray diffraction [XR D] using a Bruker D8
DISCOVER X-ray diffractometer with a CuKa radiation
(l = 1.5406 Å) source. The size, morphology, and che-
mical composition of the nanostructures were examined
in a JEOL JSM-6610LV field-emission scanning electron
microscope [FE-SEM] with a Thermo Noran Super Dry
II analytical system attached. The absorption character-
istics of the synthesized samples in a UV-Visible [UV-
Vis] spectral range were studied by diffuse reflectance
spectroscopy (Varian Cary 500 UV-Vis spectrophot-
omet er with DRA-CA-30I diffuse reflectance accessory).
Micro-Raman spectra of the powder samples were
acquired using an integrated micro-Raman system. The
system includes a microspectrometer HORIBA Jobin
Yvon HR800, an OLYMPUS BX41 microscope, and a
thermoelectrically cooled CCD detector. The 332.6-nm
emission of a He-Ne laser was used as the e xcitation
source. PL measurements were performed at room tem-
perature using a Jobin Yvon iHR320 spectrometer
(HORIBA) with a 374-nm emitting diode laser as an
excitation source.
Results and disc ussion
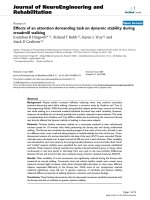
Figure 1 shows the SEM images of undoped and doped
TiO
2
nanoparticles revealing their general morphology.
The corresponding size distribution hist ograms and the
variation of average size with dopant concentration a re
presented in Figure 2. Formation of titania nanoparticles
Pal et al. Nanoscale Research Letters 2012, 7:1
/>Page 2 of 12
0.5 m
a
100 nm
0.5 m
b
100 nm
0.5
m
C
100 nm
0.5 m
100 nm
d
e
0.5
m
100 nm
Figure 1 Typical SEM images.(a) Undoped, (b)0.5%,(c)1.0%,(d) 2.5%, and (e) 5.0% (nominal) Eu-doped TiO
2
nanoparticles. The insets show
magnified images of some particles for each sample.
40 50 60 70 80
0
5
10
15
20
25
30
35
4
0
a)
Mean size= 56 nm
SD= 7.6 nm
Number o
f
particles
Particle size (nm)
30 35 40 45 50 55
0
5
10
15
20
25
30
35
4
0
c)
Number pf particles
Particle size (nm)
Mean size= 43.4 nm
SD=4.9 nm
30 35 40 45 50 55
0
5
10
15
20
25
30
35
40
Mean size= 39.9 nm
SD = 4.8 nm
d)
Number o
f
particles
Particle size
(
nm
)
26 28 30 32 34 36 38 40 42 44 46 48 50
0
5
10
15
20
25
30
35
40
Mean size= 37.6 nm
SD= 3.4 nm
e)
Number of particles
Particle size (nm)
35 40 45 50 55 60
0
5
10
15
20
25
30
35
40
Mean size= 48.6 nm
SD= 6 nm
b)
Number of particles
Particle size (nm)
012345
30
35
40
45
50
55
60
Average diameter (nm)
Dopant concentration (molar)
Figure 2 The size distribution histograms and corresponding Gaussian fits.(a)0.0%,(b)0.5%,(c)1.0%,(d) 2.5% and (e) 5.0% (nominal) of
the Eu dopant. Variation of the particle size with dopant concentration is shown in the bottom right. The average diameter decreased
exponentially with the increasing molar concentration of Eu
+3
ions.
Pal et al. Nanoscale Research Letters 2012, 7:1
/>Page 3 of 12
of a spherical morphology and narrow size distribution
can be seen from the SEM micrographs. Compared with
the undoped TiO
2
, the average size of the Eu-doped
TiO
2
nanoparticles decreases almost exponentially with
the increase of the dopant co ncentration, suggesting
that the incorporation of Eu ions suppresses the growth
of TiO
2
nanocrystals to a great extent.
In order to verify the presence of Eu in the doped
samples, they were analyzed by energy-dispersive spec-
troscopy [EDS]. EDS sp ectra and estimated compositio n
ofthesamplesarepresentedinFigure3andTable1,
respectively. The EDS spectra clearly revealed that the
emission peaks correspond to O, Ti, and Eu, along with
the carbon peak which might have come from the car-
bon tape used to fix the samples on the sample holder.
A systematic decrease in the content of titanium and an
increase in the relative content of europium are
observed with the increasing nominal concentration of
the dopant in the samples.
The XRD patterns of the undoped and Eu-doped
phosphor particles (Figure 4) revealed the presence of
TiO
2
exclusively in an anatase (tetragonal) phase
(JCPDS 84-1286) after thermal annealing. In general, the
intensity of the diffraction peaks decreases greatly with
the increase of doping concentration, indicating a loss of
crystallinity due to lattice dist ortion. When Eu
+3
ions
are incorporated into the periodic crystal lattice of TiO
2
,
a strain is induced into the system, resulting in the
alteration of the lattice periodicity and decresae in c rys-
tal symmetry. As can be seen from the XRD patterns,
the diffraction peaks get broadened as the Eu
+3
concen-
tration is increased, suggesting a systematic decrease in
the grain size. The peaks which correspond to the crys-
tal planes (101) and (200) of the anatase phase are
selected to calculate the lattice parameters of the
undoped and Eu-doped TiO
2
nanocrystals. Using the
relations d
(hk1)
= l/2 sinθ (Bragg’ slaw)and
d
(
hkl
)
=
h
2
/a
2
+ k
2
/a
2
+ l
2
/c
2
−1/2
, the lattice para-
meter and unit cell volume of the samples were evalu-
ated (Table 2). Here, hkl are the Miller indices; a, b, and
c are the lattice parameters (in a tetragonal system, a=
b ≠ c); d
(hkl)
is th e interplanar spacing between the crys-
tal planes (hkl); l is the X-ray wavelength; and θ is the
diffraction angle. A s can be seen from the estimated
data, the estimated lattice parameters and unit cell
volume values for the doped TiO
2
nanoparticles deviate
considerably from those of the undoped sample due to
the incorporation of Eu
+3
ions into the TiO
2
lattice,
which induces the local distortion of the crystal
structure.
Micro-Raman spectroscopy is a powerful tool to inves-
tigate the structural prop erties of nanostructures, moni-
toring the unusual band broadening and shifts of Raman
bands associated with particle size. According to the
Heisenberg uncertainty principle, the particle size and
phonon position hold the following relationship:
X P ≥
¯
h
2
/4,
(1)
where ΔX is the par ticle size, ΔP is the pho non
momentum distribution, and ħ is the reduced Planck’s
constant. As the particle size decreases, the phonon is
increasingly confined within the particle, and the pho-
non momentum distribution inc reases. This situation
leads to a broadening of the momentum of the scattered
phonon according to the law of conservation of momen-
tum, causing a peak broadening as well as a shift of the
Raman bands [24]. Figure 5 shows the Raman spectra of
the undoped and Eu-doped TiO
2
nanoparticles. Accord-
ingtogrouptheory,anatasehassixRaman-active
modes (A
1g
+2B
1g
+3E
g
) [25]. Ohsaka reported the
Raman spectrum of an anatase single crystal where six
Figure 3 EDS spectra of the undoped and 5.0 mol% (nominal) Eu-doped TiO
2
samples.
Pal et al. Nanoscale Research Letters 2012, 7:1
/>Page 4 of 12
allowed modes appeared at 144 (E
g
), 197 (E
g
), 399 (B
1g
),
513 (A
1g
), 519 (B
1g
), and 639 cm
-1
(E
g
)[26].Fromthe
Raman spectra, it is evident that both the undoped and
Eu-doped TiO
2
powders are in an anatase phase. There
appeared no apparent impurity-related modes in the
Raman spectra of doped samples, in agreement with the
obtained XRD results. In order to appreciate the differ-
ences between the spectra more clearly, the position and
the full width at half maximum [F WHM] of t he E
g
mode at 144 c m
-1
are also presented in Table 3. With
the increase of doping concentration, the position of the
Raman bands, in particular the E
g
mode near 144 cm
-1
,
shifts towards higher wavenumbers and their intensities
decrease drastically. The observation can be attributed
to the red uction of particle size in the Eu-doped sam-
ples. When the grain si ze decreases to the nan ometer
scale, the vibrational propertie s of mate rials are influ-
enced greatly. Mainly, a volume contraction occurs
within the nanoparticles due to the size-induced radial
pressure, which leads to an increase in the force con-
stants because of the d ecrease in the int eratomic dis-
tances. In vibrational transitions, the wavenumber varies
Table 1 EDS estimated quantitative composition analysis of undoped and Eu-doped TiO
2
nanoparticles
Nominal Eu concentration in the sample (mol%) Oxygen
(atom %)
Titanium
(atom %)
Europium
(atom %)
0.0 64.73 35.27 0.0
0.5 65.10 34.63 0.27
1.0 66.42 33.23 0.35
2.5 66.59 32.84 0.57
5.0 67.76 31.30 0.94
20 30 40 50 60 70 8
0
A(215)
A(220)
A(116)
A(204)
A(211)
A(105)
A(200)
A(004)
A(101)
Bra
gg
an
g
le, 2
(
de
g
rees
)
Undoped TiO
2
TiO
2
:Eu (0.5%)
Intensity (a.u.)
TiO
2
:Eu (1.0%)
TiO
2
:Eu (2.5%)
TiO
2
:Eu (5.0%)
Figure 4 XRD patterns of the Eu-doped TiO
2
nanoparticles showing their pure anatase phase.
Pal et al. Nanoscale Research Letters 2012, 7:1
/>Page 5 of 12
approxima tely in proportion to k
1/2
, where k is the force
constant. Consequently, the Raman bands shift towards
a higher wavenumber due to the increasing force con-
stants [27]. The sudden reduction in scattering intensity,
particularly of the E
g
mode, may be due t o the break-
down of long-ran ge translational crystal symmetry
caused by the incorporated defects.
Spectroscopic measurement of diffuse reflectance in
UV-Vis spectral range is a standard technique for the
determination of the bandgap of powder samples [28].
Figure 6 shows the diffuse reflectance spectra of the
undoped and Eu-doped titania particles after therm al
treatment. A sharp decrease in reflectance started at
about 415 nm for the undoped TiO
2
samples due to
strong absorption. On increasing the incorporated Eu
content, the absorption edge suffered a gradual blueshift.
The reflecta nce spec tra were analyzed using the
Kubelka-Munk relation to co nvert the reflectance into a
Kubelka-Munk function (equiv alent to the absorption
Table 2 Lattice parameters and cell volume of different
samples calculated from XRD results
Sample a (Å) c (Å) Cell volume (Å
3
)
TiO
2
:Eu 0% 3.7830 9.5346 136.4505
TiO
2
:Eu 0.5% 3.7945 9.5379 137.3288
TiO
2
:Eu 1.0% 3.7864 9.5476 136.8827
TiO
2
:Eu 2.5% 3.7851 9.6175 137.7897
TiO
2
:Eu 5.0% 3.7863 9.5723 137.2291
200 300 400 500 600
0
5000
10000
15000
20000
25000
30000
35000
40000
45
000
TiO
2
TiO
2
:Eu (0.5%)
TiO
2
:Eu (1.0%)
TiO
2
:Eu (2.5%)
TiO
2
:Eu (5.0%)
Raman Intensity (a.u.)
Raman shift
(
cm
-1
)
120 140 160 180 200
TiO
2
:Eu (0%)
TiO
2
:Eu (0.5%)
TiO
2
:Eu (1.0%)
TiO
2
:Eu (2.5%)
TiO
2
:Eu (5.0%)
Raman shift (cm
-1
)
Figure 5 Raman spectra of the undoped and Eu-doped TiO
2
nanoparticles. Peak broadening and red shift of the Raman-active mode at
144 cm
-1
on the increasing dopant content are shown as inset.
Table 3 The position and FWHM of the E
g
mode in the
undoped and Eu-doped TiO
2
nanoparticles
Sample Position of the E
g
mode (cm
-1
) FWHM
(cm
-1
)
TiO
2
:Eu 0.0% 144.2 10.22
TiO
2
:Eu 0.5% 146.7 14.67
TiO
2
:Eu 1.0% 146.3 12.63
TiO
2
:Eu 2.5% 146.09 13.24
TiO
2
:Eu 5.0% 147.6 13.82
FWHM, full width at half maximum.
Pal et al. Nanoscale Research Letters 2012, 7:1
/>Page 6 of 12
coefficient), F(R
a
), using the relation:
F
(
R
α
)
=
(
1 − R
α
)
2
/2R
α
,
(2)
where R
a
is the reflectance of an infinitely thick sam-
ple with respect to a reference at each wavelength.
Bandgap energies of the sa mples were estimated from
the variation of the Kubelka-Munk function with photon
energy. Figure 7 presents the Kubelka-Munk plots for
the undoped and Eu-doped samples used to deter mine
their bandgap energy associa ted with an indirect transi-
tion. It can be observed that the indirect bandgap
increases gradually with the increase of doping concen-
tration. However, the estimated indirect bandgap values
(3.16 to 3.20 eV) for all the samples were very close to
the reported indirect bandgap value of anatase [29].
With the increase of incorporated Eu content, the band-
gap energy of the TiO
2
nanostructures increased sys-
tematically. This behavior is very similar to the
previously reported results [30], where the authors
observed a blueshift in the bandgap of Eu-doped CdS
nanorods with the increase of doping concentration.
The reason of such bandgap energy increment has been
proposed as the gradual movement of the conduction
band of TiO
2
above the first excited state of Eu
+3
due to
the increased dopant incorporation. Incorporated Eu
+3
ions at the first excited state interact wit h the electrons
of the conduction band of TiO
2
, resulting in a higher
energy transfer from the TiO
2
to Eu
+3
ions. However,
an increased absorption in the visible range and red
shift of the energy bandgap have been observed by Yu
et al. on doping TiO
2
nanotubes with Fe
+3
ions [31].
Such an opposite behavior has been explained through
the creation of dopant levels near the valence band of
TiO
2
on Fe
+3
ion incorporation. Therefore, the relative
shift of the absorption edge of the semiconductor
depends strongly on the difference between the ionic
radius of the dopant and the h ost cations, as well as on
the chemical nature of the dopants.
To evaluate the bandgap energy of the nanoparticles
associated to their direct transition, [F(R
a
)hv]
2
vs. hv
350 400 450 500 55
0
0
20
40
60
80
100
Undoped TiO
2
TiO
2
:Eu 0.5%
TiO
2
:Eu 1.0%
TiO
2
:Eu 2.5%
TiO
2
:Eu 5.0%
Reflectance (%)
Wavelen
g
th
(
nm
)
Figure 6 UV-Vis diffuse reflectance spectra for the undoped and Eu-doped TiO
2
phosphor nanoparticles.
Pal et al. Nanoscale Research Letters 2012, 7:1
/>Page 7 of 12
were plotted (Figure 8). The estimated bandgap values
(obtain ed from linear fits of the square of the remissi on
function) are quite larger than those associated with
indirect transitions which has been reported previously
[32].
Figure 9 shows the PL spectra of the undoped and Eu-
doped titania nanoparticles before thermal treatment. Eu
+3
-doped phosphor nanoparticles show several sharp
and well-resolved emission lines associated with Eu
+3
ions which correspond to radiative relaxations from the
5
D
0
level to its low-lying multiplets
7
F
j
.Thestrongest
emission centered at around 612 nm corresponds to the
electrical dipole transition (
5
D
0
-
7
F
2
)ofEu
+3
ions
which give the red color in the lumines cence signals. In
the literat ure, it h as been reported that this transition is
possible only if Eu
+3
ionsoccupyasitewithoutan
inverse symmetry [33]. Other emission p eaks centered
around 578, 592, 651, and 700 nm are associated with
5
D
0
-
7
F
0
,
5
D
0
-
7
F
1
(magnetic dipole transition),
5
D
0
-
7
F
3
,and
5
D
0
-
7
F
4
transitions of Eu
+3
ions, respectively.
With the increase of Eu
+3
content from 0.5 to 5 mol%
(nominal), the PL intensity increases systematically.
Besides the characteristic emission peaks attributed to
the Eu
+3
ions, we can also find a broad emission ba nd
in between 415 and 530 nm for the Eu-doped samples.
In the case of 0.5%, 1%, and 5.0% doped samples, the
band is centere d at a round 442 nm along with a small
shoulder at 466 nm for 1% Eu-doped titania nanoparti-
cles. Commonly, PL emission of anatase TiO
2
is attribu-
ted to three different physical origins: self-trapped
excitons, oxygen vacancies, and surface sta tes (defect)
[34]. The 442-nm band most probably originated from
the self-trapped excitons localized on TiO
6
octahedra
[35], whereas the 466-nm band is attributed to oxygen
vacancies [36]. It is interesting to note that for the 2.5%
Eu-doped sample, the blue emission (emission in
between 415 and 530 nm) has been decreased drasti-
cally, indicating that the relative intensity of the red and
blue emissions can be t ailored by adjusting the concen-
tratio n of dopant ions in the TiO
2
lattice. The undoped
TiO
2
sample revealed a broad low-intensity band cen-
tered at 560 nm with a small shoulder at higher energy
(440 nm; inset of Figure 7). This visible luminescence
band arises from the radiative recombination of elec-
trons via intrinsic surface states of TiO
2
nanoparticles
[37]. It is well known that in case of nanoparticl es, sur-
faces play important roles as the surface-to-volume ratio
becomes increasingly large at a nanometer size. As TiO
2
is a strongly ionic metal oxide, the filled valance band is
mainly composed of the outermost 2p orbitals of oxygen
atoms, a nd the lowest conduction band is derived from
titanium 3d orbitals. When some titanium atoms are
2.9 3.0 3.1 3.2 3.3 3.4 3.5 3.6 3.7 3.8 3.9 4.0
TiO
2
:Eu 0.5%
E
g / indirect
= 3.18 eV
Photon energy (eV)
2.9 3.0 3.1 3.2 3.3 3.4 3.5 3.6 3.7 3.8 3.9 4.
0
TiO
2
:Eu 1%
E
g / indirect
= 3.19 eV
Photon energy (eV)
2.8 2.9 3.0 3.1 3.2 3.3 3.4 3.5 3.6 3.7 3.8 3.9 4.0
0
1
2
3
4
5
6
7
8
9
10
TiO
2
:Eu 0%
E
g / indirect
= 3.16 eV
[F(R )h ]
1/2
Photon energy (eV)
2.8 2.9 3.0 3.1 3.2 3.3 3.4 3.5 3.6 3.7 3.8 3.9 4.0
0
1
2
3
4
5
6
7
8
9
10
TiO
2
:Eu 2.5%
E
g / indirect
= 3.19(6) eV
[F(R )h ]
1/2
Photon energy (eV)
2.9 3.0 3.1 3.2 3.3 3.4 3.5 3.6 3.7 3.8 3.9
TiO
2
:Eu 5%
E
g / indirect
= 3.20 eV
Photon ener
gy
(
eV
)
Figure 7 Kubelka-Munk plots and bandgap energy estimation of pure and Eu-doped TiO
2
nanoparticles for indirect transition.
Pal et al. Nanoscale Research Letters 2012, 7:1
/>Page 8 of 12
exposed to the surface of nanoparticles, they get oxi-
dized into Ti
+3
,Ti
+2
,orTi
+
oxidation states, and loca-
lized energy levels are introduced within the forbidden
gap [38]. These intrinsic surface states act as lumines-
cence center s under an appropriate excitation as can be
seeninthepresentwork.Figure10showsthePLspec-
tra recorded at room temperature for the 5.0 mol% Eu-
doped titania nanoparticles before and after thermal
treatment. For the unannealed Eu-doped s amples, the
narrow emission peaks are clearly attributed to f-f tran-
sitions of Eu
+3
ions. However, the PL spectrum of the
heat-treated sample did not reveal the charact eristic
emission peaks of Eu
+3
ions except the
5
D
0
-
7
F
2
transi-
tion of a very low intensity and the visible luminescence
band corresponding to anatase TiO
2
nanostructures.
Similar observations have also been reported in the lit-
erature [39]. In the as-grown (unannealed) samples, the
amorphous TiO
2
matrix not only acts as a good host for
well-dispersed Eu
+3
ions,butalsofunctionsasagood
sensitizer by transferring the absorbed energy to Eu
+3
ions [40]. Electrons are i nitially excited to the conduc-
tion band of TiO
2
on irradiating UV light and then
relaxed to the defect states. Since the defect states of
TiO
2
are located at higher energies than those of the
emitting state (
5
D
0
)ofEu
+3
ions, energy transfer to the
crystal field states (
7
F
j
)ofEu
+3
occurs, resulting in effi-
cient PL [41]. This energy transfer process is schema ti-
cally depicted in Figure 10 at the right. When the
sample is annealed at 500°C, all the PL emissions almost
disappeared (Figure 10). This co uld be related to the
transformation of amorphous titania to a fully crystalline
anatase phase which presents a higher density, making
more difficult for Eu
+3
ions to locate at the site of Ti
+4
duetothelargedifferenceintheirionicradii[42].
Thus, the well-dispersed Eu
+3
ions in the unannealed
amorpho us titania tend to be segregated outwards. This
3.2 3.3 3.4 3.5 3.6 3.7 3.8 3.9 4.0 4.1 4.
2
Direct transition
TiO
2
:Eu 0%
TiO
2
:Eu 0.5%
TiO
2
:Eu 1%
TiO
2
:Eu 2.5%
TiO
2
:Eu 5%
[F(R )h ]
2
Photon ener
gy
(
eV
)
Figure 8 Kubelka-Munk-transformed diffuse reflectance spectra of the Eu-doped nanoparticles used for the estimation of direct
bandgap.
Pal et al. Nanoscale Research Letters 2012, 7:1
/>Page 9 of 12
400 450 500 550 600 650 700
2
4
6
8
10
12
F
4
7
D
0
5
F
3
7
D
0
5
F
2
7
D
0
5
F
1
7
D
0
5
F
0
7
D
0
5
Eu 0%
Eu 0.5%
Eu 1%
Eu 2.5%
Eu 5%
PL intensity
(
a.u.
)
Wavelen
g
th
(
nm
)
400 450 500 550 600 650 700
Undoped TiO
2
PL intensity (a.u.)
Wavelength (nm)
Figure 9 Room-temperature PL spectra of the undoped and Eu-doped titania nanoparticles before thermal annealing.
Figure 10 PL spectra of the 5.0% Eu-doped titania nanoparticles.(a) Before and (b) after thermal annealing (left). Schematic illustration of
the possible mechanism of energy transfer from the TiO
2
host to Eu
+3
(right). VB, CB, and DS correspond to the valence band, conduction band,
and defect state, respectively.
Pal et al. Nanoscale Research Letters 2012, 7:1
/>Page 10 of 12
might cause the undesired Eu-Eu interactions acting as a
luminescent quencher and leads to a drastic decre ase in
the PL intensity.
Conclusion
In conclusion, highly uniform, spherical-shaped Eu-
doped TiO
2
phosphor particles could be synthesized
through a simple sol-gel technique at a large scale. The
low-cost phosph or particles are about 50 nm in average
diameter and have about 10% size dispersion. With the
increasing nominal doping concentration up to 5.0 mol
%, the a verage diameter of the particles reduces to 38
nm. Under ultraviolet excitation, the phosphor par tic les
show the characteristic emission corresponding to the
5
D
0
-
7
F
j
transition of Eu
+3
ions along with a broad
band in the 400- to 500-nm r ange belonging to anatase
TiO
2
. Thermal annealing-induced crystallization of the
nanoparticles causes a drastic reduction of PL emission
intensity, suggesting amorphous TiO
2
as an ideal frame-
work for an efficient energy trans fer between the titania
hostandincorporatedEu
+3
ions. The low fabrication
cost, high yield, controlled morphology, and good lumi-
nescent performance of the as-grown TiO
2
:Eu
+3
nano-
particles provide the possibility of using them as
efficient red-emitting phosphors.
Acknowledgements
The work was supported by CONACYT, Mexico and VIEP-BUAP through the
Red Temática de Nanociencia y Nanotecnología and VIEP/EXC/2011 projects,
respectively. MP thanks Cuerpo Académico de Materiales Avanzados (BUAP-
CA-250) for the partial financial support. The authors are sincerely thankful to
Dr. Rutilo Silva (Institute of Physics) and Dr. Efrain (Centro Universitario de
Vinculación) of the Autonomous University of Puebla for facilitating the EDS
and XRD, respectively.
Authors’ contributions
MP proposed the original idea, carried out most of the experimental works
associated with synthesis and characterization of the samples, analyzed the
results, and prepared the manuscript. UP improved the original idea, helped
in analyzing the results, and revised the manuscript. JMGyJ performed the
PL measurements and analyzed the data. FP-R designed and coordinated
the whole work. All authors read and approved the final manuscript.
Competing interests
The authors declare that they have no competing interests.
Received: 14 October 2011 Accepted: 3 January 2012
Published: 3 January 2012
References
1. Jianhua H, Guogen H, Xiongwu H, Rui W: Blue-light emission from
undoped and rare-earth doped wide bandgap oxides. J Rare Earths 2006,
24:728-731.
2. Linh NH, Trang NT, Cuong NT, Thao PH, Cong BT: Influence of doped rare
earth elements on electronic properties of the R
0.25
Ca
0.75
MnO
3
systems.
Comput Mater Sci 2010, 50:2-5.
3. Joannopoulos JD, Villeneuve PR, Fan S: Photonic crystals: putting a new
twist on light. Nature 1997, 386:143-149.
4. Ghis A, Meyer R, Rambaud P, Levy F, Leroux T: Sealed vacuum devices:
fluorescent microtip displays. IEEF Trans Electron Devices 1991,
38:2320-2322.
5. Du YP, Zhang YW, Sun LD, Yan CH: Efficient energy transfer in
monodisperse Eu-doped ZnO nanocrystals synthesized from metal
acetylacetonates in high-boiling solvents. J Phys Chem C 2008,
112:12234-12241.
6. Tanabe S, Sugimoto N, Ito S, Hanada T: Broad-band 1.5 μm emission of
Er
3+
ions in bismuth-based oxide glasses for potential WDM amplifier. J
Luminesc 2000, 87:670-672.
7. DeLoach LD, Payne SA, Chase LL, Smith LK, Kway WL, Krupke WF:
Evaluation of absorption and emission properties of Yb
3+
doped crystals
for laser applications. IEEE J Quantum Electron 1993, 29:1179-1191.
8. Soukka T, Kuningas K, Rantanen T, Haaslahti V, Lovgren T: Photochemical
characterization of upconverting inorganic lanthanide phosphors as
potential labels. J Fluoresc 2005, 15:513-528.
9. Das GK, Yang-Tan TT: Rare-earth-doped and codoped Y
2
O
3
nanomaterials
as potential bioimaging probes. J Phys Chem C 2008, 112:11211-11217.
10. Xiao Q, Si Z, Yu Z, Qiu G: Sol-gel auto-combustion of samarium-doped
TiO
2
nanoparticles and their photocatalytic activity under visible light
irradiation. Mater Sci Eng B 2007, 137:189-194.
11. Liu Y, Luo W, Li R, Chen X: Optical properties of Nd
3+
ion-doped ZnO
nanocrystals. J Nanosci Nanotechnol 2010, 10:1871-1876.
12. Wakefield G, Holland E, Dobson PJ, Hutchison JL: Luminescence properties
of nanocrystalline Y
2
O
3
:Eu. Adv Mater 2001, 13:1557-1560.
13. Wang L, Li Y: Na(Y
1.5
Na
0.5
)F
6
single-crystal nanorods as multicolor
luminescent materials. Nano Lett 2006, 6:1645-1649.
14. Wang H, Lin CK, Liu XM, Lin J, Yu M: Monodisperse spherical core-shell-
structured phosphors obtained by functionalization of silica spheres
with Y
2
O
3
:Eu
3+
layers for field emission displays. Appl Phys Lett 2005,
87:181907-181909.
15. Luo M, Cheng K, Weng W, Song C, Du P, Shen G, Xu G, Han G: Enhanced
luminescence of Eu-doped TiO
2
nanodots. Nanoscale Res Lett 2009,
4:809-813.
16. Yin J, Xiang L, Zhao X: Monodisperse spherical mesoporous Eu-doped
TiO
2
phosphor particles and the luminescence properties. Appl Phys Lett
2007, 90:113112-113114.
17. Ningthoujama RS, Sudarsana V, Vatsaa RK, Kadam RM, Jagannath , Gupta A:
Photoluminescence studies on Eu doped TiO
2
nanoparticles. J Alloys
Compounds 2009, 486:864-870.
18. Rocha LA, Avila RL, Caetano BL, Molina EF, Sacco HC, Ciuffi KJ, Calefim PS,
Nassar E: Europium incorporated into titanium oxide by the sol-gel
method. Mater Res 2005, 8:361-364.
19. Zhao J, Duan H, Ma Z, Wang T, Chen C, Xie E: Temperature and TiO
2
content effects on the photoluminescence properties of Eu
3+
doped
TiO
2
-SiO
2
powders. J Appl Phys 2008, 104:053515-053515-5.
20. Li J-G, Wang X, Watanabe K, Ishigaki T: Phase structure and luminescence
properties of Eu
+3
doped TiO
2
nanocrystals synthesized by Ar/O
2
radio
frequency thermal plasma oxidation of liquid precursor mists. J Phys
Chem B 2006, 110:1121-1127.
21. Rubio MI, Ireland TG, Fern GR, Silver J, Snowden MJ: A new application for
microgels: novel methods for the synthesis of spherical particles of
Y
2
O
3
:Eu phosphor using a copolymer microgel of NIPAM and acrylic
acid. Langmuir 2001, 147:7145-7149.
22. Chi B, Victorio ES, Jin T: Synthesis of Eu-doped, photoluminescent titania
nanotubes via a two-step hydrothermal treatment. Nanotechnology 2006,
17:2234-2241.
23. Julian B, Corberan R, Cordoncillo E, Escribano P, Viana B, Sanchez C: One-
pot synthesis and optical properties of Eu
3+-
doped nanocrystalline TiO
2
and ZrO
2
. Nanotechnology 2005, 16:2707-2713.
24. Xu CY, Zhang PX, Yan L: Blue shift of Raman peak from coated TiO
2
nanoparticles. J Raman Spectroscopy 2001, 32:862-865.
25. Popa M, Diamandescu L, Vasiliu F, Teodorescu CM, Cosoveanu V, Baia M,
Feder M, Baia L, Danciu V: Synthesis, structural characterization, and
photocatalytic properties of iron-doped TiO
2
aerogels. J Mater Sci 2009,
44:358-364.
26. Ohsaka T: Temperature dependence of the Raman spectrum in anatase
TiO
2
. J Phys Soc Jpn 1980, 48:1661-1668.
27. Choi HC, Jung YM, Kim SB: Size effects in the Raman spectra of TiO
2
nanoparticles. Vibrational Spectrosc 2005, 37:33-38.
28. Wendlandt W, Hecht HG: Reflectance Spectroscopy New York: Wiley
Interscience; 1966.
29. Asahi R, Taga Y, Mannstadt W, Freeman AJ: Electronic and optical
properties of anatase TiO
2
. Phys Rev B 2000, 61:7459-7465.
Pal et al. Nanoscale Research Letters 2012, 7:1
/>Page 11 of 12
30. Kumar S, Jindal Z, Kumari N, Verma NK: Solvothermally synthesized
europium-doped CdS nanorods: applications as phosphors. J Nanopart
Res 2011, 13:5465-5471.
31. Yu J, Xiang Q, Zhou M: Preparation, characterization and visible-light-
driven photocatalytic activity of Fe-doped titania nanorods and first-
principles study for electronic structures. Appl Catalysis B: Environmetal
2009, 90:595-602.
32. Coronado D, Gattorno G, Pesqueira ME, Cab C, Coss R, Oskam G: Phase-
pure TiO
2
nanoparticles: anatase, brukite and rutile. Nanotechnology 2008,
19:145605-145615.
33. Frindell KL, Bartl MH, Popitsch A, Stucky GD: Sensitized luminescence of
trivalent europium by three-dimensionally arranged anatase
nanocrystals in mesostructured titania thin films. Angew Chem Int Ed
2002, 41:959-962.
34. Lei Y, Zhang LD: Fabrication, characterization and photoluminescence
properties of highly ordered TiO
2
nanowire arrays. J Mater Res 2001,
16:1138-1144.
35. Saraf LV, Patil SI, Ogale SB, Sainkar SR, Kshirsager ST: Synthesis of
nanophase TiO
2
by ion beam sputtering and cold condensation
technique. Int J Mod Phys B 1998, 12:2635-2647.
36. Serpone N, Lawless D, Khairutdinov R: Size effects on the photophysical
properties of colloidal anatase TiO
2
particles: size quantization versus
direct transitions in this indirect semiconductor. J Phys Chem 1995,
99:16646-16654.
37. Liu Y, Claus RO: Blue light emitting nanosized TiO
2
colloids. J Am Chem
Soc 1997, 119:5273-5274.
38. Zhang WF, Zhang MS, Yin Z: Microstructures and visible
photoluminescence of TiO
2
nanocrystals. Phys Stat Sol 2000, 179:319-327.
39. Ningthoujam RS, Sudarsan V, Godbole SV, Kienle L, Kulshreshtha SK,
Tyagi AK: SnO
2
:Eu
3+
nanoparticles dispersed in TiO
2
matrix: improved
energy transfer between semiconductor host and Eu
3+
ions for the low
temperature synthesized samples. Appl Phys Lett 2007, 90:173113-17115.
40. Li L, Tsung CK, Yang Z, Stucky GD, Sun LD, Wang JF, Yan CH: Rare-earth-
doped nanocrystalline titania microspheres via energy transfer. Adv
Mater 2008, 20:903-908.
41. Frindell KL, Bartl MH, Robinson MR, Bazan GC, Popitsch A, Stucky GD:
Visible and near IR luminescence via energy transfer in rare earth doped
mesoporous titania thin films with nanocrystalline walls. J Solid State
Chem 2003, 172:81-88.
42. Alejandre E, Torres M, Hipolito M, Frutis M, Flores G, Mendoza J, Falcony C:
Structural and luminescent properties of europium doped TiO
2
thick
films synthesized by the ultrasonic spray pyrolysis technique. J Phys D:
Appl Phys 2009, 42:095102-095109.
doi:10.1186/1556-276X-7-1
Cite this article as: Pal et al.: Effects of crystallization and dopant
concentration on the emission behavior of TiO
2
:Eu nanophosphors.
Nanoscale Research Letters 2012 7:1.
Submit your manuscript to a
journal and benefi t from:
7 Convenient online submission
7 Rigorous peer review
7 Immediate publication on acceptance
7 Open access: articles freely available online
7 High visibility within the fi eld
7 Retaining the copyright to your article
Submit your next manuscript at 7 springeropen.com
Pal et al. Nanoscale Research Letters 2012, 7:1
/>Page 12 of 12