Báo cáo hóa học: " Influence of grazing and precipitation on ecosystem carbon cycling in a mixed-grass prairie" potx
Bạn đang xem bản rút gọn của tài liệu. Xem và tải ngay bản đầy đủ của tài liệu tại đây (378.03 KB, 15 trang )
RESEARCH Open Access
Influence of grazing and precipitation on
ecosystem carbon cycling in a mixed-grass prairie
Rodney A Chimner
1*
and Jeffery M Welker
2,3
* Correspondence: rchimner@mtu.
edu
1
School of Forest Resources and
Environmental Science, Michigan
Technological University, 1400
Townsend Drive, Houghton, MI,
USA
Full list of author information is
available at the end of the article
Abstract
Grasslands sequester and store large amounts of soil carbon, which is primarily
controlled by herbivory and precipitation. However, few studies have examined the
combined effects of these two factors and quantified how they control carbon
cycling in temperate grasslan ds. The objective of this study was to quantify how
grazing intensity affects the magnitudes and patterns of net CO
2
exchange in the
mixed-grass prairie, the largest native grassland ecosystem in North America. The
study was conducted during two contrasting precipitation years (dry vs. wet
summer), which allowed inve stigation of the interaction between precipitation and
grazing intensity on the magnitudes and patterns of net CO
2
exchange. Our three
grazing regimes have been in place for 20 years and consist of light and heavy
grazing and ungrazed exclosures. Ecosystem CO
2
exchange rates were strongly
influenced by changes in summer precipitation. Decreasing summer precipitation
reduced ecosystem respiration (RE) by 45%, gross ecosystem pro duction (GEP) by
75%, and net ecosystem exchange (NEE) by 70%. The lightly grazed pastures had the
greatest rates of RE, GEP, and NEE during the wet summer; however, NEE did not
differ between grazing treatments in the dry summer. These results indicate that
grazing intensity and precipitation interact to influence carbon cycling on mixed-
grass prairie ecosystems.
Keywords: carbon cycling, carbon storage, plant production, grazing, grasslands,
precipitation
Background
Understanding the factors controlling the exchange of CO
2
between the biosphere and
theatmosphereandthesequestrationofcarbon(C)bylandscapeshasbecomeacen-
tral concern for science, polic y, and management (Follett et al. 2000; Kaiser 2000;
Schulze et al. 2000; Sims et al. 2008; Morgan et al. 2010; Polley et al. 2010). These con-
cerns have emerged because changes in climate, due to anthropogenic increases in
atmospheric CO
2
concentrations, is altering the fluxes of trace gases and the sequestra-
tion of C by terrestrial ecosystems (Amthor et al. 1998; Wofsy and Harriss 2002).
Grasslands represent more than 40% of the global landscape, accrue and store large
amounts of soil C, and are influ enced by precipitation and grazing intensity (Sala et al.
1988; Amthor et al. 1998; Flanagan et al. 2002; Fay et al. 2008). Consequently, it is
vital that we develop a better understanding of the patterns and magnitudes of CO
2
exchange between grasslands and the atmosphere and how those exchanges may be
influenced by grazing regimes and precipitation. In particular, more carbon cycling
Chimner and Welker Pastoralism: Research, Policy and Practice 2011, 1:20
/>© 2011 Chimner and Welker; l icensee Springer. This is a n Open Access article distributed und er the terms of the Creative Commons
Attribution License ( which permits unrestricted use, distribution, and reproduction in
any medium, provided the original work is properly cited.
knowledge is needed for t he mixed-grass prairie, especially in the USA, because it is
the largest grassland ecosystem in the Great Plains, encompassing 38% of the grassland
area in North America (Lauenroth 1979; Ganjegunte et al. 2005; Ingram et al. 2008).
Net CO
2
exchange and C sequestration is the net effect of C fixation by plants, het-
erotrophic and autotrophic respiration, and soil C storage. All of these processes are
potentially sensitive to land use such as grazing intensity (Schuman et al. 1999; LeCain
et al. 2000; Welker et al. 2004a; Ingram et al. 2008), abiotic factors such as precipita-
tion or temperature (Briggs and Knapp 1995; Chimner and Welker 2005; Bradford et
al. 2006; Chimner et al. 2010; Polley et al. 2010), and soil nitrogen (N) processes
(Schulze et al. 2000). However, our understanding of how these factors directly and
indirectly affect the magnitudes and patterns of CO
2
exchange on rangelands is still
rudimentary (Kelly et al. 2002; Smith et al. 2002; Hunt et al. 2004) and requires quanti-
fication if we are to develop realistic and effective C management options on range-
lands (Allen-Diaz 1996; Kaiser 2000; Wofsy and Harriss 2002; Ingram et al. 2008).
Herbivory and precipitation are tw o of th e most important factors that affect the
structure and function of grasslands (Knapp et al. 2002; Bradford et al. 2006). Grass-
lands i n the USA were historically grazed by native ungulates (bison), but have been
primarily grazed by domestic livestock (mostly cattle) during the past 50 to 150 years
(Hart et al. 1988). Livestock densities, however, have not been uniform and thus differ-
ent intensities of animal use have been imposed on grasslands. Grazing intensity affects
a suite of ecological and biogeochemical processes and properties, such as plant com-
munity composition (Derner and Hart 2007), soil physical properties (Ganjegunte et al.
2005; Piñeiro et al. 2010), soil C and N contents (Schuman et al. 1999; Welker et al.
2004a; Ingram et al. 2 008; Piñeiro et al. 2010), and magnitudes of CO
2
exchange
(LeCain et al. 2000; Welker et al. 2004a). However, the interaction between various
grazing intensities under different precipitation regimes is not fully understood (Svejcar
et al. 2008).
Grassland precipitation amounts, patterns, and forms vary from year to year (Fay et
al. 2000; Fay et al. 2002; Knapp et al. 2001; Flanagan et al. 2002; Morecroft et al. 2004 ;
Heisler-White et al. 2008; Tagir et al. 2010). Differences in preci pitation amounts and
patterns between y ears are especially important because rainfall and associated soil
water properties are important c ontrol s on C exchange (Flan agan et al. 2002; Ha rper
et al. 2005), and because they determine whether terrestrial ecosystems are annual C
sources or sinks to the atmosphere (Schimel et al. 2000; Zhang et al. 2010). However,
grazing intensity, which alters plant community composition, production, and soil
properties, can modify how precipitation influences the magnitude and pattern of
grassland C cycling (Schuman et al. 1999; Ingram et al. 2 008). The main objective of
this project was to quantify how grazing intensity affects the magnitudes and patterns
of net CO
2
exchange and its constituents (gross ecosystem production and ecosystem
respiration) in a mixed-grass prairie. However, the study was conducted during two
contrasting precipitation years (dry vs. wet summer), which allows us to investigate the
interaction between precipitation and grazing intensity on the magnitudes and patterns
of net CO
2
exchange. This study was conducted as part of an interdisciplinary project
that addressed multiple facets of C cycling in the mixed-grass prairie (Ganjegunte et al.
2005; Ingram et al. 2008).
Chimner and Welker Pastoralism: Research, Policy and Practice 2011, 1:20
/>Page 2 of 15
Methods
Study areas
Our study was conducted at the USDA-ARS High Plains Grasslands Research Station
(HPGRS), west of Cheyenne, Wyoming, located at the southern end of the mixed-grass
prairie of North America (41°N, 104°W) (Schuman et al. 1999; LeCain et al. 2000). The
elevation at the HPGRS averages 1,930 m with a mean annual precipitation of 380 mm
and an average of 127 frost-free days. The average summer temperature is 18°C and
the average winter temperature is -2.5°C. The major cool-season (C
3
) grasses on the
site are western wheatgrass (Pascopyrum smithii (Rydb) A. Love) and needle-and-
thread grass ( Hesperostipa comata (Trin. & Rupr. ) Barkworth ssp. comata). The dom i-
nant warm-season (C
4
) grass is blue grama (Bouteloua gracilis (H.B.K.)). The soils are
mixed, mesic, Aridic Argiustolls, with the soil series being an Ascalon sandy loam
(Schuman et al. 1999). Our studies were limited to the Ascalon soil type, which is
representative of more than 50% of the soils in the mixed-grass prairie.
Three grazing treatments have been in place at the s ite since 1982 and consist of a
light stocking rate (21.6 steer-days ha
-1
), heavy stocking rate (62.7 steer-days ha
-1
) and
no grazing (Schuman et a l. 1999; LeCain et al. 2000). The heavy and light grazing
treatments consisted of continuous season-long (early June to mid-October) grazing by
livestock. The light grazing and heavy grazing treatments each occurred in two repli-
cate pastures that are about 50 ha each with gently rolling terrain. Each lightly grazed
pasture has a representative ungrazed exclosure (0.5 ha). Before the initiation of graz-
ing treatments, the site had not been grazed by livestock for 40 years.
Carbon dioxide exchange measurements
Carbon d ioxide exchange patterns were quantified by taking measurements during the
growing (snow free) seasons from May 2002 to December of 2003. CO
2
exchange rates
were determined with an infrared gas analyzer (Licor, LI-6200, Lincoln, NE, USA) con-
nected to a clear chamber (50 × 50 × 40 cm) with several small fans continuously mix-
ing air in the chamber during measurements (Vourlitis et al. 1993; Chimner et al.
2010), which w as placed over pre-selected plots at the t ime of each measurement. All
chamber measurements (5 plots per pasture/exclosure for a total of 30 plots) were
conducted in the three grazing treatments on the same days to minimize differences
between days. Soil temperatures at 5 cm were also measured with a standard soil ther-
mometer at the beginning of each measurement. Diel measurements we re conducted
throughout the day (it took about 2 h to complete one round of gas sampling), starting
at predawn and ending at nightfall, roughly every 4 to 6 h. Sampling occurred about
every 1 to 4 weeks during the snow-free season. Flux rates were calculated by measur-
ing the change in CO
2
concentration s within the chamber (Vourlitis et al. 1993). After
placement of the chamber, no measurements were taken until a steady mixing
occurred and CO
2
concentration in the chamber started increasing or decreasing at a
constant rate (typically 20 to 30 s). After steady mixing occurred, measurement of net
ecosystem exchange (NEE) commenced and lasted for about 1 to 2 min. The rapid
measurements minimized temperature and water vapor increases in the chamber
(Vourlitis et al. 1993). The chamber was briefly opened to ambient air (20 to 30 s)
after the NEE measurement and then replaced and covered with an opaque cloth to
prevent photosynthesis, allowed to mix, and measurements of ecosystem respiration
Chimner and Welker Pastoralism: Research, Policy and Practice 2011, 1:20
/>Page 3 of 15
(RE) commenced (Chimner et al. 2010). Gross ecosystem production (GEP) was then
subsequently calculated by subtracting the RE rates from the NEE rates. Since we mea-
sured ecosystem flux over 24-h periods, we were able to calculate a daily value by line-
ally interpolating between the time periods.
Plant biomass and physiological ecology
Total plant biomass was harvested on 3 July 2003 from five plots (20 × 50 cm) from
each pasture and pooled by treatment. All vegetation in each quadrat was harvested to
the soil surface and separated into grass and forb components. Green leaves were sepa-
rated from dead leaves and stems, all vegetation was oven-dried at 60°C for 48 h, and
total biomass was measured to the nearest 0.1 g.
Leaf Area Index (LAI) was measured on 3 July 2003 with a SunScan Canopy Analysis
System (Dynamax, Houston, TX, USA) that mea sures the direct and diffuse compo-
nents of light simultaneously above and within the canopy to calculate LAI. Twenty
random measurements were taken during the late morning/ea rly afternoon in each
replicated treatment for a total of 120 measurements. T here were no clouds in the sky
and no significant differences in incident light between samples. Treatments were
pooled for analysis.
Statistical analysis
A repeated-measures, split-plot analysis of variance was conducted using PROC
MIXED to test for experimental differences in ecosystem CO
2
exchange rates (SAS
Institute, Inc. 2009). Replicate chamber measurements were averaged by plot for each
year of analysis. Analysis was conducted by year, using pasture × grazing intensity
interactions as the r andom effects, grazing intensity, pasture, year and all possible
interactions were treated as fixed effects, and date as a repeated measure. We used
compound symmetry structure for repeated-measures analysis as determined by look-
ing at the fit statistics and the Kenward and Roger’s correcti on for degrees of freedom
(Littell et al. 2006). An analysis of varian ce was also conducted for LAI and plant bio-
mass using PROC MIXED (SAS Institute, Inc. 2009). Differences between all treat-
ments were conducted using Tukey’ s post hoc test with diffe rences at P <0.05
considered significant.
Results
Canopy characteristics
The ungrazed treatment had significantly greater LAI compared to the heavily grazed
treatment, but no significant differences were observed in live or dead forbs, litter, or mis-
cellaneous biomass among treatments (Table 1). There was, however, greater mass of live
Table 1 LAI (3 July 2003) and plant biomass components during 2003
Biomass components (g m
-2
)
Forbes Grass
LAI Dead Live Dead Live Lichens Litter Misc. Total
HG 0.15
a
0.97 3.96 3.20
a
3.46
a
0.66
a
28.58 1.58 42.42
LG 0.225
ab
1.91 4.18 5.63
ab
5.28
ab
0.35
ab
21.56 1.69 40.66
UG 0.45
b
2.10 2.21 6.98
b
6.88
b
0.05
b
27.93 1.04 47.19
HG, heavily grazed; LG, lightly grazed; UG, ungrazed treatment. Letters denote significant differences between treatment
averages (P < 0.05).
Chimner and Welker Pastoralism: Research, Policy and Practice 2011, 1:20
/>Page 4 of 15
and dead grass in the ungrazed plots compar ed to the heavily grazed plots. The heavily
grazed plots had significantly (P < 0.05) greater lichen biomass compared to the ungrazed
plots. Total plant mass did not differ between grazing treatments during 2003.
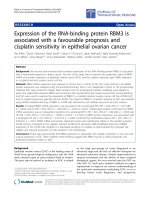
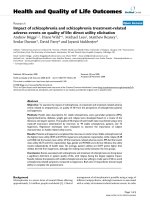
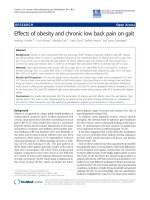
Soil temperatures were also slightly modified by grazing intensity (Figure 1). Soil
temperature differences were most pronounced in the daytime hours with heavy
Date
5/1/2002 6/1/2002 7/1/2002 8/1/2002
Avg. Daily Soil Temperature (C)
10
15
20
25
30
35
Heavy Grazing
Light Grazing
Ungrazed
D
ate
6/1/2003 7/1/2003 8/1/2003 9/1/200
3
Avg. Daily Soil Temperature (C)
14
16
18
20
22
24
26
28
30
32
Heavy Grazing
Light Grazing
Ungrazed
A
B
Figure 1 Daily mean soil temperature (5 cm depth) for all grazing intensities. During summer of (A)
2002 and (B) 2003. Soil temperatures were taken at the same time as ecosystem carbon flux
measurements.
Chimner and Welker Pastoralism: Research, Policy and Practice 2011, 1:20
/>Page 5 of 15
grazing, light grazing, and the ungrazed pastures averaging 23.6°C, 22.4°C, 21.1°C over
the 2 years, respectively.
Ecosystem carbon cycling
Grazing intensity, pasture, and year were significant factors in the ANOVA for ecosys-
tem C cycling (Table 2). The most significant factor affecting NEE, GEP, and RE was
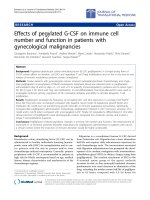
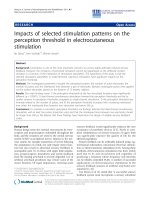
year (Table 2). Total precipitation amounts varied between 2002 and 2003 with a total
of 243 and 322 mm, respectively (Figure 2). Total precipitati on in 2002 was the nin th
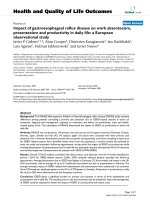
lowest in 71 years of record, while 2003 was close to average. The driest part of 2002
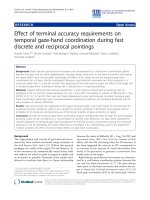
was in the spring and early summer (Figure 3). Total precipitation for April, May, and
June combined was the fifth driest (69 mm), while the sam e period in 2003 was above
average (152 mm). Although early 2002 was very dry, average precipitation in July,
August, and September was near average. Conversely, early 2003 was very wet, but July
and August were below average.
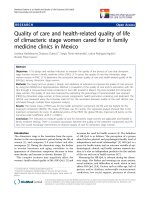
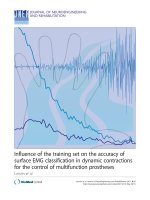
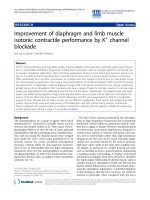
The large differences in summer precipitation greatly influenced NEE, GEP, and RE
(Figure 4). Daily v alues of NEE were below zero for the entire summer of 2002. The
dry conditions in 2002 also suppressed both GEP and RE. Maximum GEP values were
just above 1 g C m
-2
day
-1
during early 2002 and decreased as the summer progressed
and soils further dried out. RE also tracked soil moisture as the highest rates occurred
in May and declined during the rest of the summer, with a subsequent increase in
September.
Rates of NEE in 2003 varied greatly from both 2002 and from early to late summer
2003 (Figure 4). NEE values peaked at 2.5 g C m
-2
day
-1
during mid-June, in 2003 and
then declined to -3 g C m
-2
day
-1
during early August. GEP peaked in mid-June (6 g C
m
-2
day
-1
) in 2003 and then declined steadily throughout the remainder of the summer
to near zero. However, GEP increased in the fall of 2003 up to 2 g C m
-2
day
-1
. RE was
most negative in mid-J une 2003, reaching values to -6 g C m
-2
day
-1
. RE also declined
through the summer except for a high reading on July 30, which occurred immediately
after a precipitation event.
Diel patterns of NEE changed between and within years due to precipitation (Figure
5). On 30 May in 2002 and 2003, NE E was positi ve by early morning and remained
positive throughout the daylight period. On 24 June 2002 NEE was positive only dur-
ing the early morning measurement with negative values of NEE during the rest of the
day. NEE was positive most of the day on 24 June 2003. On 15 July, 2002, extremely
dry conditions resulted in negative NEE the entire day with the most negative values
Table 2 Repeated-measures ANOVA testing interactive effects of grazing intensity,
pasture and year for NEE, RE, GEP
Effect Number Density NEE GEP RE
DF DFFPFPFP
Intensity (I) 2 44 3.85 0.03 1.81 0.18 4.46 0.02
Pasture (P) 1 44 12.58 < 0.01 4.02 0.05 0.01 0.93
I × P 2 44 6.72 < 0.01 10.66 < 0.01 5.53 < 0.01
Year (Y) 1 44 117.32 < 0.01 410.80 < 0.01 346.68 < 0.01
Y × I 2 44 3.56 0.04 6.32 < 0.01 4.19 0.02
Y × P 1 44 0.38 0.54 6.50 0.01 15.10 < 0.01
Y × I × P 2 44 7.61 < 0.01 7.10 < 0.01 2.38 0.11
NEE, net ecosystem exchange; RE, ecosystem respiration; GEP, gross ecosystem production.
Chimner and Welker Pastoralism: Research, Policy and Practice 2011, 1:20
/>Page 6 of 15
during mid-day. Although conditions in 2003 were not as dry as 2002, NEE was only
positive during the early morning period and was negative the rest of the day. Diel pat-
terns of GEP and RE are not shown, but generally mirrored NEE patterns.
Across the 2 years of measurements, grazing intensity significantly influenced NEE (P
= 0.03) and RE (P = 0.02), but not GEP (P = 0.18; Table 2). The grazing intensity ×
pasture and grazing intensity × year interactions were also significant for NEE, RE, and
GEP. The pasture treatment was also significan t for NEE and GEP. T he two ungrazed
enclosures had significantly different NEE (P <0.01)andGEP(P = 0.03) rates (data
not shown). The two lightly grazed pastures also had significantly different NEE (P <
0.01) and GEP (P < 0.01) rates. How ever, there were no significant differences between
the two heavily grazed pastures.
Average carbon fluxes underscored t he large interannual differences in our study
(Figure 6). Average NEE was negative (losing carbon) for all three grazing treatments
in 2002, but was positive in 2003. This was due in a large part to increases in GEP
during 2003. In 2003, the lightly grazed treatment was significantly greater than both
the ungrazed and heavy grazing treatments f or RE and GEP, while NEE was signifi-
cantly greater compared to the ungrazed treatments.
Discussion
Timing and amount of p recipitation had a stron g influence on ecosystem carbon
fluxes. Decreasing summer precipitation reduced RE by 45%, GEP by 75%, and NEE by
70%. This reduction in 2002 was primarily due to a very dry spring and early summer
that inhibited plant growth. There were no summer air temperature differences
between the 2 years as they both averaged 10.5°C in 2002 and 2003.
This result is not unexpected as water is a major limiting factor ingrasslands(e.g.,
Knapp et. al 2001; Epstein et al. 2002; Köchy and Wilson 2004; Henry et al. 2006;
D
a
t
e
1/1/02 5/1/02 9/1/02 1/1/03 5/1/03 9/1/03 1/1/04
Daily temperature (C)
-30
-20
-10
0
10
20
30
Dail
y
Precipitation
(
mm
)
0
5
10
15
20
25
30
3
5
Figure 2 Average air and precipitation values. 2002 precipitation = 242.8 mm total and 79 mm April 1
to August 31. 2003 precipitation = 322.3 mm total and 214 mm April 1 to August 31).
Chimner and Welker Pastoralism: Research, Policy and Practice 2011, 1:20
/>Page 7 of 15
Polley et al. 2010). Precipitation influences NEE by controlling r ates of both G EP and
RE (Flanagan et al. 2002; Harper et al. 2005; Bachman et al. 2009; Zhang et al. 2010).
Dry conditions reduce plant production by forcing plants to regulate their stomata,
reducing photosynthetic uptake (Grant and Flanagan 2007) and thus GEP, as we
observed in 2002 Bachman et al. (2009) also showed reductions in GEP with soil dry-
ing ( intraseasonal) during an adjoining experiment on the H PGRS. However, it is not
clear whether their elevated CO
2
conditions ameliorated this reduction in GEP because
the elevated CO
2
treatment was combined with frequent watering, thus the sole effect
of elevated CO
2
on GEP was not measured or reported. Lowered microbial decomposi-
tion of or ganic matter has al so been found to reduce RE in dry conditions (Milchunas
et al. 1994; Knapp et al. 2001; Harper et al. 2005; Zhou et al. 2008). Under more favor-
able soil water c onditions where GEP increases, a concomitant increase in RE occurs
likely due to greater plant and soil respiration associated with greater root exudation
and C substrate availability to microbes (Holland et al. 1996).
Carbon cycling in grasslands has been found to respond not only to total precipita-
tion (Lauenroth and Sala 1992; Milchunas et al. 1994; Bradford et al . 2006), but also to
the frequency and timing of precipitation (Fay et al. 20 00; Flanagan et al. 2002; Kn app
et al. 2002; Nippert et al. 2006; Bachman et al. 2009; Chimner et al. 2010; Wiles et al.
2011). For instance, Flanagan et a l. (2002) found that mix ed-grass prairie r apidly
became a net C sink with higher rates of GEP when the spring was wet, compared to
normal or dry precipitation years. Similar to the findings in this study, plant produc-
tion and NEE have been found to be controlled by spring precipitation rates across
Northern Great Plains (Zhang et al. 2011; Wiles et al. 2011). Greater spring
M
O
NTH
S
Monthly Precipitation
(
mm
)
0
20
40
60
80
Average
2002
2003
MAY
JUNE
JULY AUG SEPAPRIL
Figure 3 Mont hly precipitation val ues during the growing season for 2002 and 2003.Average
monthly precipitation is 70 year average (1939-2009).
Chimner and Welker Pastoralism: Research, Policy and Practice 2011, 1:20
/>Page 8 of 15
NEE (gC m
-
2
day
-
1
)
-3
-2
-1
0
1
2
3
GEP (gC m
-2
day
-1
)
0
1
2
3
4
5
6
7
D
a
t
e
5/1/02 7/1/02 9/1/02 11/1/02 1/1/03 3/1/03 5/1/03 7/1/03 9/1/03
RE gC m
-
2
day
-
1
)
-6
-5
-4
-3
-2
-1
0
1
Heavy Grazing
Light Grazing
Ungrazed
Figure 4 Integrated daily ecosystem fluxes for N EE, ER, and GEP for all years and grazing
intensities.
Chimner and Welker Pastoralism: Research, Policy and Practice 2011, 1:20
/>Page 9 of 15
precipitation was found to i ncrease plant production more than RE, increasing carbo n
storage. When precipitation is reduced or there are greater intervals between precipita-
tion events, GEP is reduced more than RE and carbon is lost (Zhang et al. 2010). Late
summer dry periods, such as seen in 2003, seem to be less important for carbon sto-
rage than early season dry periods. However, not all species or grassland ecosystems
respond the same to changes in precipitation (Morecroft et al. 2004; Köchy and Wilson
2004; Nippert and Knapp 2007). Recently, Polley et al. (2010) have termed these
responses as being functional changes in NEE as they represent a shift in the cascading
mechanisms of C cycling-precipitation regimes altering canopy conditions (leaf area,
biomass) which in turn controls ecosystem scale C fixation and or C efflux. T hese
functional differences may or may not be accompanied by differences in ecosystem C
cycling associated with changes in leaf N, and thus inherent photosynthetic capacity
per unit leaf area (Flanagan et al. 2002).
Grazing treatments exhibited only minor differences in overall ecosystem carbon flux
rates compared to precipitation effects during our study period. This agrees with other
studies that have found that water availability is more important than grazing intensity
in grassland carbon cycling (e.g., Risch and Frank 2006). However, we did find interac-
tive effects of grazing intensity × pastures and years on ecosystem carbon fluxes.
May 30, 2002
400 600 800 1000 1200 1400 1600 1800 2000 2200 2400
NEE (umol m
-2
s
-1
)
-1.0
-0.5
0.0
0.5
1.0
1.5
2.0
2.5
July 15, 2002
400 600 800 1000 1200 1400 1600 1800 2000 2200 2400
NEE (umol m
-2
s
-1
)
-1.6
-1.4
-1.2
-1.0
-0.8
-0.6
-0.4
-0.2
June 24, 2002
400 600 800 1000 1200 1400 1600 1800 2000 2200 2400
NEE (umol m
-2
s
-1
)
-1.4
-1.2
-1.0
-0.8
-0.6
-0.4
-0.2
0.0
0.2
0.4
0.6
0.8
June 4, 2003
400 600 800 1000 1200 1400 1600 1800 2000 2200 2400
NEE (umol m
-2
s
-1
)
-4
-3
-2
-1
0
1
2
3
June 24, 2003
400 600 800 1000 1200 1400 1600 1800 2000 2200 2400
NEE (umol m
-2
s
-1
)
-4
-2
0
2
4
6
8
10
12
July 15, 2003
400 600 800 1000 1200 1400 1600 1800 2000 2200 2400
NEE (umol m
-2
s
-1
)
-1.5
-1.0
-0.5
0.0
0.5
1.0
Continuous heavy grazing
Continuous light grazing
Ungrazed exclosure
Figure 5 Diel NEE fluxes during selected dates in the summer of 2002 and 2003.
Chimner and Welker Pastoralism: Research, Policy and Practice 2011, 1:20
/>Page 10 of 15
2002 2003
NEE (
u
mol CO
2
m
-2
s
-1
)
-1.0
-0.5
0.0
0.5
1.0
1.5
2
.
0
2002 2003
GEP (
u
mol CO
2
m
-2
s
-1
)
0
1
2
3
4
5
6
Heavy Grazing
Light Grazing
Ungrazed
Y
ea
r
2002 2003
RE (
u
mol CO
2
m
-2
s
-1
)
-5
-4
-3
-2
-1
0
*
*
*
*
*
A
*
A
*
B
A
*
A
*
B
A
A
B
AB
A
B
Figure 6 Daytime (GEP > 0) instantaneous ecosystem carbon fluxes averaged by year. Letters
denote significant differences between treatments and asterisk denotes significant differences between
years, both at P < 0.05.
Chimner and Welker Pastoralism: Research, Policy and Practice 2011, 1:20
/>Page 11 of 15
During the dry summer of 2002, the ungrazed grasslands had great er RE compared to
the heavily grazed treatment. However, in the wetter summer of 2003, the lightly
grazed pastures had greater RE, GEP, and NEE rates. Our results are similar to those
of LeCain et al. (2000) who found that the lightly grazed areas tended to have greater
CO
2
exchange rates in wetter than drier years . Milchunas et al. (1994) found that dur-
ing dry y ears, net primary production decreased more in heavily grazed compared to
lightly grazed grasslands, but in wet years, lightly grazed grasslands had higher rates of
net primary production than heavily grazed pastures.
One of the key aspects of studying ecosystem responses to either environmental
changes (i.e., warming or changes in precipitation) or differences in land use (i.e., graz-
ing regimes) is whether there are initial, transitory, and/or regime shifts to new stable
states (Briske e t al. 2006). We propose that the lightly grazed system has begun to
reach a C cycling equilibrium as the soil C pools have not changed significantly since
the s oil C pool analysis of these pastures in 1993 (Schuman et al. 1999; Ingram et al.
2008). To the contrary, the ungrazed and the heavily grazed system s continue to show
soil C loss (Ingram et al. 2008). These dif ferences in soi l C sequestration trajectories
are similar to those reported by Welker et al. (2004a) whereby grazing regimes in an
alpine grassland of Wyoming are dictating soil C sequestration though intraannual var-
iation in weather may dictate oscillations in the magnitudes of GEP, RE, and NEE.
Interestin gly, we found a strong pasture effect in the lightly grazed treatments,
including the ungrazed exclosures, which are located within the lightly grazed pastures.
Wedidnotfindadifferencebetweentheheavilygrazedpastures.Thissuggeststhat
our two heavily grazed pastures were more similar than our lightly grazed pastures due
possibly to higher stocking densities and more uniform vegetation removal or to origi-
nal soil properties, initial vegetation composition or slope and aspect which can affect
inherent soil water properties.
One of the greatest challeng es in grassland carbon biogeochemical studies is linking
shorter -term C exchange measurements with integrative C measurements such as soil
C pools and traits (Welker et al. 2004b; 2005). Because soil C processes integrate
across interannual variation in weather and reflect the net effect of decadal processes
of C gain by plants, C loss by respiration, and C transfor mations in the soil into labile
and recalcitrant forms. For instance, Ingram e t al. (2008 ) found that in these same
experimental plots that lightly grazed pastures had 13.8 Mg ha
-1
, heavily grazed pas-
tures had 10.9 Mg ha
-1
and the ungrazed treatment had 10.8 Mg ha
-1
SOC. The higher
rates o f GPP in the lightly grazed treatments in conjunction with the higher rates of
NEE if maintained year after year, regardless of precipitation regimes would lead to
these higher soil carbon pools. The larger soil C pools were also associated with higher
total soil N with 1.22 Mg ha
-1
,0.94Mgha
-1
, and 0.94 Mg ha
-1
N under lightly grazed,
heavily grazed and ungrazed treatments, respectively.
Conclusions
Our study found that ecosystem CO
2
exchange rates were strongly influenced by
changes in summer precipitation. Decreasing summ er precipitation reduced RE by
45%, GEP by 75%, and NEE by 70%. The lightly grazed pa stures had the greatest rates
of RE, GEP, and NEE during the normal precipitation year; however, NEE did not dif-
fer between grazing treatments in the dry year. These results indicate that grazing
Chimner and Welker Pastoralism: Research, Policy and Practice 2011, 1:20
/>Page 12 of 15
intensity and precipitation interact to influence carbon cycling on mixed-grass prairie
ecosystems.
Acknowledgements
We would like to thank Lisa Walsh and Derek Esposito for help with fieldwork and ARS personnel for logistical help.
This manuscript was also improved by the editing of anonymous reviewers. A National Research Initiative-USDA #
2001-35107-11327 award to JMW supported this research.
Author details
1
School of Forest Resources and Environmental Science, Michigan Technological University, 1400 Townsend Drive,
Houghton, MI, USA
2
Environment and Natural Resources Institute, University of Alaska Anchorage, Anchorage, AK, USA
3
Biology Department, University of Alaska Anchorage, Anchorage, AK, USA
Authors’ contributions
JW designed the project and helped draft the manuscript. RC participated in its design and coordination of the
project, performed the statistical analysis, and helped draft the manuscript. All authors read and approved the final
manuscript.
Competing interests
The authors declare that they have no competing interests.
Received: 19 April 2011 Accepted: 20 October 2011 Published: 20 October 2011
References
Allen-Diaz, B. 1996. Rangelands in a changing climate: Impacts, adaptations and mitigation. In Climate change 1995. Impacts,
adaptations and mitigation of climate change: Scientific-technical analyses, ed. Watson RT, Zinyowera MC, Moss RH,
Dokken DJ, 131–158. England: Cambridge Press.
Amthor, JS, and Members of the Ecosystems Working Group. 1998. Terrestrial ecosystem responses to global change: A
research strategy. ORNL Technical Memorandum 1998/27, 37. Oak Ridge, Tennessee: Oak Ridge National Laboratory.
Bachman, S, JL Heisler-White, E Pendall, DG Williams, JA Morgan, and J Newcomb. 2009. Elevated carbon dioxide alters
impacts of precipitation pulses on ecosystem photosynthesis and respiration in a semi-arid grassland. Oecologia
162:791–802.
Bradford, JB, WK Lauenroth, IC Burke, and JM Paruelo. 2006. The influence of climate, soils, weather, and land use on primary
production and biomass seasonality in the US Great Plains. Ecosystems 9:934–950. doi:10.1007/s10021-004-0164-1.
Briggs, JM, and AK Knapp. 1995. Interannual variability in primary production in tallgrass prairie: Climate, soil moisture,
topographic position, and fire as determinants of aboveground biomass. American Journal of Botany 82:1024–1030.
doi:10.2307/2446232.
Briske, DD, SD Fuhlendorf, and FE Smeins. 2006. A unified framework for assessment and application of ecological
thresholds. Rangeland Ecology and Management 59:225–236. doi:10.2111/05-115R.1.
Chimner, RA, and JM Welker. 2005. Ecosystem respiration responses to changes in climate in the mixedgrass prairie.
Biogeochemistry 73:257–270. doi:10.1007/s10533-004-1989-6.
Chimner, RA, JM Welker, J Morgan, D LeCain, and J Reeder. 2010. Experimental manipulations of winter snow and summer
rain influence ecosystem carbon cycling in a mixed-grass prairie, Wyoming, USA. Ecohydrology.
Derner, JD, and RD Hart. 2007. Grazing induced modifications to peak standing crop in northern mixed-grass prairie.
Rangeland Ecology and Management 60:270–276. doi:10.2111/1551-5028(2007)60[270:GMTPSC]2.0.CO;2.
Epstein, HE, IC Burke, and WK Lauenroth. 2002. Regional patterns of decomposition and primary production rates in the U.S.
Great Plains Ecology 83:320–327.
Fay, PA, JD Carlisle, AK Knapp, JM Blair, and SL Collins. 2000. Altering rainfall timing and quantity in a mesic grassland
ecosystem: Design and performance of rainfall manipulation shelters. Ecosystems 3:308–319. doi:10.1007/s100210000028.
Fay, PA, DM Kaufman, JB Nippert, JD Carlisle, and CW Harper. 2008. Changes in grassland ecosystem function due to
extreme rainfall events: Implications for responses to climate change. Global Change Biology 14:1600–1608. doi:10.1111/
j.1365-2486.2008.01605.x.
Fay, PA, AK Knapp, JM Blair, JD Carlisle, BT Danner, and JK McCarron. 2002. Rainfall timing, soil moisture dynamics, and plant
responses in a mesic tallgrass prairie ecosystem. In Changing precipitation regimes and terrestrial ecosystems: A North
American perspective, ed. Weltzin JF, McPherson GR 147–165. Tucson, USA: University of Arizona Press.
Flanagan, L, LA Weaver, and PJ Carlson. 2002. Seasonal and interannual variation in carbon dioxide exchange and carbon
balance in a northern temperate grassland. Global Change Biology 8:599–615. doi:10.1046/j.1365-2486.2002.00491.x.
Follett, RF, JM Kimble, and R Lal. 2000. The potential of U.S. grazing lands to sequester carbon. In The potential of U.S.
grazing lands to sequester carbon and mitigate the greenhouse effect, ed. Follett RF, Kimble JM, Lal R 401–430. Boca
Raton, USA: Lewis Publishers.
Ganjegunte, GK, GF Vance, CM Preston, GE Schuman, LJ Ingram, PD Stahl, and JM Welker. 2005. Soil organic carbon
composition in a northern mixed-grass prairie: Effects of grazing. Soil Science Society of America Journal 69:1746–1756.
doi:10.2136/sssaj2005.0020.
Grant, RF, and LB Flanagan. 2007. Modeling stomatal and nonstomatal effects on CO
2
fixation in a semiarid grassland.
Journal of Geophysical Research 112:G03011.
Harper, CW, JM Blair, PA Fay, AK Knapp, and JD Carlisle. 2005. Increased rainfall variability and reduced rainfall amount
decreases soil CO
2
flux in a grassland ecosystem. Global Change Biology 11:322–334. doi:10.1111/j.1365-2486.2005.00899.
x.
Chimner and Welker Pastoralism: Research, Policy and Practice 2011, 1:20
/>Page 13 of 15
Hart, RH, MJ Samuel, PS Test, and MA Smith. 1988. Cattle, vegetation, and economic responses to grazing systems and
grazing pressure. Journal of Range Management 41:282–286. doi:10.2307/3899379.
Heisler-White, JL, AK Knapp, and EF Kelly. 2008. Large precipitation events increase aboveground net primary productivity in
semi-arid grasslands. Oecologia 158:129–140. doi:10.1007/s00442-008-1116-9.
Henry, HAL, NR Chiariello, PM Vitousek, HA Mooney, and CB Field. 2006. Interactive effects of fire, elevated carbon dioxide,
nitrogen deposition, and precipitation on a California annual grassland. Ecosystems 9:1066–1075. doi:10.1007/s10021-005-
0077-7.
Holland, JN, C Weixin, and DAJ Crossley. 1996. Herbivore-induced changes in plant carbon allocation: Assessment of below-
ground C fluxes using carbon-14. Oecologia 107:87–94. doi:10.1007/BF00582238.
Hunt, ER, RD Kelly, WK Smith, JT Fahnestock, JM Welker, and WA Reiners. 2004. Carbon sequestration in two rangeland
ecosystems from remote sensing and net ecosystem exchange. Environmental Management 33(supplement): S432–S441.
Ingram, LJ, PD Stahl, GE Schuman, JS Buyer, GF Vance, GK Ganjegunte, JM Welker, and JD Derner. 2008. Grazing and
Drought Affects on Carbon, Nitrogen and Microbial Communities in a Mixed Grass Prairie. Soil Science Society of
America Journal 72:939–948. doi:10.2136/sssaj2007.0038.
Kaiser, J. 2000. Soaking up carbon in forests and fields. Science 290:922. doi:10.1126/science.290.5493.922.
Kelly, RD, ER Hunt, WA Reiners, WK Smith, and JM Welker. 2002. Relationships between daytime carbon dioxide uptake and
absorbed photosynthetically active radiation for three different mountain/plains ecosystems. Journal of Geophysical
Research-Atmospheres 107:19.1–19.8.
Knapp, AK, JM Briggs, and JK Koelliker. 2001. Frequency and extent of water limitation to primary production in a mesic
temperate grassland. Ecosystems 4:19–28. doi:10.1007/s100210000057.
Knapp, AK, PA Fay, JM Blair, SL Collins, MD Smith, JD Carlisle, CW Harper, BT Danner, MS Lett, and JK Mccarron. 2002. Rainfall
variability, carbon cycling, and plant species diversity in a mesic grassland. Science 298:2202–2205. doi:10.1126/
science.1076347.
Köchy, M, and SD Wilson. 2004. Semiarid grassland responses to short-term variation in water availability. Plant Ecology
174:197–203.
Lauenroth, WK. 1979. Grassland primary production: North American grasslands in perspective. In Perspectives in grassland
ecology, ed. French NR, 3–24. New York: Springer.
Lauenroth, WK, and OE Sala. 1992. Long-term forage production of North American shortgrass steppe. Ecological
Applications 2:397–403. doi:10.2307/1941874.
LeCain, DR, JA Morgan, GE Schuman, JD Reeder, and RH Hart. 2000. Carbon exchange rates in grazed and ungrazed pastures
of Wyoming. Journal of Range Management 53:199–206. doi:10.2307/4003283.
Littell, RC, GA Milliken, WW Stroup, RD Wolfinger, and O Schabenberger. 2006. SAS for mixed models. North Carolina, USA:
SAS Institute Inc, Second.
Milchunas, DG, JR Forwood, and WK Lauenroth. 1994. Productivity of long-term grazing treatments in response to seasonal
precipitation. Journal of Range Management 47:133–139. doi:10.2307/4002821.
Morecroft, MD, GJ Masters, VK Brown, IP Clarke, ME Taylor, and AT Whitehouse. 2004. Changing precipitation patterns alter
plant community dynamics and succession in an arable grassland. Functional Ecology 18:648–655. doi:10.1111/j.0269-
8463.2004.00896.x.
Morgan, JA, RF Follett, L Hartwell Allen, S Del Grosso, JD Derner, F Dijkstra, A Franzluebbers, R Fry, K Paustian, and MM
Schoeneberger. 2010. Carbon sequestration in agricultural lands of the US. 2010. Journal of Soil and Water Conservation.
Nippert, JB, AK Knapp, and JA Briggs. 2006. Intra-annual rainfall variability and grassland productivity: Can the past predict
the future? Plant Ecology 184:65–74. doi:10.1007/s11258-005-9052-9.
Nippert, JB, and AK Knapp. 2007. Soil water partitioning as a mechanism for species coexistence in tallgrass prairie. Oikos
116:1017–1029. doi:10.1111/j.0030-1299.2007.15630.x.
Piñeiro, G, JM Paruelo, M Oesterheld, and EG Jobbágy. 2010. Pathways of Grazing Effects on Soil Organic Carbon and
Nitrogen. Rangeland Ecology and Management 63(1): 109–119. doi:10.2111/08-255.1.
Polley, HW, W Emmerich, JA Bradford, PL Sims, DA Johnson, NZ Saliendra, T Svejcar, R Angell, AB Frank, RL Phillips, KA
Snyder, and JA Morgan. 2010. Physiological and environmental regulation of interannual variability in CO
2
exchange on
rangelands in the western United States. Global Change Biology 16:990–1002. doi:10.1111/j.1365-2486.2009.01966.x.
Risch, AC, and DA Frank. 2006. Carbon dioxide fluxes in a spatially and temporally heterogeneous temperate grassland.
Oecologia 147:291–302. doi:10.1007/s00442-005-0261-7.
Sala, OE, WJ Parton, LA Joyce, and WK Lauenroth. 1988. Primary production of the central grassland region of the United
States. Ecology 69:40–45. doi:10.2307/1943158.
SAS Institute Inc 2009. JMP-IN ver. 9.2. Statistical analysis software. SAS Institute Inc., Cary, North Carolina.
Schimel, D, J Melillo, H Tian, AD McGuire, D Kicklighter, T Kittel, N Rosenbloom, S Running, P Thorton, D Ojima, W Parton, R
Kelly, M Sykes, R Neilson, and B Rizzo. 2000. Contribution of increasing CO
2
and climate to carbon storage by
ecosystems of the United States. Science 287:2004–2006. doi:10.1126/science.287.5460.2004.
Schulze, E, C Wirth, and M Heimann. 2000. Managing forests after Kyoto. Science 289:2058–2059. doi:10.1126/
science.289.5487.2058.
Schuman, GE, JD Reeder, JT Manley, RH Hart, and WA Manley. 1999. Impact of grazing management on the carbon and
nitrogen balance of a mixed-grass rangeland. Ecological Applications 9:65–71. doi:10.1890/1051-0761(1999)009[0065:
IOGMOT]2.0.CO;2.
Sims, DA, AF Rahman, VD Cordova, BZ El-Masri, DD Baldocchi, PV Bolstad, LB Flanagan, AH Goldstein, DY Hollinger, L Misson,
RK Monson, WC Oechel, HP Schmid, SC Wofsy, and L Xu. 2008. A new model of gross primary productivity for North
American ecosystems based solely on enhanced vegetation index and land surface temperature from MODIS. Remote
Sensing of the Environment 112:1633–1646. doi:10.1016/j.rse.2007.08.004.
Smith, WK, RD Kelly, JM Welker, JT Fahnestock, WA Reiners, and ER Hunt. 2002. Leaf-to-aircraft measurements of net CO
2
exchange in a sagebrush steppe ecosystem. Journal of Geophysical Research - Atmospheres 108(D3): 9.1–9.9.
Svejcar, T, R Angell, JA Bradford, W Dugas, W Emmerich, AB Frank, T Gilmanov, M Haferkamp, DA Johnson, H Mayeux, P
Mielnick, J Morgan, NZ Saliendra, GE Schuman, PL Sims, and K Snyder. 2008. Carbon fluxes on North American
rangelands. Rangeland Ecology and Management 61:465–474. doi:10.2111/07-108.1.
Chimner and Welker Pastoralism: Research, Policy and Practice 2011, 1:20
/>Page 14 of 15
Tagir, G, L Gilmanov, and Z Aires, and others. 2010. Productivity, Respiration, and Light-Response Parameters of World
Grassland and Agroecosystems Derived From Flux-Tower Measurements. Rangeland Ecology and Management 63:16–39.
doi:10.2111/REM-D-09-00072.1.
Vourlitis, GL, WC Oechel, SJ Hastings, and MA Jenkins. 1993. A system for measuring in situ CO
2
and CH
4
flux in unmanaged
ecosystems: An arctic example. Functional Ecology 7:369–379. doi:10.2307/2390217.
Welker, JM, JT Fahnestock, K Povirk, C Bilbrough, and R Piper. 2004a. Carbon and nitrogen dynamics in a long-term grazed
alpine grassland. Arctic, Antarctic and Alpine Research 36:10–19.
Welker, JM, JT Fahnestock, G Henry, K O’dea, and RA Chimner. 2004. CO
2
exchange in the Canadian High Arctic: Response to
long-term warming. Global Change Biology 10:1981–1995. doi:10.1111/j.1365-2486.2004.00857.x.
Welker, JM, JT Fahnestock, P Sullivan, and RA Chimner. 2005. Leaf mineral nutrition of arctic plants in response to long-term
warming and deeper snow in N. Alaska Oikos 109:167–177.
Wiles, LJ, G Dunn, J Printz, B Patton, and A Nyren. 2011. Spring precipitation as a predictor for peak standing crop of mixed-
grass prairie. Rangeland Ecology and Management 64:215–222. doi:10.2111/REM-D-09-00024.1.
Wofsy, SC, and RC Harriss. 2002. The North American Carbon Program (NACP). Report of the NACP Committee of the U.S.
Interagency Carbon Cycle Science Program. Washington, DC: US Global Change Research Program 75.
Zhang, L, BK Wylie, J Lei, TG Gilmanov, and LL Tieszen. 2010. Climate-Driven Interannual Variability in Net Ecosystem
Exchange in the Northern Great Plains Grasslands. Rangeland Ecology and Management 63:40–50. doi:10.2111/08-232.1.
Zhou, X, E Weng, and Y Luo. 2008. Modeling patterns of nonlinearity in ecosystem responses to temperature, CO
2
, and
precipitation changes. Ecological Applications 18:453–466. doi:10.1890/07-0626.1.
doi:10.1186/2041-7136-1-20
Cite this article as: Chimner and Welker: Influence of grazing and precipitation on ecosystem carbon cycling in a
mixed-grass prairie. Pastoralism: Research, Policy and Practice 2011 1:20.
Submit your manuscript to a
journal and benefi t from:
7 Convenient online submission
7 Rigorous peer review
7 Immediate publication on acceptance
7 Open access: articles freely available online
7 High visibility within the fi eld
7 Retaining the copyright to your article
Submit your next manuscript at 7 springeropen.com
Chimner and Welker Pastoralism: Research, Policy and Practice 2011, 1:20
/>Page 15 of 15