Báo cáo hóa học: " Pilot proof of concept clinical trials of Stochastic Targeted (STAR) glycemic control" docx
Bạn đang xem bản rút gọn của tài liệu. Xem và tải ngay bản đầy đủ của tài liệu tại đây (462.32 KB, 12 trang )
RESEARCH Open Access
Pilot proof of concept clinical trials of Stochastic
Targeted (STAR) glycemic control
Alicia Evans
1
, Geoffrey M Shaw
2
, Aaron Le Compte
1
, Chia-Siong Tan
1
, Logan Ward
1
, James Steel
1
,
Christopher G Pretty
1
, Leesa Pfeifer
2
, Sophie Penning
3
, Fatanah Suhaimi
1
, Matthew Signal
1
, Thomas Desaive
3
and
J Geoffrey Chase
1*
Abstract
Introduction: Tight glycemic control (TGC) has shown benefits but has been difficult to achieve consistently. STAR
(Stochastic TARgeted) is a flexible, model-based TGC approach directly accounting for intra- and inter- patient variability
with a stochastically derived maximum 5% risk of blood glucose (BG) < 4.0 mmol/L. This research assesses the safety,
efficacy, and clinical burden of a STAR TGC controller modulating both insulin and nutrition inputs in pilot trials.
Methods: Seven patients covering 660 hours. Insulin and nutrition interventions are given 1-3 hourly as chosen by the
nurse to allow them to manage workload. Interventions are calculated by using clinically validated computer models of
human metabolism and its variability in critical illness to maximize the overlap of the model-predicted (5-95
th
percentile)
range of BG outcomes with the 4.0-6.5 mmol/L band while ensuring a maximum 5% risk of BG < 4.0 mmol/L.
Carbohydrate intake (all sources) was selected to maximize intake up to 100% of SCCM/ACCP goal (25 kg/kcal/h).
Maximum insulin doses and dose changes were limited for safety. Measurements were made with glucometers. Results
are compared to those for the SPRINT study, which reduced mortality 25-40% for length of stay ≥3 days. Written informed
consent was obtained for all patients, and approval was granted by the NZ Upper South A Regional Ethics Committee.
Results: A total of 402 measurements were taken over 660 hours (~14/day), beca use nurses showed a preference
for 2-hourly measurements. Median [interquartile range, (IQR)] cohort BG was 5.9 mmol/L [5.2-6.8]. Overall, 63.2%,
75.9%, and 89.8% of measurements were in the 4.0-6.5, 4.0-7.0, and 4.0-8.0 mmol/L bands. There were no
hypoglycemic events (BG < 2.2 mmol/L), and the minimum BG was 3.5 mmol/L with 4.5% < 4.4 mmol/L. Per
patient, the median [IQR] hours of TGC was 92 h [29-113] using 53 [19-62] measurements (median, ~13/day).
Median [IQR] results: BG, 5.9 mmol/L [5.8-6.3]; carbohydrate nutrition, 6.8 g/h [5.5-8.7] (~70% goal feed median);
insulin, 2.5 U/h [0.1-5.1]. All patients achieved BG < 6.1 mmol/L. These results match or exceed SPRINT and clinical
workload is reduced more than 20%.
Conclusions: STAR TGC modulating insulin and nutrition inputs provided very tight control with minimal variability
by managing intra- and inter- patient variability. Performance and safety exceed that of SPRINT, which reduced
mortality and cost in the Christchurch ICU. The use of glucometers did not appear to impact the quality of TGC.
Finally, clinical workload was self-managed and reduced 20% compared with SPRINT.
Introduction
Stress-induced hyperglycemia often i s experienced in cri-
tically ill patients with increased morbidity and mortali ty
[1,2] i n this highly insulin resistant in this group of
patients [1-7]. Glycemic variability an d thus poor control
[8] are independently associated with increased mortality
[9,10]. Tight glycemic control (TGC) can significantly
reducetherateofnegativeoutcomesassociatedwith
poor control by modulating insulin and/or nutrition
administration [7,11,12], including reducing the rate and
severity of organ failure [13] and cost [14,15]. However,
safe, consistent, and effective TGC remains elusive with
several inconclusive studies [16-19]. There is little agree-
ment on the definition of desirable glycemic performance
* Correspondence:
1
Department of Mechanical Engineering, Centre for Bio-Engineering,
University of Canterbury, Christchurch, New Zealand
Full list of author information is available at the end of the article
Evans et al. Annals of Intensive Care 2011, 1:38
/>© 2011 Evans et al; licensee Springer. This is an Open Access article distributed under the terms of the Creative Commons Attribution
License (http://creativecommons .org/licenses/by/2.0), which permits unrestricted use, distribution, and reproduction in any medium,
provided the original work is properly cited.
[20-22], particularly with regard to how TGC may affect
outcome.
The SPRINT protocol was successful at reducing organ
failure and m ortality [11,13], with a patient-specific
appr oach that directly considered carbo hydrate adminis-
tration along with insulin. It provided the tightest control
across all patients of several la rge studies [8,23], via a
patient-specific approach accounting for inter- and intra-
patient variability in metabolic behavior. However, the
protocol is relatively inflexible, and the clinical burden,
although acceptable, was higher than desired. In particular,
SPRINT had a fixed glycemic target of 4.0-6.1 mmol/L,
fixed measurement intervals and rules, and a fixed
approach with respect to the balance of insulin and nutri-
tion. Hence, although unique in its control of nutrition as
well as insulin, it had no ability to customize the glycemic
target, control approach, or workload to specific patients,
conditions, or responses, all of which are issues common
to most TGC protocols th at can hinder uptake and com-
pliance [24-26]. Model-based approaches have been
mooted as a solution [27,28].
This paper presents the initial proof of concept pilot
clinical trial results for a model-ba sed TGC protocol that
ameliorates or eliminates al l these issues with clinically
specified glycemic targets and nurse selected measure-
ment intervals (with associated intervention s). The meta-
bolic system model uses additional stochastic models
[29,30] to forecast the range of glycemic outcomes f or a
given intervention, providing greater certainty over
longer measurement intervals, and the ability to identify
a cli nically specified level of ri sk of exceeding clinicall y
specified levels of hypo- or hyperglycemia. Its adaptive,
patient-specific control approach i s fully customizable to
local clinical standards.
Methods
Patients
Seven patients were recruited based on the need for TGC
(BG > 8.0 mmol/L) or existing treatment with SPRINT
[11], the current standard of care at Christchurch Hospi-
tal. Table 1 shows the patient cohor t details. Written,
informed consent was obtained for all patients, and
approval was granted by the NZ Upper South A Regional
Ethics Committee.
Stochastic TARgeted glycemic control
The St och astic TARgeted (STAR) TGC protocol recom-
mends insulin and nutrition inte rventions based on the
current patient-specific insulin sensitivity (S
I
(t)). Insulin
sensitivity is identified hourly for each patient using recent
BG measurements and a computerized metabolic system
model. With this value, the predicted blood glucose
response to a particular intervention can be calculated. A
stochastic model [29,30] of the potential variability in S
I
(t)
over the subsequent 1-3 hours is used to capture the
potential variation of (patient-specific) modeled insulin
sensitivity and thus the potential range of glycemic out-
comes to an intervention. Although the median and most
likely variation is no significant change from the previous
hour, the interquartile range (IQR) and (5
th
,95
th
) percen-
tile variations can result in significant changes in BG for a
given insulin intervention. The stochastic models and their
use in TGC are presented in detail in references [29-32].
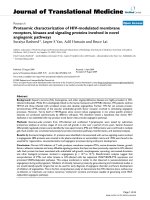
Figure 1 schematically shows this model and i ts potential
use to determine th e impact of variable insulin sensitivity
on BG outcome for a given intervention.
The STAR approach explicitly targets the (5-95
th
)per-
centile outcomes shown in Figure 1 to best overlay a
clinically chose n target range of 4.4-6.5 mmol/L, yielding
a maximum likelihood of being in this band. The fifth
percentile is never allowed to be lower than 4.0-4.4
mmol/L, providing a risk of 5% for BG below these values
for any intervention. This level can be clinically specified
and can be different for differ ent meas urement intervals.
Foreveryintervention,thenurseshaveafreechoiceof
measurement interval of 1, 2, or 3 hours when BG is
within 4.0-7.5 mmol/L with a forecasted risk of hypogly-
cemia within tolerance, and measured BG was not signifi-
cantly below prev iously f orecasted values. O utside thi s
range, targeting and measurement interval are restricted
to 1 hour for patient safety. Table 2 shows t he target to
range approach clinically specified for this study.
Specific insulin and nutrition interv entions are opti-
mized using a n extensively, clinically validated [33-3 9]
system model detailed in the Appendix (Additional
File 1). The model is used to identify current insulin sen -
sitivity (S
I
(t)) and to predict outcomes (Figure 1) for dif-
ferent possible interventions. The discrete insulin and
nutrition doses used and li mits on allowed dosing
changes from a prior intervention are defined in Table 3,
where these limits provide robustness to assay error and
patient safety.
Table 1 Baseline clinical data for STAR pilot trials
patients
Patient Age Sex Hours Diagnosis APACHE
II
APACHE
III
A
a
61 M 92 AAA Rupture 23 117
B
a
61 M 17 AAA Rupture 23 117
C 80 M 264 Head Trauma 16 75
D 80 M 96 CABG 21 85
E 65 F 119 Pancreatic
Surgery
13 58
F 66 M 23 GI Surgery (post) 22 83
G 52 F 49 Pancreatitis 14 70
AAA = Abdominal Aortic Aneurysm; APACHE = Acute Physiology and Chronic
Health Evaluation; CABG = Coronary Artery Bypass Graft; GI = Gastro-Intestinal.
a
Consecutive episodes of insulin usage in same person.
Evans et al. Annals of Intensive Care 2011, 1:38
/>Page 2 of 12
At each measurement, the algorithm searc hes over all
feasible solutions withi n these intervention constraints.
If no feasible solution is available for a 2- to 3-hour
interval, the 5
th
percentile is set for a value > 4.4 mmol/L
within these limits. If more than one s olution is feasible
for a given measurement interval, then the algorithm
selects that which is the same as, or closest t o, the prior
intervention to minimize clinical effort (e.g., keeping the
enteral feed rate and/or insulin input the same). If both
interventions are changing, then the protocol selects the
feasible option with greatest nutrition administration, a
choice that was clinically specified.
Finally, Table 4 defines four special cases for which
measurement i ntervals are restricted to 1 and/or 2
hourly and interventions modified, and/or where the
interventions are modified for highly insulin resistant
patients where the limits of Table 3 are not suffici ent to
reduce hyperglycemia . Each case represents a significant
risk to patient safety where insulin can be dosed exces-
sively in other protocols. Computer-based, STAR auto-
matically detects these situations and offers only the
relevant options.
Finally, it is important to note that STAR is a frame-
work, rather than a specific protocol. The STAR frame-
work is the overall stochastic approach to glycemic
control shown in Figure 1. It includes the ability to spe-
cify risk of hypoglycemia below a clinically set threshold
(Table 2), and the ability to enable multiple hourly mea-
surements based on clinically set glycemic thresholds
(Table 2). Within that framework, clinica l or site-specific
constraints may be added for how control is provided
(Table 3), which is via insulin and nutrition control in
this study with insulin delivered primarily via bolus deliv-
ery, and any special case s or rules (Table 4). Hence,
STAR is a flexible framework or overall model-based
approach that could admit a multitude of control
approaches that could be quite different than the speci-
fics used here. Specifically, two us es of STAR might pro-
vide very different glycemic outcomes.
Analyses
Data are presented as median [IQR] for both cohorts
and for median values across patients. For contextual
comparison only, the same glycemic outco mes are
Insulinsensitivity
Bloodglucose
t
now
Stochasticmodelshowsthe
bounds(5
th
–95
th
percentile)
forinsulinsensitivityvariation
overnext1Ͳ3hoursfromthe
initiallyidentifiedlevel
Foragivenfeed+insulin
intevention anoutputBG
distributioncanbeforecast
usingthemodel
t
now
+(1Ͳ3)hr
95
th
75
th
50
th
25
th
5
th
5
th
25
th
50
th
75
th
95
th
Stochastic model shows the (5
th
,
25
th
, 50
th
= median, 75
th
and 95
th
)
percentile bounds for insulin
sensitivity (S
I
(t)) variation over the
next time interval from the
currentlyidentifiedvalue.
Fora given insulinintervention, an
output BG distribution is forecast
usingthesystemmodel
+
(
1Ͳ2
)
hr
Figure 1 Stochastic model (left) can be used with an identified current level of S
I
(t) to provide a forecast range of S
I
(t) values over the
next 1- to 3-hour interval. This forecast range of values can be used with a given insulin intervention and the system model of Equations (1)-
(6) to yield a range of BG outcomes of differing likelihood. Note that the stochastic model shown is for a 1-hour interval, the 2- to 3-hour
interval models are very similar but not shown here. More details are provided in previous studies [29,30].
Table 2 STAR BG target ranges and approach for BG in the 4.0-7.5 mmol/L range
Measurement
interval
BG percentile and target BG for that
measurement interval
Goal and outcome
1-hour 95
th
percentile is targeted equal to 6.5 mmol/L
unless 5
th
percentile BG < 4.0 mmol/L
ELSE: 5
th
percentile targeted at 4.0 mmol/L
Ensures 95% of outcome BG are in 4.0-6.5 mmol/L target range and risk of
moderate hypoglycemia BG < 4.0 mmol/L does not exceed 5%.
2-hour 5
th
percentile targeted at 4.4 mmol/L Ensures most likely BG values are in 4.4-6.5 mmol/L range, and a maximum risk
of 5% for BG < 4.4 mmol/L. It also accepts a potentially greater likelihood of
exceeding 6.5 mmol/L at end of interval as preferable to being lower than 4.4
mmol/L.
3-hour 5
th
percentile targeted at 4.4 mmol/L Ensures most likely BG values are in 4.4-6.5 mmol/L range, and a maximum risk
of 5% for BG < 4.4 mmol/L. It also accepts a potentially greater likelihood of
exceeding 6.5 mmol/L at end of interval as preferable to being lower than 4.4
mmol/L.
Evans et al. Annals of Intensive Care 2011, 1:38
/>Page 3 of 12
shown for all 371 patients reported for SPRINT [11].
Cumulative time in the 4.0-7.0 mmol/L band over 50%
(cTIB ≥ 0.5) wa s associated with faster reduction in
organ failure in SPRINT [13] and also is assessed. Data
for time in ba nd assessments was resampled between
measurements to ensure the same measurements per
day for each cohort compared, so there was n o bias
from different measurement intervals. Safety from hypo-
glycemia is assessed for moderate (percent BG < 4.0
mmol/L and < 4.4 mmol/L) and severe (number with
BG < 2.2 mmol/L). Finally, measurements per day and
the number of unchanged interventions are recorded as
surrogates for clinical effort.
Results
Table 5 shows the glycemic control results for the cohort.
Table 6 shows t he glycemic control results per patient.
Overall performance is si milar or slightly better for
STAR versus the (contextual comparison only) SPRINT
data. Moderate hypoglycemia (BG < 4.0 mmol/L) is
under the clinically specified threshold risk of 5%, as
designed. Equally, the number of measurements per
patient was reduced ~20% for the patients studied
compared to SPRINT and the number of unchanged
interventions was similar for the cohort. However, the
per-patient results showed significant increases in
unchanged interventions (Table 6), indicating that STAR
was more dynamic for variable patients, as required
(patient C in particular), and less so for others.
Figure 2 shows the number of patients for each day
with cTIB ≥ 0.8 (band = 4.0-7.0 mmol/L, BG data
resampled hourly), where all patients achieved this level
for all days. Figures 3, 4 and 5 show the BG data, model
curve, and interventions for all seven p atients; Figure 3
also shows the modeled insulin sensitivity for patient A,
which is used as input for the stochastic model (see
Figure 1) to forecast the range of possible intervention
outcomes in optimising inte rventions. Hence, control
was very tight.
Also of note, patient G received a constant enteral nutri-
tion rate on clinical orders. STAR managed that change
directly and, equally importantly, recognized there was no
need for insulin as the patient (previously on SPRINT)
was stable. Equally, patient E became stable and did n ot
require insulin in the second half of the trial, before STAR
was stopped as a result, which also was recognized by
Table 3 Insulin and nutrition dose increments and limits on rate of change in dose per measurement interval
designed for patient safety
Intervention Increments used Maximum change
Insulin 0.0-6.0 U/h in increments of 0.5 U excluding 0.5 U/h +3U (dosing is per hour)
reduce to 0 U/h
Nutrition 30-100% of ACCP/SCCM goal feed of 25 kcal/kg/h [40,41] in increments of 5%, using a low
carbohydrate enteral nutrition formula (local clinical standard) of 35-40% carbohydrate content. Nutrition
may be turned off for other clinical reasons (0%) leaving only insulin as an intervention
Same rules apply if parenteral nutrition is used
± 20%
May be set to 0% if
clinically specified
Table 4 Special cases definitions and outcome impact on interventions and measurement interval
Case Condition Outcome Maximum measurement
interval (h)
Gradual reduction of hyperglycemia BG
i
> 7.5 mmol/L Percentile used for
Targeting
50
th
1
Target Value 0.85 ×
BG
i
Rapid decrease in glucose levels BG
i
<BG
i-1 (5th)
-1
BG
i
<
5.0
Background insulin infusions
stopped
1
BG
i
≥
5.0
Background insulin infusions
stopped
Nutrition suspension Feed turned off by
clinician
Use only insulin intervention
Stop all extra insulin infusions
2
Added insulin infusion of 1 U/h over 6 U/h
maximum
Must meet:
• Insulin at ≥5 U/h, for
the past 3 hours
• At least 4 hours has
elapsed since the last
time the enteral feed was
turned off
Add 1 U/h insulin infusion on top
of 6 U/h maximum level
This infusion is maintained for 6
hours unless:
A) Nutrition is stopped for any
reason
B) If “Rapid Decrease in Glucose
Levels” is detected
C) BG predicted to be below lower
cceptable limit with insulin infusion
1-3 hours as chosen by nurse
Evans et al. Annals of Intensive Care 2011, 1:38
/>Page 4 of 12
STAR and the model as it eventuated. Thus, overcontrol
and excessive insulin use was avoided.
Discussion
STAR is a unique, model-based TGC proto col that
uses clinically validated metabolic and stochastic mod-
elstooptimizetreatmentinthecontextofpossible
future patient variation. Probabilistic forecasting
enables more adaptive, optimized patient-specific care
with clinically specified maximum risk(s) of hyper- and
hypoglycemia. This forecasting capability is only
possible in computerized, model-based protocols, and
enables increased protocol flexibility, increased safety,
and reduced clinical effort, in this case by design.
The stochastic approach ena bles a unique targeting
method, where interventions are selected to maximize
the likelihood o f BG in a clinically specified range, while
providing a clinical ly specif ied maximum acceptable risk
of light hypoglycemia. The stochastic output range is
thus overlaid with a clinically speci fied desired control
range (4.0-4.4 ® 6.5 mmol/L depending on intervention
interval in this case) to maximize the likelihood of being
Table 5 Summary of cohort glycemic performance results
STAR
pilot trials
SPRINT
clinical data
BG median [IQR] (mmol/L) 5.9 [5.2-6.8] 5.7 [5-6.6]
%BG in 4.0-6.5 mmol/L 63 70
%BG in 4.0-7.0 mmol/L 76 79
%BG in 4.0-8.0 mmol/L 90 88
%BG < 4.4 mmol/L 8.0 9.1
%BG < 4.0 mmol/L 4.2 3.8
Median insulin rate [IQR] (U/hr) 2.5 [0.0 - 6.0] 3.0 [2.0 - 3.0]
Median glucose rate [IQR] (g/hr) 6.8 [5.5-8.7] 3.8 [1.6-5.5]
Average measurements/day 15 15
% Unchanged enteral nutrition interventions 86% 80%
% Unchanged insulin interventions 39% 48%
% Unchanged insulin
AND nutrition interventions 36% 41%
Table 6 Summary of per-patient glycemic performance results
STAR
pilot trials
SPRINT
clinical data
Hours of control (h) 92 [29.5-113.3] 53 [19-146]
Median BG median [IQR] (mmol/L) 5.9 [5.8-6.3] 5.8 [5.3-6.4]
%BG in 4.0-6.5 mmol/L 61.1 [55.3-78.4] 66.7 [51.7-78.9]
%BG in 4.0-7.0 mmol/L 79.2 [68.6-88.8] 77.2 [63.6-86.8]
%BG in 4.0-8.0 mmol/L 96.2 [89.3-100] 86.6 [75-94.3]
%BG < 4.4 mmol/L 4.3 [0.4-11] 6.9 [1-16.1]
%BG < 4.0 mmol/L 0 [0-6] 1.8 [0-6.9]
Median insulin rate [IQR] (U/h) 2.5 [0.1-5.1] 3.0 [2.0 - 3.0]
Median glucose rate [IQR] (g/h) 6 [5.6-6.9] 2.2 [0-4.5]
Average measures/day 14 17
%Unchanged nutrition interventions 86 [83-93] 82 [72-90]
%Unchanged insulin interventions 59 [27-75] 42 [30-54]
%Unchanged insulin
AND nutrition interventions 58 [20-74] 36 [25-48]
Evans et al. Annals of Intensive Care 2011, 1:38
/>Page 5 of 12
in that range. Its control thus selects treatments that are
justified by their predicted effect on the full range of pos-
sible BG outcomes.
To date, the init ial clinical results are positive. Patients
C and D, for example, clearly demonstrate different levels
of intra-patient and inter-patient metabolic variabili ty, all
of which was equally well managed with respect to glyce-
mic performance and safety. Patient E was a unique case,
where the controller recognised the relatively high insulin
sensitivity of the patient after about h alf their stay and
was able to recommend no insulin be given. This recom-
mendation was correct given the resulting good glycemic
control within th e desired target band for more than ~50
subsequent hours. The correct recommendation of no
insulin is o ne that many protocols find difficult as their
design is implicitly based on and biased toward active
intervention. Hence, the STAR controller was able to
avoid overcontrolling the patient with insulin where
necessary.
The remaining four patients had similarly good results
(Tables 5, 6 and Figures 3, 4, 5), particularly for achieving
high cTIB ≥ 0.8 values (Figure 2), where patients had
cTIB ≥ 0.8 for all days. The se cTIB results indicate that
control over all patients in this initial study was very tight
compared with SPRINT (as seen in [13]). Thus, i nitially,
STAR appears able to provide tighter control across
patients than SPRINT, which also is seen in Table 5 and
particularly in Table 6 where median values across
patients are much more tightly clustered over a 0.5
mmol/L wide interquartile range.
The S TAR framework and approach presented allo ws
nurses free choice of measurement interval to reduce real
and perceived clinical burden through longer intervals
(compared to SPRINT) and free choice [24,26]. While
longer intervals used different targeting, the overall glyce-
mic performance was very comparable to SPRINT.
Equally, all degradation or difference in control in Tables
5 and 6 was toward a moderately hyperglycemic range.
This result is partly due to the higher (4.4 vs. 4.0 mmol/L)
5% maximum hypoglycemic risk threshold specified at
these intervals (Table 2). This approach directly accounts
for the greater opportunity for significant variation over
longer intervals and thus maximizes safety while keeping
the glycemic outcome d istribution best aligned in the
1 2 3 4 5 6 7 8 9 10
0
2
4
6
Days on STAR
Num patients
Number of patients with cTIB cutoff >= 0.80
1 2 3 4 5 6 7 8 9 10
0
50
100
Days on STAR
% of patients
% of patients with cTIB cutoff >= 0.80
1 2 3 4 5 6 7 8 9 10
0
2
4
6
Days on STAR
Num patients
Number of patients on STAR by day
Figure 2 Number and percentage of patients with c umulative time in the 4.0-7.0 mmol/L band of at least 80% per day, along with
number of patients on STAR per day.
Evans et al. Annals of Intensive Care 2011, 1:38
/>Page 6 of 12
desired range to maximise th e opportunity for outco me
BG in that range.
These in itial re sults indicate that STAR is effective at
reducing clinical effort, which has been a major drawback
for TGC [20]. In particular, STAR reduced the number of
measurements per day for all patients and the number of
changes in intervention for most. Thus, over a larger
study, STAR should reflect the savings in clinical burden
from ~20% reductions in measurements (vs. SPRINT)
and further savings from reduced numbers of changed
interventions (more unchanged interventions).
From a broader human factors aspect, staff perception
of workload is influenced by the number of measure-
ments per day, actual time spent at the bedside perform-
ing measurements and administering treatment, and the
quality of control obtained [24]. Thus, if a protoc ol is
able to effectively regulate glycemic levels and achieve
clinical outcomes, impressions of clinical staff are more
positive and perceiv ed effort is (at least slightly ) reduced.
Although STAR reduced measurements per day and
other effort it is computer-based, which requires data
entry and calculation run-time. As a paper-based proto-
col SPRINT, is faster in this respect and may be more
transparent in its operation to users [24], which a lso
affects perceived effort and compliance. Hence, percep-
tions of effort will likely hinge on the longer-term out-
comes of clinical implementation.
Interestingly, in this initial study, nurses chose the 2-
hour interval far more frequently than the (equally)
available 3-hour interval. This outcome may reflect
Patient A
Patient B
Figure 3 Patients A and B, glycemic outcomes with STAR (top panel) and interventions (bottom panel). Patient A shows (middle panel)
the model identified insulin sensitivity (SI(t), see Appendix (Additional File 1) for details). For BG, the “x” symbols are measured BG values and
the solid line is the modeled value. The straight horizontal lines in the BG plots are at 4.0 and 7.0 mmol/L defining that range between them.
Evans et al. Annals of Intensive Care 2011, 1:38
/>Page 7 of 12
habit from using SPRINT, which has a maximum 2-
hour interv al, lack of familiarity or trust of the new sys-
tem, or that the effort required was acceptable to nurses
with the shorter interval.
One limitation of any model-based approach is the
model and its ability to predict outcomes to interven-
tions [28]. However, this model and related in silico
methods have been extensively tested clinically
[33,35-37,42] and validated for s pecific patients and in
predicting both the median and variability of clinical
trial outcomes, as well as for predicting specific inter-
vention outcomes [23,43,44]. It is the only such model
validated to this extent to date [34].
The STAR glycemic control approach presented is
fully generalizable. The clinical targets and ranges can
be set directly by clinical staff, as can the desired risk of
hyp o- or hyperglycemia (maximum 5% for BG < 4.0-4.4
mmol/L in Table 2). Hence, the approach is entirely
Patient C
Patient D
Patient E
Figure 4 Patient s C, D, and E, glycemic outcomes with STAR (top panel) and interventions (bottom pa nel). For BG, the “x” symbols are
measured BG values and the solid line is the modeled value. The straight horizontal lines in the BG plots are at 4.0 and 7.0 mmol/L defining
that range between them.
Evans et al. Annals of Intensive Care 2011, 1:38
/>Page 8 of 12
flexible. The ranges and risk values used represent those
chosen at Christchurch Hospital.
In contrast, whereas the gl ycemic range s used in this
study broadly match those in the design of SPRINT,
SPRINT was fixed in its implementation and did not allow
this flexibility and could not be adjusted directly by clinical
staff for different patients or groups. This flexibility has
been demonstrated for t he STAR framework in ongoing
pilot trials in Belgium [45]. As noted, two uses of STAR in
the overall framework might yield very dif ferent glycemic
outcomes due to: 1) different glycemic targets; 2) different
choices of risk levels for the 5% lower glycemia bound; 3)
different control intervention choices (insulin, nutrition, or
both); 4) any specific clinical rules within the STAR
approach that would modify the use of certain interven-
tions, such as bolus or infusion insulin delivery; and
5) choice of glycemic limit of for 2- or 3-hourly
measurements. As a result, this work is quite different
from the use of STAR in [45], which uses fixed nutrition
rates (nutrition is not used in control), delivers insulin via
infusion rather than bolus delivery, has a higher
(5.5 mmol/L) 5% lower glycemic threshold (vs. 4.0-4.4
mmol/L here), and thus a higher (5.5-8.0 mmol/L) desired
glycemic band (vs. 4.0-6.5 mmol/L here). Thus, the com-
parison of these two works, as well as to SPRINT, clearly
shows the flexibility of the overall STAR framework to
deliver very different glyce mic control approa ches within
the same stochastic, model-based approach, as well as the
resulting ability to customize the TGC approach to meet
local clinical standards, goals, and clinical workflow.
A further potential limitation of this overall STAR fra-
mework and approach is the stochastic model. Its fore-
casting is at the center of all the major advantages
enabled by this approach. It also is a cohort-based model,
Patient G
Patient F
Figure 5 Patient s F and G, glycemi c outc omes wit h ST AR (t op panel ) and interventions (bottom panel ).ForBG,the“x” symbols are
measured BG values and the solid line is the modeled value. Note that patient G received constant enteral nutrition rate on clinical orders and
STAR managed, which change directly by recognizing that there was no need for insulin, because the patient (previously on SPRINT) was stable.
Evans et al. Annals of Intensive Care 2011, 1:38
/>Page 9 of 12
which means that for som e patient s it will be too conser-
vative, w hereas for others potentially not conservative
enough [32,45]. Equally, there is no guarantee that a ll
ICU cohorts would have similar metabolic variability.
However, these models can be readily created from exist-
ing clinical data for an y reasonab ly similar metabolic sys-
tem model [29,30,32]. Perhaps more importantly, a
recent study found similar metabolic variability between
NZ and Belgian ICU cohorts [2 3], although this specific
result needs to be further generalized going forward.
Compliance and delays can be limitations of TGC stu-
dies. In this study, although not directly quantified,
compliance to recommendations was very good. Equally,
where STAR recommen dations are overridden by nurses
the system is told, as part of regular use, and thus it
adapts by using that data for the next recommendat ion.
Equally, delays are accounted for by the computerized
system and thus do not really exist as a factor. Hence,
the computerized approach enables delays to be tabu-
lated without input and noncompliance to recommenda-
tions to be noted and accounted for in subsequent
calculations, advantages that paper-based protocols do
not offer.
Finally, this study is limited to the initial results show-
ing performance and safety. Whereas patient numbers
are limited, the overall hours of control is significant with
more than 600 hours for critically ill patients. However,
further stud ies [45] will provideevidencetotheoverall
quality of the STAR framework in different uses, as well
as its robustness to larger cohorts. These trials are
ongoing internationally. However, although th ese results
may not yet provide fully gene ralizable conclusions to
guide therapy overal l, they do serve to show initial safety
and efficacy to justify extended use and trials.
Clinically, the comparison to the SPRINT results in
Tables 5 and 6 yields insights relevant to the broader
field. Specifically, whereas SPRINT was successful in pro-
viding safer and tighter control than most studies, it
required 2-hourly measurements. These initial results
clearly show that control can be achieved in measure-
ment interval to 3-hourly, thus reducing clinical effort
and burden, without reducing safety o r ef ficacy. Second,
the nutrition rates are much higher f or t hese patients
than for SPRINT, indicating that a model-based approach
can achieve better control whilst providing more nutri-
tion at the same time. Hence, the overall results can
influence clinical thinking with respect to t he measure-
ment rates and nutrition levels from which good control
might be still be achieved, where, in contrast, protocols
with uncontrolle d o r unknown nutrition l evels and 4-
hourly or greater maximum measurement intervals
[23,46,47] have not provided the same efficacy or safety
as this initial study and SPRINT.
Conclusions
This research pre sents the initial pilot trial results for a
novel Stochastic TARgeted (STAR) TGC framework and
approach. The results show that this approach can pro-
vide quality control performance that is tighter across
patients and thus more patient-specific. Equally, it also
reduced light hypoglycemia using a clinically specified
maximum risk with stochastic forecasting of metabolic
variation, as w ell as significantly reducing clinical work-
load compared with the current clinical standard proto-
col at Christchurch Hospit al. The stochastic forecasting
is unique in this field and enables a maximum likelihood
approach to targeting a desired glycemic range while
enabling the clin ical risk of hypo- or hypergly cemia to
be directly managed. It also enables patients with very
diffe rent metabolic (intra- and inter- patient) variabil ity
to be directly managed and controlled within a single
(STAR) model-based framework.
More specifically, the STAR approac h presented is
fully generalizabl e and clinical targets and ranges can b e
set directly by clinical staff, with those used here repre-
senting those chosen at Christchurch Hospital. These
initial results remain to be proven over subsequent clini-
cal pilot trials ongoing toward a potential transition to
regular clinical practice implementation.
Additional material
Additional file 1: Appendix: Metabolic System Model.
Acknowledgements
Financial Support
New Zealand Tertiary Education Commission (partial), NZ Foundation for
Research Science and Technology (FRST), Christchurch Intensive Care
Research Trust.
Author details
1
Department of Mechanical Engineering, Centre for Bio-Engineering,
University of Canterbury, Christchurch, New Zealand
2
Department of
Intensive Care, Christchurch Hospital, Christchurch School of Medicine,
University of Otago, Christchurch, New Zealand
3
Cardiovascular Research
Centre, University of Liege, Liege, Belgium
Authors’ contributions
All authors were involved in developing the STAR concept and methods.
Clinical trials were implemented by GMS in the Christchurch ICU. Software
and systems for the trials were created by AE, JS, CST, LW and ALC with
input from all other authors. Data was gathered and analysed by AE, JS, CST,
LW, JGC and ALC. The manuscript was originally drafted by AE, JS, CST, LW,
JGC and ALC, but all authors made contributions through the entire process,
including reading and final approval.
Competing interests
The authors declare that they have no competing interests.
Received: 18 May 2011 Accepted: 19 September 2011
Published: 19 September 2011
Evans et al. Annals of Intensive Care 2011, 1:38
/>Page 10 of 12
References
1. Capes SE, Hunt D, Malmberg K, Gerstein HC: Stress hyperglycaemia and
increased risk of death after myocardial infarction in patients with and
without diabetes: a systematic overview. Lancet 2000, 355(9206):773-778.
2. Krinsley JS: Association between hyperglycemia and increased hospital
mortality in a heterogeneous population of critically ill patients. Mayo
Clin Proc 2003, 78(12):1471-1478.
3. Finney SJ, Zekveld C, Elia A, Evans TW: Glucose control and mortality in
critically ill patients. Jama 2003, 290(15):2041-2047.
4. McCowen KC, Malhotra A, Bistrian BR: Stress-induced hyperglycemia. Crit
Care Clin 2001, 17(1):107-124.
5. Mizock BA: Alterations in fuel metabolism in critical illness:
hyperglycaemia. Best Pract Res Clin Endocrinol Metab 2001, 15(4):533-551.
6. Umpierrez GE, Isaacs SD, Bazargan N, You X, Thaler LM, Kitabchi AE:
Hyperglycemia: an independent marker of in-hospital mortality in
patients with undiagnosed diabetes. J Clin Endocrinol Metab 2002,
87(3):978-982.
7. Van den Berghe G, Wouters P, Weekers F, Verwaest C, Bruyninckx F,
Schetz M, Vlasselaers D, Ferdinande P, Lauwers P, Bouillon R: Intensive
insulin therapy in the critically ill patients. N Engl J Med 2001,
345(19):1359-1367.
8. Chase JG, Le Compte AJ, Suhaimi F, Shaw GM, Lynn A, Lin J, Pretty CG,
Razak N, Parente JD, Hann CE: Tight glycemic control in critical care - The
leading role of insulin sensitivity and patient variability: A review and
model-based analysis. Comput Methods Programs Biomed 2011, (available
online).
9. Egi M, Bellomo R, Stachowski E, French CJ, Hart G: Variability of blood
glucose concentration and short-term mortality in critically ill patients.
Anesthesiology 2006, 105(2):244-252.
10. Krinsley JS: Glycemic variability: a strong independent predictor of
mortality in critically ill patients. Crit Care Med 2008, 36(11):3008-3013.
11. Chase JG, Shaw G, Le Compte A, Lonergan T, Willacy M, Wong XW, Lin J,
Lotz T, Lee D, Hann C: Implementation and evaluation of the SPRINT
protocol for tight glycaemic control in critically ill patients: a clinical
practice change. Crit Care 2008, 12(2):R49.
12. Krinsley JS: Effect of an intensive glucose management protocol on the
mortality of critically ill adult patients. Mayo Clin Proc 2004,
79(8):992-1000.
13. Chase JG, Pretty CG, Pfeifer L, Shaw GM, Preiser JC, Le Compte AJ, Lin J,
Hewett D, Moorhead KT, Desaive T: Organ failure and tight glycemic
control in the SPRINT study. Crit Care 2010, 14(4):R154.
14. Krinsley JS, Jones RL: Cost analysis of intensive glycemic control in
critically ill adult patients. Chest 2006, 129(3):644-650.
15. Van den Berghe G, Wouters PJ, Kesteloot K, Hilleman DE: Analysis
of
healthcare resource utilization with intensive insulin therapy in critically
ill patients. Crit Care Med 2006, 34(3):612-616.
16. Preiser JC, Brunkhorst F: Tight glucose control and hypoglycemia. Crit Care
Med 2008, 36(4):1391; author reply 1391-1392.
17. Finfer S, Delaney A: Tight glycemic control in critically ill adults. Jama
2008, 300(8):963-965.
18. Brunkhorst FM, Engel C, Bloos F, Meier-Hellmann A, Ragaller M, Weiler N,
Moerer O, Gruendling M, Oppert M, Grond S: Intensive insulin therapy and
pentastarch resuscitation in severe sepsis. N Engl J Med 2008,
358(2):125-139.
19. Griesdale DE, de Souza RJ, van Dam RM, Heyland DK, Cook DJ, Malhotra A,
Dhaliwal R, Henderson WR, Chittock DR, Finfer S: Intensive insulin therapy
and mortality among critically ill patients: a meta-analysis including
NICE-SUGAR study data. Cmaj 2009, 180(8):821-7.
20. Mackenzie I, Ingle S, Zaidi S, Buczaski S: Tight glycaemic control: a survey
of intensive care practice in large English hospitals. Intensive Care Med
2005, 31(8):1136.
21. Schultz MJ, Spronk PE, Moeniralam HS: Tight glycaemic control: a survey
of intensive care practice in the Netherlands. Intensive Care Med 2006,
32(4):618-619.
22. Gale SC, Gracias VH: Glycemic control needs a standard reference point.
Critical care medicine 2006, 34(6):1856-1857.
23. Suhaimi F, Le Compte A, Preiser JC, Shaw GM, Massion P, Radermecker R,
Pretty C, Lin J, Desaive T, Chase JG: What Makes Tight Glycemic Control
(TGC) Tight? The impact of variability and nutrition in 2 clinical studies.
Journal of Diabetes Science and Technology 2010, 4(2):284-298.
24. Chase J, Andreassen S, Jensen K, Shaw G: The Impact of Human Factors
on Clinical Protocol Performance - A proposed assessment framework
and case examples. Journal of Diabetes Science and Technology (JoDST)
2008, 2(3):409-416.
25. Carayon P, Gurses A: A human factors engineering conceptual framework
of nursing workload and patient safety in intensive care units. Intensive
Crit Care Nurs 2005, 21(5):284-301.
26. Aragon D: Evaluation of nursing work effort and perceptions about
blood glucose testing in tight glycemic control. Am J Crit Care 2006,
15(4):370-377.
27. Chase J, Shaw GM, Wong XW, Lotz T, Lin J, Hann CE: Model-based
Glycaemic Control in Critical Care - A review of the state of the possible.
Biomedical Signal Processing and Control 2006, 1(1):3-21.
28. Chase J, LeCompte A, Preiser JC, Shaw G, Penning S, Desaive T:
Physiological Modelling, Tight Glycemic Control and the ICU Clinician:
What are models and how can they affect practice? Annals of Intensive
Care 2011, 1(1):11.
29. Lin J, Lee DS, Chase JG, Hann CE, Lotz T, Wong XW: Stochastic
Modelling
of Insulin Sensitivity Variability in Critical Care. Biomedical Signal
Processing & Control 2006, 1:229-242.
30. Lin J, Lee D, Chase JG, Shaw GM, Le Compte A, Lotz T, Wong J,
Lonergan T, Hann CE: Stochastic modelling of insulin sensitivity and
adaptive glycemic control for critical care. Comput Methods Programs
Biomed 2008, 89(2):141-152.
31. Le Compte A, Chase J, Lynn A, Hann C, Shaw G, Wong X, Lin J: Blood
Glucose Controller for Neonatal Intensive Care: Virtual trials
development and 1st clinical trials. Journal of Diabetes Science and
Technology (JoDST) 2009, 3(5):1066-1081.
32. Le Compte AJ, Lee DS, Chase JG, Lin J, Lynn A, Shaw GM: Blood glucose
prediction using stochastic modeling in neonatal intensive care. IEEE
Trans Biomed Eng 2010, 57(3):509-518.
33. Chase JG, Shaw GM, Lotz T, LeCompte A, Wong J, Lin J, Lonergan T,
Willacy M, Hann CE: Model-based insulin and nutrition administration for
tight glycaemic control in critical care. Curr Drug Deliv 2007, 4(4):283-296.
34. Chase JG, Suhaimi F, Penning S, Preiser JC, Le Compte AJ, Lin J, Pretty CG,
Shaw GM, Moorhead KT, Desaive T: Validation of a model-based virtual
trials method for tight glycemic control in intensive care. Biomed Eng
Online 2010, 9:84.
35. Chase JG, Shaw GM, Lin J, Doran CV, Hann C, Robertson MB, Browne PM,
Lotz T, Wake GC, Broughton B: Adaptive bolus-based targeted glucose
regulation of hyperglycaemia in critical care. Med Eng Phys 2005,
27(1):1-11.
36. Chase JG, Shaw GM, Lin J, Doran CV, Hann C, Lotz T, Wake GC,
Broughton B: Targeted glycemic reduction in critical care using closed-
loop control. Diabetes Technol Ther 2005, 7(2):274-282.
37. Wong XW, Singh-Levett I, Hollingsworth LJ, Shaw GM, Hann CE, Lotz T,
Lin J, Wong OS, Chase JG: A novel, model-based insulin and nutrition
delivery controller for glycemic regulation in critically ill patients.
Diabetes Technol Ther 2006, 8(2):174-190.
38. Lonergan T, LeCompte A, Willacy M, Chase JG, Shaw GM, Wong XW, Lotz T,
Lin J, Hann CE: A Simple Insulin-Nutrition Protocol for Tight Glycemic
Control in Critical Illness: Development and Protocol Comparison.
Diabetes Technol Ther 2006, 8(2):191-206.
39. Lonergan T, Compte AL, Willacy M, Chase JG, Shaw GM, Hann CE, Lotz T,
Lin J, Wong XW: A pilot study of the SPRINT protocol for tight glycemic
control in critically Ill patients. Diabetes Technol Ther 2006, 8(4):449-462.
40. Krishnan JA, Parce PB, Martinez A, Diette GB, Brower RG: Caloric intake in
medical ICU patients: consistency of care with guidelines and
relationship to clinical outcomes. Chest 2003, 124(1):297-305.
41. Kreymann KG, Berger MM, Deutz NE, Hiesmayr M, Jolliet P, Kazandjiev G,
Nitenberg G, van den Berghe G, Wernerman J, Ebner C: ESPEN Guidelines
on Enteral Nutrition: Intensive care. Clin Nutr 2006,
25(2):210-223.
42.
Wong XW, Chase JG, Shaw GM, Hann CE, Lotz T, Lin J, Singh-Levett I,
Hollingsworth LJ, Wong OS, Andreassen S: Model predictive glycaemic
regulation in critical illness using insulin and nutrition input: a pilot
study. Med Eng Phys 2006, 28(7):665-681.
43. Lin J, Razak NN, Pretty CG, Le Compte A, Docherty P, Parente JD, Shaw GM,
Hann CE, Geoffrey Chase J: A physiological Intensive Control Insulin-
Nutrition-Glucose (ICING) model validated in critically ill patients.
Comput Methods Programs Biomed 2011.
Evans et al. Annals of Intensive Care 2011, 1:38
/>Page 11 of 12
44. Hann CE, Chase JG, Lin J, Lotz T, Doran CV, Shaw GM: Integral-based
parameter identification for long-term dynamic verification of a glucose-
insulin system model. Comput Methods Programs Biomed 2005,
77(3):259-270.
45. Penning S, LeCompte A, Moorhead K, Desaive T, Massion P, Preiser JC,
Shaw G, Chase J: First Pilot Trial of the STAR-Liege Protocol for Tight
Glycemic Control in Critically Ill Patients. Computer Methods and Programs
in Biomedicine 2011.
46. Finfer S, Chittock DR, Su SY, Blair D, Foster D, Dhingra V, Bellomo R, Cook D,
Dodek P, Henderson WR: Intensive versus conventional glucose control in
critically ill patients. N Engl J Med 2009, 360(13):1283-1297.
47. Preiser JC, Devos P, Ruiz-Santana S, Melot C, Annane D, Groeneveld J,
Iapichino G, Leverve X, Nitenberg G, Singer P, et al: A prospective
randomised multi-centre controlled trial on tight glucose control by
intensive insulin therapy in adult intensive care units: the Glucontrol
study. Intensive Care Med 2009, 35(10):1738-1748.
doi:10.1186/2110-5820-1-38
Cite this article as: Evans et al .: Pilot proof of concept clinical trials of
Stochastic Targeted (STAR) glycemic control. Annals of Intensive Care
2011 1:38.
Submit your manuscript to a
journal and benefi t from:
7 Convenient online submission
7 Rigorous peer review
7 Immediate publication on acceptance
7 Open access: articles freely available online
7 High visibility within the fi eld
7 Retaining the copyright to your article
Submit your next manuscript at 7 springeropen.com
Evans et al. Annals of Intensive Care 2011, 1:38
/>Page 12 of 12