Báo cáo hóa học: " Layer-dependent nanoscale electrical properties of graphene studied by conductive scanning probe microscopy" docx
Bạn đang xem bản rút gọn của tài liệu. Xem và tải ngay bản đầy đủ của tài liệu tại đây (1.37 MB, 6 trang )
NANO EXPRESS Open Access
Layer-dependent nanoscale electrical properties
of graphene studied by conductive scanning
probe microscopy
Shihua Zhao, Yi Lv and Xinju Yang
*
Abstract
The nanoscale electrical properties of single-layer graphene (SLG), bilayer graphene (BLG) and multilayer graphene
(MLG) are studied by scanning capacitance microscopy (SCM) and electrostatic force microscopy (EFM). The
quantum capacitance of graphene deduced from SCM results is found to increase with the layer number (n) at the
sample bias of 0 V but decreases with n at -3 V. Furthermore, the quantum capacitance increases very rapidly with
the gate voltage for SLG, but this increase is much slowed down when n becomes greater. On the other hand, the
magnitude of the EFM phase shift with respect to the SiO
2
substrate increases with n at the sample bias of +2 V
but decreases with n at -2 V. The difference in both quantum capacitance and EFM phase shift is significant
between SLG and BLG but becomes much weaker between MLGs with a different n. The layer-dependent
quantum capacitance behaviors of graphene could be attributed to their layer-dependent electronic structure as
well as the layer-varied dependence on gate voltage, while the layer-dependent EFM phase shift is caused by not
only the layer-dependent surface potential but also the layer-dependent capacitance derivation.
Keywords: graphene, scanning capacitance microscopy, electrostatic force microscopy, layer dependence, quan-
tum capacitance
Graphene is drawing an increasing interest nowadays
since its debut in reality [1] as it is a pr omising material
for future nanoelectronic applications [2-4]. While many
transport property studies have been carried out by tra-
ditional techniques with nanoelect rodes fabricated on
graphene [5-8], condu ctive scanning probe microscopy
has recently been applied for direct nanoscale electrical
measurements on graphene [9-13]. For example, scan-
ning capacitance microscopy (SCM) was used to study
the capacitance of few layer graphene (FLG) [14-16],
and the unusual capacitive behavior of graphene due to
its quantum capacitance has been found. Electrostatic
forcemicroscopy(EFM)wasemployedtostudythe
electrostatic environment of graphene or to obtain the
layer-dependent surface potential of FLG [17,18]. Scan-
ning Kelvin microsco py [19,20] was performed to inves-
tigate surface potentials of different graphene layers, and
the surface potential was discovered to vary with the
layer number. Despite these efforts, the layer-dependent
electrical properties, especially the difference between
single-layer graphene (SLG) and bilayer graphene (BLG),
which is expected to be large due to their different elec-
troni c structures, have not been well investigated yet. In
this letter, the nanoscale electrical properties of SLG,
BLG, and multilayer graphene (MLG with layer number
> 2) are investigated by EFM and SCM, and their layer
dependences are studied in detail.
The graphene samples were prepared by th e mechani-
cal exfoliation method [1] and deposited onto p-type Si
substrates coated with a 300 nm of SiO
2
layer. Although
many novel methods have been used to fabricate gra-
phene [21,22], mechanical exfoliation [1] is still a fast
and convenient way to obtain high-quality graphene
with SLG, BLG, and MLG simultaneously. With the
help of optical microscopy to locate t he graphene [23],
tapping-mode atomic force microscopy (AFM) (Multi-
Mode V, Bruker Nano Surfaces Divis ion, Santa Barbara,
CA, USA) has been used to measure the topography. To
study the nanoscale electrical properties of graphene,
* Correspondence:
State Key Laboratory of Surface Physics, Fudan University, Shanghai 200433,
China
Zhao et al . Nanoscale Research Letters 2011, 6:498
/>© 2011 Zhao et al; licensee Springer. This is an Open Access article distributed under the terms of the Creative Commons Attribution
License ( which permits unrestricted use, distribution, and reproduction in any medium,
provided the original work is properly cited.
EFM and SCM are performed to in vestigate the electro-
static force and capacitance behaviors on graphene with
different layer numbers. EFM records both the sample
top ography and the phase shift that is directly linked to
the electrical force gradient by using a two-pass method.
By SCM, the capacitance variation ΔC between the tip
and the underlying semiconductor in response to a
change in the applied ac bias ΔV could be obtained.
The detailed operational modes of EFM and SCM have
been reported elsewhere [24]. All these experiments
were carried out in nitrogen atmosphere at room tem-
perature with Pt-Ir coated Si tips.
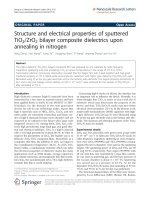
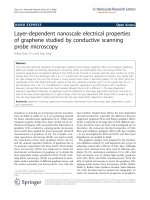
Figure 1a shows a typical AFM image of graphene,
which contains different graphene layers on SiO
2
sub-
strate. The profile of the marked line is shown in Figure
1b, which gives the height difference between area A
and substrate as well as that between area C and the
substrate. The height differences between graphene
area s and SiO
2
substrates are obtained in the same way.
As the height of a graphene layer on top of graphene is
close to the interlayer distance of graphite [15,25] we
fitted the measured graphene height (h) as a function of
the assigned layer number (n) by a straight line: h=nt
+t
0
, as shown in Figure 1c. The fitting result g ives the
heigh t of a graphen e layer t = 0.37 nm which is in close
agreement with the interlayer distance of graphite
(approximately 0.335 nm) and the offset t
0
=0.15nm
which may be caused by the different interaction
between tip-graphene and tip-SiO
2
[15,25]. Thus, the
heigh t of SLG is obtained to be 0.37 + 0.15 = 0.52 nm,
which is in agreement with t he results of SLG reported
in the literatures [14,15]. From the h-n linear fitting
results, area A is termed as SLG, area B as BLG, and
area C (four-layer) and D (eight-layer) as MLG.
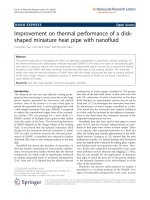
SCM measurements were carried out on graphene
with different layer numbers, and the images of dC/dV
amplitude at sample DC biases of 0 V and +3 V are
shown in Figure 2. The same area is scanned in (a) and
(b). The morphology difference of the multilayer rims
between (a) and (b) is caused by the coiling of graphene
film during the contact-mode scanning. It can be seen
that the dC/dV amplitud e does vary with the number of
graphene layers, and the differences between SLG, BLG,
and M LG can be obviously observed from both images.
Astheacvoltagevariation(ΔV)iskeptconstantinall
measurements, the capacitance variation (ΔC) obtained
by multiplying dC/dV amplitude with ΔV was adopted
afterwards instead of the dC/dV amplitude. The line
profiles of ΔC obtainedonSLGandBLGareshownin
Figure 2c, d, respectively. It can be seen that at the DC
bias of 0 V, the ΔC v alues of SLG are sl ightly smaller
than those of BLG, but at the DC bias of +3 V, the ΔC
values of SLG are larger than those of BLG. Figure 2e, f
02468
0
1
2
3
4
Height (nm)
Number of la
y
ers
(c)
0123
-1
0
1
2
He
i
ght (nm)
Size (
P
m)
0.54 nm
(b)
Figure 1 AFM image of graphe ne. (a) Tapping-mode height
image of the graphene sample. A, B, C, and D are labeled for one-,
two-, four-, and eight-layer graphene, respectively, while S is labeled
for the SiO
2
surface. (b) The profile of the marked line in (a). (c) The
measured height (h) as a function the assigned number of
graphene layers (n) and the linear fitting result (red line), giving h =
0.37n + 0.15.
Zhao et al . Nanoscale Research Letters 2011, 6:498
/>Page 2 of 6
present the averaged ΔC with respect to the SiO
2
sub-
strate for SLG, BLG, and MLG obtai ned at 0 V and +3
V, respectively. The results show that at the DC bias of
0V,theΔC measured on graphene increases with n.
The increase is fast when n increases from 1 to 4, and it
slows down when n increases from 4 to 8. On the other
hand, ΔC decreases with n for the case of +3 V DC
bias. Moreover, the ΔC values measured on graphene
012345
-6
-3
0
3
'
C (a. u.)
Size (
P
m)
(c)
012345
-2
0
2
4
Size (
P
m)
'
C (a.u.)
(d)
02468
-60
-40
-20
0
'
C difference (a. u.)
Layer number
(e)
SiO
2
02468
-40
-20
0
'
C difference (a. u.)
Layer number
(f)
SiO
2
Number of la
y
ers Number of la
y
ers
Figure 2 The dC/dV amplitude images of graphene on SiO
2
. The dC/dV amplitude images of graphene on Si O
2
obtained at DC biases of 0
V (a) and +3 V (b). The line profiles of the marked lines (from right top to left bottom) are plotted in (c) and (d) respectively, showing the
difference between SLG and BLG. The quantum capacitance variations of graphene with respected to the SiO
2
substrate as a function of the
number of layers at sample DC biases of 0 V and +3 V are shown in (e) and (f) respectively.
Zhao et al . Nanoscale Research Letters 2011, 6:498
/>Page 3 of 6
layers are always smaller than those measured on the
SiO
2
substrate for both biases.
As the capacitance measured on graphene is com-
posed of two series capacitance: the quantum capaci-
tance of graphene and the capacitance of the underlying
oxide layer, according to the p revious studies [14-16],
the total capacit ance measured on graphene (C
tot
) could
be written as:
C
tot
= A
eff
C
’
tot
= A
eff
C
’
q
C
’
MOS
C
’
q
+ C
’
MOS
,
(1)
where
A
e
ff
= πr
s
2
istheeffectiveareaofgraphene(r
s
is the radius of the disk on which the nonstationary
electron/hole charge is distributed). C’
MOS
and C’
q
are
the unit area capacitance for tip/SiO
2
/Si structure and
graphene, respectively. By considering the contact area,
thecapacitancemeasuredonSiO
2
substrate is
C
MOS
= A
ti
p
C
MOS
,where
A
ti
p
= π r
ti
p
2
is the tip contact
area. Thus, the quantum capacitance C
q
can be derived
as:
C
q
= A
eff
C
q
=
C
tot
C
MOS
C
MOS
−
A
tip
A
e
ff
C
tot
(2)
In Equation 2, C
tot
and C
MOS
are the capacitances
measured on the top of graphene layers and on the SiO
2
substrate, respectively, but the ratio A
tip
/A
eff
could not
be obtained from the experiments. For FLG, the ratio
was found to vary with the gate voltage, as well as the
SiO
2
thickness [14-16]. As reported in the literatures
[14], in the case of 300 nm SiO
2
existed; this ratio for
FLG was approximately equal to 1 at the gate voltage of
0 V an d changed slightly with the gate voltage, but its
relation with n is not clear. As a rough approximation,
we took A
tip
/A
eff
=1for all grephene layers, thus the
values of C
q
can be calculated from Equation 2. The cal-
culated values for different graphene layers at both DC
voltages of 0 and 3 V are shown in Table 1.
From Table 1, it can be seen that at the sample bias of
0 V, the quantum capacitance variation of graphene
increases with n. With +3 V bias applied, all quantum
capacitance variations are much larger than their corre-
sponding values at 0 V. The increase is mostly signifi-
cant for SLG, which increased about 280 times. The
increase magnitude, as shown in Table 1, drops dow n
quickly with increasing n. Therefore, the change of gra-
phene quantum capacitance with the DC biases is
dependent on n, resulting in the different layer-depen-
dent quantum capac itances of graphene at 0 V and +3
V. Since SCM has been performed in the contact mode
where the tip contacts with the surface, the DC bias
applied between the tip and sample backside acts as the
gate voltage. So our results indicate that the capacitance
variations increase with the gate voltage for different
graphene layers, and the increase magnitude decreases
as n increases. In previous studies, both the SCM mea-
surements on FLG [14-16] and theoretical studies on
SLG[26]showedthatthequantumcapacitanceofgra-
phene increases significantly with the gate voltage. Our
results are consistent with those conclusions, but since
A
tip
/A
eff
=1is used for different graphene layers, it may
cause errors for the obtained C
q
values, especially at a
DC bias of +3 V. Nevertheless, the different quantum
capacitance behaviors for graphene with different n are
definite. As the quantum capacitance represents the
density of states (DOS) at Fermi level [26,27] and the
DOS of graphene was found to vary with n [28], it is
reasonable to obtain that the quantum capacitance of
graphene is dependent on n,asshowninTable1.On
the other hand, it was reported by Yu et al.thatthe
work function could be tuned by the gate voltage, where
they found that SLG showed larger work function
changes w ith gate voltage than BLG did [18]. They
explained the work function change as due to the
change in Fermi level ( E
F
) in graphene, which was dif-
ferent for SLG and BLG. Our resul ts can be interpreted
in the similar viewpoint. Different changes of E
F
with
gate voltage for differ ent graphene layers could result in
different carrier density changes with gate voltage, so
are the changes of the quantum capacitance with gate
voltage.
Meanwhile, the EFM results measured on graphe ne
with different n atthesamplebiasesof+2Vand-2V
at a lift height of 20 nm are shown in Figure 3. It is
found that for the bias o f +2 V, the phase shift differ-
ence between SLG and SiO
2
substrate is smaller than
that between BLG and SiO
2
, while for the bias of -2 V,
SLG has a larger phase shift with respect to SiO
2
than
BLG. Detailed correlations of the phase shift with n
obtained at +2 V and -2 V are shown in Figure 3c, d,
respectively. The magnitude of the phase shift with
respect to the SiO
2
substrate increases with n at +2 V
but decreases with n at -2 V. In a previous report [18],
Datta et al. measured the EFM phase shifts on FLG ran-
ged from 2 to 18 layers, and also observed the similar
Table 1 Calculated values for different graphene layers
ΔC
q
(0 V) ΔC
q
(3 V) Increase ratio
(ΔC
q
(3 V)/ΔC
q
(0 V)
SLG 237 66,453 280
BLG 401 12,096 30
MLG (n = 4) 1,521 10,115 7
MLG (n = 8) 2,143 8,675 4
C
ox
135 448 -
The calculated quantum capacitance variations of graphene with different
number of layers at sample biases of 0 V and +3 V.
Zhao et al . Nanoscale Research Letters 2011, 6:498
/>Page 4 of 6
phase shift reverse for two-layer and three-layer gra-
phene at tip biases of -2 V and +3 V. They suggested
that the phase shift difference was related with the
layer-varied surface potential. This suggestion is doubt-
ful, since the phase shift of electrostatic force is com-
posed of two factors, which could be written as [29]:
= −
Q
k
grad
DC
F = −
1
2
Q
k
(V
DC
− V
surf
)
2
∂
2
C
∂
z
2
,
(3)
where k is the stiffness of the cantilever, Q is the qual-
ity factor, z is the tip-sample distance and C is the tip-
sample capacitance. V
DC
is the applied bias, and V
surf
is
the surface potential correlated with the difference
between the tip and sample work functions (V
surf
=
(W
tip
-W
sample
)/e). Hence, both surface potential and
capacitance derivation (∂
2
C/∂z
2
) will contribute to the
phase shift of electrostatic force. First let’sestimatethe
surface potential contri bution (V
dc
- V
surf
)
2
to the differ-
ent phase shift between SLG and BLG. The work func-
tion different between SLG and BLG was reported by
Yu et al. [20], which is 4.57 eV for SLG and 4.69 eV for
BLG, respectively. As the work function of the SiO
2
sub-
strate is about 5.0 eV and the same tip is a pplied (PtIr,
approximately 4.86 eV), SLG should have a larger phase
shift difference with respect to the SiO
2
substrate than
that of BLG for both biases. In other words, the differ-
ence in phase shift behavior between SLG and BLG
could not only be attributed to their different surface
potentials. Thus, the c apacitance derivation should be
another contribution to the phase shift. O ur SCM
results aforementioned do indicate that the quantum
capacitance of graphene varies with n, and it is
02468
-12
-11
-10
Phase Shift (Degrees)
Number of la
y
ers
(c)
02468
-6
-5
Phase Shift (Degrees)
Number of layers
(d)
Figure 3 EFM phase images.EFMphaseimagesofthesameareaofFigure1atbiasvoltagesof+2V(a) and -2 V (b).Thephaseshiftof
graphene with respect to that of SiO
2
substrate vs the number of graphene layers obtained at +2 V and -2 V are plotted in (c) and (d),
respectively.
Zhao et al . Nanoscale Research Letters 2011, 6:498
/>Page 5 of 6
significantly dependent on the sample biases, which
could be expected to induce different EFM phase shifts
for different graphene layers at different samples biases.
In conclusion, the nanoscale electrical properties of
graphene with different number of layers have been stu-
died by SCM and EFM, and t he layer d ependences of
capacitance variat ion and EFM phase shift are obtained.
SLG, BLG, and MLG exhibit obvious differences in elec-
trostatic force and capacitance behaviors. The different
electrical properties obtained on different number of
graphene layers could be mainly attributed to their dif-
ferent electronic properties.
Acknowledgements
This work was supported by the National Natural Science Foundation of
China (grant number 10874030) and the special funds for Major State Basic
Research Project of China (no. 2011CB925601).
Authors’ contributions
SHZ carried out the experiments. YL participated in the SCM and EFM
studies. SHZ and XJY interpreted the results and wrote the manuscript. All
authors read and approved the final manuscript.
Competing interests
The authors declare that they have no competing interests.
Received: 12 May 2011 Accepted: 18 August 2011
Published: 18 August 2011
References
1. Novoselov KS, Geim AK, Morozov SV, Jiang D, Zhang Y, Dubonos SV,
Grigorieva IV, Firsov AA: Electric field effect in atomically thin carbon
films. Science 2004, 306:666.
2. Zhang Y, Tan YW, Stormer HL, Kim P: Experimental observation of the
quantum Hall effect and Berry’s phase in graphene. Nature 2005, 438:201.
3. Geim AK, Novoselov KS: The rise of graphene. Nat Mater 2007, 6:183.
4. Schwierz F: Graphene transistors. Nat Nanotechnol 2010, 5:487.
5. Novoselov KS, McCann E, Morozov SV, Fal’Ko VI, Katanelson MI, Zeitler U,
Jiang D, Schedin F, Geim AK: Unconventional quantum Hall effect and
Berry’s phase of 2π in bilayer graphene. Nat Physics 2006, 2:177.
6. Miao F, Wijeratne S, Zhang Y, Coskun UC, Bao W, Lau CN: Phase-coherent
transport in graphene quantum billiards. Science 2007, 317:1530.
7. Dröscher S, Roulleau P, Molitor F, Studerus P, Stampfer C, Ensslin K, Ihn T:
Quantum capacitance and density of states of graphene. Appl Phys Lett
2010, 96:152104.
8. Xu H, Zhang Z, Wang Z, Wang S, Liang X, Peng LM: Quantum capacitance
limited vertical scaling of graphene field-effect transistor. ACS Nano 2011,
5:2340.
9. Kellar JA, Alaboson JMP, Wang QH, Hersam MC: Identifying and
characterizing epitaxial graphene domains on partially graphitized SiC
(0001) surfaces using scanning probe microscopy. Appl Phys Lett 2010,
96:143103.
10. Yang H, Mayne AJ, Boucherit M, Comtet G, Dujardin G, Kuk Y: Quantum
interference channeling at graphene edges. Nano Lett 2010, 10:943.
11. Nagase M, Hibino H, Kageshima H, Yamaguchi H: Local conductance
measurements of double-layer graphene on SiC substrate. Nanotechnol
2009, 20:445704.
12. Xue J, Sanchez-Yamagishi J, Bulmash D, Jacquod P, Deshpande A,
Watanabe K, Taniguchi T, Jarillo-Herrero P, LeRoy BJ: Scanning tunnelling
microscopy and spectroscopy of ultra-flat graphene on hexagonal boron
nitride. Nat Mater 2011, 10:282.
13. Sutter E, Acharya DP, Sadowski JT, Sutter P: Scanning tunneling
microscopy on epitaxial bilayer graphene on ruthenium (0001). Appl Phys
Lett 2009, 94:133101.
14. Giannazzo F, Sonde S, Raineri V, Rimini E:
Screening length and quantum
capacitance in graphene by scanning probe microscopy. Nano Lett 2009,
9:23.
15. Sonde S, Giannazzo F, Raineri V, Rimini E: Dielectric thickness dependence
of capacitive behavior in graphene deposited on silicon dioxide. J Vac
Sci Technol B 2009, 27:868.
16. Sonde S, Giannazzo F, Raineri V, Rimini E: Nanoscale capacitive behaviour
of ion irradiated graphene on silicon oxide substrate. Phys Status Solidi B
2010, 247:907.
17. Moser J, Verdaguer A, Jiménez D, Barreiro A, Bachtold A: The environment
of graphene probed by electrostatic force microscopy. Appl Phys Lett
2008, 92:123507.
18. Datta SS, Strachan DR, Mele EJ, Charlie Johnson AT: Surface potentials and
layer charge distributions in few-layer graphene films. Nano Lett 2009,
9:7.
19. Lee NJ, Yoo JW, Choi YJ, Kang CJ, Joen DY, Kim DC, Seo S, Chung HJ: The
interlayer screening effect of graphene sheets investigated by Kelvin
probe force microscopy. Appl Phys Lett 2009, 95:222107.
20. Yu Y, Zhao Y, Ryu S, Brus LE, Kim KS, Kim P: Tuning the graphene work
function by electric field effect. Nano Lett 2009, 9:3430.
21. Li X, Wang X, Zhang L, Lee S, Dai H: Chemically derived, ultrasmooth
graphene nanoribbon semiconductors. Science 2008, 319:1229.
22. Subrahmanyam KS, Vivekchand SRC, Govindaraj A, Rao CNR: A study of
graphenes prepared by different methods: characterization, properties
and solubilization. J Mater Chem 2008, 18:1517.
23. Blake P, Hill EW, Castro Neto AH, Novoselov KS, Jiang D, Yang R, Booth TJ,
Geim AK: Making graphene visible. Appl Phys Lett 2007, 91:063124.
24. Oliver RA: Advances in AFM for the electrical characterization of
semiconductors. Rep Prog Phys 2008, 71:076501.
25. Gupta A, Chen G, Joshi P, Tadigadapa S, Eklund PC: Raman scattering from
high-frequency phonons in supported n-graphene layer films. Nano Lett
2006, 6:2667.
26. Fang T, Konar A, Xing H, Jena D: Carrier statistics and quantum
capacitance of graphene sheets and ribbons. Appl Phys Lett 2007,
91:092109.
27. Ponomarenko LA, Yang R, Gorbachev RV, Blake P, Mayorov AS,
Novoselov KS, Katsnelson MI, Geim AK: Density of states and zero Landau
level probed through capacitance of graphene. Phys Rev Lett 2010,
105:136801.
28. Ohta T, Bostwick A, McChesney JL, Seyller T, Horn K, Rotenberg E: Interlayer
interaction and electronic screening in multilayer graphene investigated
with angle-resolved photoemission spectroscopy. Phys Rev Lett 2007,
98:206802.
29. Portes L, Girard P, Arinero R, Ramonda M: Force gradient detection under
vacuum on the basis of a double pass method. Rev Sci Instrum 2006,
77:096101.
doi:10.1186/1556-276X-6-498
Cite this article as: Zhao et al.: Layer-dependent nanoscale electrical
properties of graphene studied by conductive scanning probe
microscopy. Nanoscale Research Letters 2011 6:498.
Submit your manuscript to a
journal and benefi t from:
7 Convenient online submission
7 Rigorous peer review
7 Immediate publication on acceptance
7 Open access: articles freely available online
7 High visibility within the fi eld
7 Retaining the copyright to your article
Submit your next manuscript at 7 springeropen.com
Zhao et al . Nanoscale Research Letters 2011, 6:498
/>Page 6 of 6