Laser Pulse Phenomena and Applications Part 11 pptx
Bạn đang xem bản rút gọn của tài liệu. Xem và tải ngay bản đầy đủ của tài liệu tại đây (1.55 MB, 30 trang )
Laser Plasma Accelerators: Towards High Quality Electron Beam 3
These potentials are not described uniquely. It is possible to find other solutions with a gauge
transformation. We usually work in Coulomb gauge
∇
.
A = 0.
In the following, we will use the normalized vector potential
a, defined by :
a =
e
A
m
e
c
(7)
where e is the electron charge and m
e
its mass.
One also introduces the intensity I, which is the average of the Poynting vector over an optical
cycle :
I
= c
2
ε
0
E ∧
B
t
(8)
where brackets design the temporal average on one optical cycle.
2.3 Gaussian beams
Short laser pulses delivered by laser systems have a broad spectrum which contains many
modes locked in phase. This spectrum is usually described simply by a gaussian envelope,
thus also leading to an gaussian temporal envelope, which is close to reality. In the same
way, the spatial profile of the laser pulse at the focal plane is also represented by a gaussian
function. The electric field has the following form for a linearly polarized pulse :
E(r, z,t)=
E
2
f
(r,z)g(t, z)exp
[
−
i(k
0
z −ω
0
t)
]
e
x
+
cc (9)
Equation (9) contains a carrying envelope with wave number k
0
and frequency ω
0
and spatial
and temporal information contained in f
(r,z) and g (t) respectively. The following gaussian
expressions (10) verify the equation of propagation of the electric field in vacuum in the
paraxial approximation. These expressions reproduce accurately the electric field of the laser
when the focusing optics have small aperture.
g
(t,z)=exp
−2ln2
t
−z/c
τ
0
2
f
(r,z)=
w
0
w(z)
exp
−
r
2
w
2
(z)
−
i
k
0
r
2
2R(z )
expi φ(z)
(10)
where τ
0
is the pulse duration at full width at half maximum (FWHM), w
0
is the waist of the
focal spot (the radius at 1/e of the electric field in the focal plane z
= 0). φ(z) is the Gouy
phase. Functions w
(z) and R(z) represent respectively the radius at 1/e of the electric field
and the radius of curvature of the wave front. These functions take the following form :
w
(z)=w
0
1 +
z
2
Z
2
r
(11)
R
(z)=z
1 +
Z
2
r
z
2
(12)
Z
r
= πw
2
0
/λ
0
is the Rayleigh length. This physical parameter represents the length where the
laser intensity on axis has dropped by a factor 2 compared to the intensity in the focal plane
(z
= 0).
291
Laser Plasma Accelerators: Towards High Quality Electron Beam
4 Laser Pulses
Starting from this expression of the electric field, the following relation exists between the
maximal intensity I
0
and the power P :
I
0
=
2P
πw
2
0
(13)
with P
= 2
ln2
π
U
τ
0
∼
U
τ
0
, where U is the energy contained in the pulse.
Then, the following relation lies the maximal intensity I
0
and the maximum of the normalized
vector potential a
0
a
0
=
e
2
2π
2
ε
0
m
2
e
c
5
λ
2
0
I
0
1/2
(14)
When a
0
exceeds unity, the oscillations of an electron in the laser field become relativistic. In
laser plasma accelerators the motion of the electrons is mostly relativistic
1
.
2.4 Plasma parameters
A plasma is a state of matter made of free electrons, totally or partially ionized ions and neutral
atoms or molecules, the whole medium being globally neutral. Let’s assume an initially
uniform, non-collisional plasma in which a slab of electron is displaced from the equilibrium
position. The restoring force which applies on this electron slab, drives them towards the
equilibrium position. For the time scale corresponding to the electron motion, one neglects
the motion of the ions because of the inertia. This gives in the end oscillations around the
equilibrium position at a frequency called the electron plasma frequency ω
pe
ω
pe
=
n
e
e
2
m
e
ε
0
(15)
where n
e
is the unperturbed electron density.
This frequency has to be compared to the laser frequency : if ω
pe
< ω
0
then the characteristic
time scale of the plasma is longer than the optical period of the incoming radiation. The
medium can’t stop the propagation of the electromagnetic wave. The medium is said to be
transparent or under-dense. On the opposite, when ω
pe
> ω
0
then the characteristic time scale
of the electrons is fast enough to adapt to the incoming wave and to reflect totally of partially
the radiation. The medium is said to be overdense.
These two domains are separated at frequency ω
0
, which corresponds to the critical density
2
n
c
= ω
2
0
m
e
ε
0
/e
2
2.4.1 Electric field of the plasma wave
One considers now a periodic sinusoidal perturbation of the electron plasma density in a
uniform ion layer. Mechanisms responsible for the excitation of the plasma wave will be
described in the following section. The density perturbation δn is written :
δn
= δn
e
sin(k
p
z −ω
p
t) (16)
where ω
p
and k
p
are the angular frequency and the wave number of the plasma wave.
1
For a visible laser light intensity I
0
= 3 ×10
18
W/cm
2
, to which corresponds a a
0
= 1.3.
2
For an wavelength λ
0
= 820 nm, one obtains a critical density of n
c
= 1.7 ×10
21
cm
−3
292
Laser Pulse Phenomena and Applications
Laser Plasma Accelerators: Towards High Quality Electron Beam 5
This density perturbation leads to a perturbation of the electric field δ
E via the Poisson
equation:
∇
.δ
E = −
δne
ε
0
(17)
This gives
δ
E(z, t)=
δn
e
e
k
p
ε
0
cos(k
p
z −ω
p
t)
e
z
(18)
Because we want to describe the electron acceleration to relativistic energies by a plasma wave,
we consider now a plasma wave with a phase velocity is close to the speed of light v
p
=
ω
p
/k
p
∼ c. Let E
0
= m
e
cω
pe
/e. The electric field becomes :
δ
E(z, t)=E
0
δn
e
n
e
cos(k
p
z −ω
p
t)
e
z
(19)
One notice that the electric field is dephased by
−π/4 with respect to the electron density.
2.4.2 Lorentz’s transform
Let’s now describe what happens to an electron placed in this electric field. The goal is to
obtain the required conditions for trapping to occur. The following variables are introduced
to describe the electron in the laboratory frame : z the position, t the associated time, β the
velocity normalized to c, γ
= 1/
1 − β
2
the associated Lorentz’s factor. In the frame of the
plasma wave, let z
, t
,β
and γ
represent the equivalent quantities.
The frame linked to the plasma wave is in uniform constant translation at speed v
p
= β
p
c.
One writes γ
p
the Lorentz’s factor associated to this velocity. The Lorentz’s transform allows
to switch from the laboratory frame to the wave frame :
⎧
⎪
⎨
⎪
⎩
z
= γ
p
(z −v
p
t)
t
= γ
p
(t −
x
c
)
γ
= γγ
p
(1 −
β.
β
p
)
(20)
In this new frame, without magnetic field, the electric field remains unchanged δ
E
δ
E
(z
)=δ
E(z, t)=E
0
δn
e
n
e
cos(k
p
z
/γ
p
)
e
z
(21)
Consequently, in terms of potential, the electric field is derived from potential Φ
defined by
F = −eδ
E
≡−
∇
Φ
(22)
This leads to
Φ
(z
)=mc
2
γ
p
δn
e
n
e
sin(k
p
z
/γ
p
) ≡ mc
2
φ
(z
) (23)
Finally, one writes the total energy conservation for the particle in this frame compared to the
initial energy at the injection time (labelled with subscript 0) :
γ
(z
)+φ
(z
)=γ
0
(z
0
)+φ
0
(z
0
) (24)
Equation 24 gives the relation between the electron energy and its position in the plasma wave.
Figure 1 illustrates the motion of an electron injected in this potential. Finally, we perform the
reverse Lorentz’s transform to give this energy in the laboratory frame.
293
Laser Plasma Accelerators: Towards High Quality Electron Beam
6 Laser Pulses
For β
> 0, the scalar product in eq. 20 is positive
γ = γ
γ
p
+
γ
2
−1
γ
2
p
−1 (25)
For β
< 0, scalar product in eq. 20 is negative
γ
= γ
γ
p
−
γ
2
−1
γ
2
p
−1 (26)
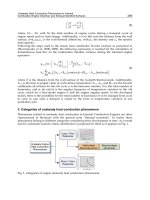
2.4.3 Electron trajectories
Figure 1 represents an example of electron trajectory in a plasma wave. In this phase space,
the closed orbits correspond to trapped particles. Open orbits represent untrapped electrons,
either because the initial velocity is too low, or to high. The curve which separates these two
regions is called the separatrix.
This separatrix gives the minimum and maximum energies for trapped particles. This is
comparable to the hydrodynamic case, where a surfer has to crawl to gain velocity and to
catch the wave. In terms of relativistic factor, γ has to belong to the interval
[
γ
min
;γ
max
]
with :
⎧
⎨
⎩
γ
min
= γ
p
(1 + 2γ
p
δ) −
γ
2
p
−1
1
+ 2γ
p
δ
2
−1
γ
max
= γ
p
(1 + 2γ
p
δ)+
γ
2
p
−1
1
+ 2γ
p
δ
2
−1
(27)
where δ
= δn
e
/n
e
is the relative amplitude of the density perturbation.
Fig. 1. Up: Potential in phase space. Down: Trajectory of an electron injected in the potential
of the plasma wave in the frame of the wave with the fluid orbit (dashed line), the trapped
orbit and in between in red the separatrix.
One deduces that the maximum energy gain ΔW
max
for a trapped particle is reached for
a closed orbit with maximum amplitude. This corresponds to the injection at γ
min
on the
separatrix and its extraction at γ
max
. The maximum energy gain is then written
ΔW
max
=(γ
max
−γ
min
)mc
2
(28)
294
Laser Pulse Phenomena and Applications
Laser Plasma Accelerators: Towards High Quality Electron Beam 7
For an electron density much lower than the critical density n
e
n
c
, one has γ
p
= ω
0
/ω
p
1
and
ΔW
max
= 4γ
2
p
δn
e
n
e
mc
2
(29)
For electron travelling along the separatrix, the time necessary to reach maximal energy is
infinite because there exist a stationnary point at energy γ
p
. On other closed orbits, the
electron successively gains and looses energy during its rotation of the phase space. In
order to design an experiment, one needs an estimation of the distance an electron travels
before reaching maximal energy gain. This length, which is called the dephasing length L
de ph
,
corresponds to a phase rotation of λ
p
/2 in the phase space. In order to have a simple analytical
estimation, one needs to assume that the energy gain is small compared to the initial energy
of the particle and that the plasma wave is relativistic γ
p
1, then the dephasing length is
written
L
de ph
∼ γ
2
p
λ
p
(30)
This concept of dephasing length in a 1D case can be refined in a bi-dimensional case. Indeed,
if one also takes into account the transverse effects of the plasma wave, this one is focusing
or defocusing for the electrons along their acceleration, Mora (1992). Because these transverse
effects are shifted by λ
p
/4 with respect to the pair acceleration/deceleration, the distance over
which the plasma wave is both focusing and accelerating is restricted to a rotation of λ
p
/4 in
phase space, which decreases by a factor 2 the dephasing length from eq. 30.
L
2D
de ph
∼ γ
2
p
λ
p
/2 (31)
In these formulas, one has considered a unique test electron, which has no influence on the
plasma wave. In reality, the massive trapping of particles modifies electric fields and distorts
the plasma wave. Finally, this linear theory is difficult to apply to highly non-linear regimes
which are explored experimentally. Some non-linear effects concerning short pulses are
described in the next section. Nonetheless, these formulas are usefull to scale the experiments.
2.5 Non-linear effects
2.5.1 Ponderomotive force
Let’s take a non-relativistic electron for a short while. In a laser field with a weak intensity,
the average position of an electron is constant. If one only keeps linear terms in fluid equation
there remains, Kruer (1988):
∂
v
e
∂t
(l)
= −
e
m
e
E (32)
The electron directly varies with the electric field. Let’s consider now a laser pulse slightly
more intense, so that the electron velocity becomes slightly non linear
v
e
=
v
e
(l)
+
v
e
(nl )
with
v
e
(nl )
v
e
(l)
. The second order terms satisfy the following equation
∂
v
e
∂t
(nl )
= −(
v
e
(l)
.
∇)
v
e
(l)
−
e
m
e
(
v
e
(l)
∧
B) (33)
By keeping the low frequency component of the equation of motion, i.e. by averaging over an
optical cycle, one obtains
m
e
∂
v
e
(nl )
t
∂t
= −
∇
I
2cn
c
≡
F
p
(34)
295
Laser Plasma Accelerators: Towards High Quality Electron Beam
8 Laser Pulses
F
p
is called the ponderomotive force. This force repels charged particles from regions where
the laser intensity gradient is large. This ponderomotive force
3
derives from a ponderomotive
potential which is written as follow
φ
p
=
I
2cn
c
=
e
2
E
2
4m
e
ω
2
0
(35)
2.5.2 Laser self-focusing
For a laser intensity above 10
19
W/cm
2
, the motion of an electron in an intense laser field
becomes relativistic. In this case, local properties of the medium vary as function of the laser
intensity. In particular, the refractive index in the equation of propagation (eq. 5) depends
on laser intensity η
(I)=η
0
+ η
2
I. The plasma medium acts as a focusing lens for the
electromagnetic field of the laser. If one considers only the relativistic contribution, the critical
power for self-focusing P
c
for a linearly polarized laser pulse
4
is written, Sprangle et al. (1987)
:
P
c
=
8πε
0
m
2
e
c
5
e
2
n
c
n
e
(36)
This formula doesn’t account for other phenomena which also modify the refractive index
: the plasma wave, the ponderomotive effect on the electrons, the ion channel created by a
long prepulse. For instance, the plasma wave tends to defocus the laser pulse, which might
prevent the pulse from self-focusing at P
c
, Ting et al. (1990). Then, because of an electron
density bump at the front of the plasma wave, the laser field in the first plasma bucket can’t
self-focus , Sprangle & Esarey (1992). Consequently, the laser pulse tends to erodes by the
front. In particular, this theory predicts that it’s not possible for a laser pulse shorter than the
plasma wavelength to remain self-focused.
In reality, current experiments use very intense laser pulses a
0
1 and density perturbations
are not linear anymore. Then, consequences on the self-focusing of very short laser pulses are
less obvious.
3. Acceleration mechanisms
At first glance, the electromagnetic field associated to the laser doesn’t seem a good solution to
accelerate electrons: the electric field is mainly transverse to the propagation of the wave and
its direction alternates every half period of the oscillation. Acceleration mechanisms presented
here require an intermediary : the plasma wave. This one is excited by the laser pulse and
allows to create a longitudinal electrostatic field favourable to the acceleration of electrons.
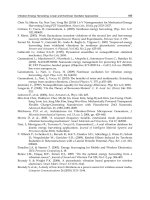
The general diagram is represented on Fig. 2.
In section 2.4.1, a simple model of the electron acceleration in a plasma wave has been
presented. Now, the link between the electromagnetic field of the laser and the plasma wave
has to be described. Several mechanisms have been developed to excite a large-amplitude
plasma wave. These acceleration mechanisms have evolved as the laser pulse duration
shortened and maximal intensity increased. Initially, the acceleration was well described
by linear formulas. Then, as the intensity increased, non-linear mechanisms have appeared
(Raman instability ,Drake et al. (1974), relativistic self-focusing, Mori et al. (1988), relativistic
3
For an intensity I
0
= 1 ×10
19
W/cm
2
and a wavelength 1 μm, one obtains a ponderomotive potential
of φ
p
= 1 MeV
4
For an electron density n
e
= 10
19
cm
−3
, for a laser wavelength λ
0
= 1μm, one obtains a critical power
P
c
= 2TW
296
Laser Pulse Phenomena and Applications
Laser Plasma Accelerators: Towards High Quality Electron Beam 9
Fig. 2. Principle of laser-plasma acceleration : from the interaction of an intense laser pulse
with a gas jet, one obtains an electron beam at the output.
297
Laser Plasma Accelerators: Towards High Quality Electron Beam
10 Laser Pulses
self-modulation ,McKinstrie & Bingham (1992)) which allowed to reach even higher electric
fields and particle beams with unique properties.
3.1 Linear regime
3.1.1 Laser wakefield
Acceleration in a laser wakefield has been introduced by Tajima and Dawson, Tajima &
Dawson (1979). The perturbed electron density driven by the laser pulse is favourable to
the acceleration of particles. The electron density profile obtained behind a gaussian laser
pulse has been reported for a
0
1, Gorbunov & Kirsanov (1987). For a linearly polarized
laser pulse with full width at half maximum (FWHM)
√
2ln2L (in intensity), the normalized
vector potential is written
5
:
a
2
(z,t)=a
2
0
exp
−
k
0
z −ω
0
t
k
p
L
2
(37)
In this case, the associated electric field is
E(z, t)=E
0
√
πa
2
0
4
k
p
Lexp(−k
2
p
L
2
/4)cos(k
0
z −ω
0
t)
e
z
(38)
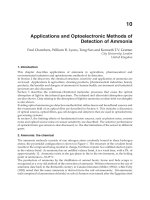
Equation 38 explicitly shows the dependence of the amplitude of the wave with the length of
the exciting pulse. In particular, the maximal value for the amplitude is obtained for a length
L
=
√
2/k
p
(see Fig. 3).
0
0.5
1
1.5
2
2.5
3
3.5
0 0.5 1 1.5 2
E/E
0
in %
Phase k
p
L/π
Fig. 3. Amplitude of the electric field as function of the length of a gaussian laser pulse for a
normalized vector potential a
0
= 0.3.
In figure 4 the density perturbation and the corresponding electric field produced by a 30 fs
laser pulse at low intensity I
l aser
= 3 ×10
17
W/cm
2
are shown. One can note that in the linear
regime the electric field has sinusoidal shape and reach maximal values of a few GV/m.
5
For an electron density n
e
= 10
19
cm
−3
, the optimal pulse duration equals L = 2.4 μm (equivalent to
a pulse duration τ
= 8 fs). For a
0
= 0.3, the maximal electric field is E = 10 GV/m
298
Laser Pulse Phenomena and Applications
Laser Plasma Accelerators: Towards High Quality Electron Beam 11
Fig. 4. density perturbation (top) electric field (bottom) produced in the linear regime.
3.1.2 Non linear regime
Thanks to the development of laser systems with a high power and a short pulse duration
non linear plasma waves can be produced. In the non linear regime the laser pulse excites
at resonance plasma wave with much higher amplitude to which corresponds electric field
100 times larger than in the linear regime. One can notice on figure 5 that the radial density
perturbation has a horse shoe behavior with bent wakes. As a
0
grows, wakes become steeper
and the wave front becomes curved due to the relativistic shift of the plasma frequency.
Fig. 5. density perturbation (top) electric field (bottom) produced in the non linear regime.
3.2 Self-injection
3.2.1 Self modulated wakefield
When the laser power exceeds the critical power for relativistic self-focusing, it temporal
shape can be modulated during the propagation in the plasma medium. For laser pulse longer
than the plasma wavelength the pulse can be ”sausaged” into shorter pulses which excite in a
resonant way the relativistic plasma waves. These effects that have been predicted of the basis
of numerical simulations, Andreev et al. (1992); Antonsen & Mora (1992); Sprangle & Esarey
(1992) are illustrated on Fig. 6. This mechanism, which is very similar to Forward Raman
Scattering instability, can be described as the decomposition of an electromagnetic wave into
a plasma wave an a frequency shifted electromagnetic wave.
299
Laser Plasma Accelerators: Towards High Quality Electron Beam
12 Laser Pulses
−2 0 2
0
0.2
0.4
0.6
0.8
1
I (a. u.)
−2 0 2
0
0.2
0.4
0.6
0.8
1
−2 0 2
0
0.2
0.4
0.6
0.8
1
−2 0 2
−0.2
−0.1
0
0.1
0.2
(z−v (z−v (z−v
ggg
t)/(c t)/(c t)/(cτττ)))
δ n /n
−2 0 2
−0.2
−0.1
0
0.1
0.2
−2 0 2
−0.2
−0.1
0
0.1
0.2
a) c)
k
0
,ω
0
+
k
d
, ω
d
k
p
,ω
p
b)
ee
Fig. 6. Self-modulation of the laser envelope and coupling with the plasma wave amplitude.
Initially, the laser propagates on a plasma density perturbation (a). This modulates the laser
envelope, which increases the coupling with the plasma wave, the amplitude of which
increases (b). Finally, the self-modulation mechanism generates a train of laser pulses spaced
by a plasma wavelength, which resonantly excites a large amplitude plasma wave (c).
During experiments carried out in England in 1994, Modena et al. (1995), the amplitude of
the plasma waves reached the wavebreaking limit, where electrons initially belonging to the
plasma wave are self-trapped and accelerated to high energies. The fact that the external
injection of electrons in the wave is no longer necessary is a major improvement. Electron
spectrum extending up to 44 MeV have been measured during this experiment. This regime
has also been reached for instance in the United States at CUOS, Umstadter et al. (1996), at
NRL, Moore et al. (2004). However, because of the heating of the plasma by these relatively
”long” pulses, the wave breaking occurred well before reaching the cold wave breaking limit,
which limited the maximum electric field to a few 100 GV/m. The maximum amplitude of
the plasma wave has also been measured by Thomson scattering to be in the range 20-60 %,
Clayton et al. (1998).
3.2.2 Forced wakefield
These unique properties of laser-plasma interaction at very high intensity, previously explored
only on very large infrastructures, became accessible for smaller systems, fitted to university
laboratories. These laser systems, also based on chirped pulse amplification, Strickland &
Mourou (1985) and using here Titanium Sapphire crystals, fit in a room of several tens of
meters square and deliver on-target energy of 2-3 J in 30 fs. This corresponds to 100 TW-class
laser systems which can deliver an intensity of a few 10
19
W/cm
2
after focusing. Many
publications have shown that these facilities which deliver a modest energy and operate
at a high repetition rate, can produce energetic electron beams with a quality higher than
300
Laser Pulse Phenomena and Applications
Laser Plasma Accelerators: Towards High Quality Electron Beam 13
10
5
10
6
10
7
10
8
10
9
0 50 100 150 200
Number of electrons dN/dE (/MeV)
Electron Energy (MeV)
Fig. 7. Typical electron spectrum obtained at n
e
= 7.5 ×10
18
cm
−3
with a 1J-30fs laser pulse
focused down to a waist of w
0
= 18μm. The dashed line corresponds to the detection
threshold
larger facilities. For instance, using the laser from ”Salle Jaune” at LOA, electrons have been
accelerated to 200 MeV in 3 mm of plasma, Malka et al. (2002). The mechanism involved is
called forced laser wakefield to distinguish it from the self-modulated regime.
Indeed, thanks to short laser pulses, the heating of the plasma in the forced laser wakefield
is significantly lower than in the self-modulated wakefield. This allows to reach much
higher plasma wave amplitudes and also higher electron energies. Thanks to a limited
interaction between the laser and the accelerated electrons, the quality of the electron beam is
also improved. The measurement of the normalized transverse emittance has given values
comparable to those obtained with conventional accelerators with an equivalent energy
(normalized rms emittance ε
n
= 3π mm.mrad for electrons at 55 ±2 MeV), Fritzler et al. (2004).
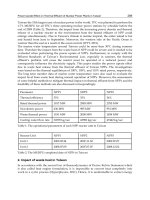
Electron beams with maxwellian spectral distributions (exponential decay, see Fig. 7),
generated by ultra-short laser pulses, have been produced in many laboratories in the world
: at MPQ in Germany, Gahn et al. (1999), at LOA in France, Malka et al. (2001), at NERL in
Japan, Hosokai et al. (2003), and at LBNL in USA, Leemans et al. (2004) for instance.
3.2.3 Bubble regime
More recently, theoretical work based on 3D PIC simulations have shown the existence of a
robust acceleration mechanism called the bubble regime, Pukhov & Meyer-ter-Vehn (2002). In
this regime, the dimensions of the focused laser are shorter than the plasma wavelength in
longitudinal and also transverse directions. Thus, the laser pulse looks like a ball of light with
a radius smaller than 10 μm. If the laser energy contained in this volume is high enough, the
ponderomotive force of the laser expels efficiently electrons from the plasma radially, which
forms a cavity free from electrons behind the laser, surrounded by a dense region of electrons.
Behind the bubble, electronic trajectories intersect each other. A few electrons are injected in
the cavity and accelerated along the laser axis, thus creating an electron beam with radial and
longitudinal dimensions smaller than those of the laser (see Fig. 8).
301
Laser Plasma Accelerators: Towards High Quality Electron Beam
14 Laser Pulses
Fig. 8. Acceleration principle in the bubble regime. Electrons circulated around the cavitated
region before to be trapped and accelerated at the back of the laser pulse
The signature of this regime is a quasi monoenergetic electron distribution. This contrasts
with previous results reported on electron acceleration using laser-plasma interaction. This
properties comes from the combination of several factors :
– The electron injection is different from that in the self-modulated or forced regimes.
Injection doesn’t occur because of the breaking of the accelerating structure. It is localized
at the back of the cavity, which gives similar initial properties in the phase space to injected
electrons.
– The acceleration takes place in a stable structure during propagation, as long as the laser
intensity is strong enough.
– Electrons are trapped behind the laser, which suppresses interaction with the electric field
of the laser.
– Trapping stops automatically when the charge contained in the cavity compensates the ionic
charge.
– The rotation in the phase-space also leads to a shortening of the spectral width of the
electron beam, Tsung et al. (2004).
Several laboratories have obtained quasi monoenergetic spectra : in France, Faure et al. (2004)
with a laser pulse shorter than the plasma period, but also with pulses longer than the plasma
period in England, Mangles et al. (2004), in the United States, Geddes et al. (2004), then in
Japan, Miura et al. (2005) and in Germany, Hidding et al. (2006). The interest of such a beam
is important for applications : it is now possible to transport and to refocus this beam by
magnetic fields. With a maxwellian-like spectrum, it would have been necessary to select an
energy range for the transport, which would have decreased significantly the electron flux.
Electrons in the GeV level were also observed in this regime using in a uniform plasma, Hafz
et al. (2008) or in plasma discharge, i.e, a plasma with a parabolic density profile, Leemans
et al. (2006) with a more powerful laser which propagates at high intensity over a longer
distance.
3.2.4 Colliding laser pulses scheme
The control of the parameters of the electron beam (such as the charge, energy, and relative
energy spread) is a crucial issue for many applications. In the colliding scheme successfully
demonstrated at LOA, it has been shown that not only these issues were addressed but also
that a high improvement of the stability was achieved. In this scheme, one laser beam is used
to create the relativistic plasma wave, and a second laser pulse which when it collides with
302
Laser Pulse Phenomena and Applications
Laser Plasma Accelerators: Towards High Quality Electron Beam 15
Fig. 9. Principle of injection in the counterpropagating colliding pulse scheme. (1) The two
laser pulses have not collided yet; the pump pulse drives a plasma wake (2) The pulses
collide and their interference sets up a beatwave that preaccelerates electrons. (3)
preaccelerated electrons are trapped and further accelerated in the wake.
the main pulse, creates a standing wave which heats locally electrons of the plasma. The
scheme of principle of the colliding laser pulses is shown in Fig 9. The control of the heating
level gives not only the number of electrons which will be trapped and accelerated but also
the volume of phase space, or in other words, the energy spread of the injected electrons
bunch. In the pioneer work of E. Esarey et al., Esarey et al. (1997), a fluid model was used to
describe the evolution of the plasma wave whereas electrons were described as test particles.
Electron trajectories in the beatwave as well as their energy gain were derived analytically
from theory in the case of laser pulses with circular polarization. It has been shown that this
approach fails to describe quantitatively the physics occurring at the pulse collision, Rechatin
et al. (2007). In the fluid approach, the electron beam charge has been found to be one order
of magnitude greater than the one obtained in PIC simulations. For a correct description of
injection, one has to describe properly (i) the heating process, e.g. kinetic effects and their
consequences on the dynamics of the plasma wave during the beating of the two laser pulses,
(ii) the laser pulse evolution which governs the dynamics of the relativistic plasma waves,
303
Laser Plasma Accelerators: Towards High Quality Electron Beam
16 Laser Pulses
Davoine et al. (2008). New unexpected feature have shown that heating mechanism can be
achieved when the two laser pulses are crossed polarized. The stochastic heating can be
explained by the fact that for high laser intensities, the electron motion becomes relativistic
which introduces a longitudinal component through the v
×B force. This relativistic coupling
makes it possible to heat electrons. Thus, the two perpendicular laser fields couple through
the relativistic longitudinal motion of electrons. The heating level is modified by tuning the
intensity of the injection laser beam or by changing the relative polarization of the two laser
pulses. This consequently changes the volume in the phase space and therefore the charge and
the energy spread of the electron beam. When the pulses have the same polarization, electrons
are trapped spatially in the beatwave and can not sustain the collective plasma oscillation
inducing a strong inhibition of the plasma wave which persists after the collision. When the
polarizations are crossed, the motion of electrons is only slightly disturbed compared to their
fluid motion, and the plasma wave is almost unaffected during the collision, which tends
to facilitate trapping. In addition to enhance stability, tuning the electron beam energy can
be achieved by adjusting the position of the collision in the gas jet, Faure et al. (2006). The
collision point can be modied by simply changing the delay between the two laser pulses.
If the lasers collide at the entrance of thegas jet, electrons will be injected at an early stage
and they can be accelerated over the whole gas jet length (2 mm). Thus, their energy will
be high. On the contrary, injection at the exit of the gas jet will limit the acceleration length
and will lead to a low energy beam. The robustness of this scheme has also allow to carry
out very accurate studies of the dynamic of electric field in presence of high current electron
beam. This beam loading effect has been used to reduce the relative energy spread of the
electron beam. We have shown that there is an optimal load can flattened the electric field in
such suitable way that a very small, 1%, relative energy spread electron beam can outcome
form the target as shown on figure 10 . In this case, the more energetic electrons are slightly
slow down and accelerated at the same energy that the slower one. In case of lower charge,
this effect doesn’t play any role and the energy spread depend mainly of the heating volume.
For higher charge, the load is too high and the most energetic electrons slow down too much
that they get energies even smaller that the slower one, Rechatin et al. (2009), increasing the
relative energy spread. The optimal load was observed experimentally in agreement with full
3D PIC simulations, its corresponds to a current in the 20-40 kA. The decelerating electric field
due to the electron beam was found to be in the GV/m/pC .
4. Future of the laser-based acceleration
Conventional accelerator technology has progressed through a long road paved by scientific
challenges. A recent example is the development of superconductivity for high current
acceleration in RF cavity, which has required tens of years of theoretical investigations and
experimentations to understand the physical processes and finally to control the technology
which has been successfully used in accelerators such as LEP/LHC (CERN), or HERA
(DESY-Hamburg). Laser plasma accelerator researches follow the same road paved with many
successful (and unsuccessful) experiments. Thanks to this pioneering works and judging
from the incredible results achieved over the last three years, the time has come where a
technological approach has to be considered. Two stages laser plasma accelerators schemes
should allow the development of few GeV electron beam with a small relative energy spread
and emittance, Malka et al. (2006). In parallel, fundamental and experimental research should
of course be pursued to explore new regimes and to validate theories and numerical codes.
The improvement of the laser plasma interaction with the evolution of short-pulse laser
304
Laser Pulse Phenomena and Applications
Laser Plasma Accelerators: Towards High Quality Electron Beam 17
Fig. 10. Typical spectrum obtained in the colliding laser pulse scheme showing a 1% relative
energy spread.
technology, a field in rapid progress, will still improve this new and very promising approach
which potential societal applications in material science, medicine, chemistry and radiobiolgy,
Malka et al. (2008). The ultra short duration (few fs) of the electron beam, Rechatin et al. (2010),
and consequently his very high current (few kA) comparable to the one delivers at SLAC for
LCLS experiment, where very bright X rays beam was produced by saturating the gain of
their free electron laser, indicate that laser plasma accelerators should play a significant role
in the compactness of free electron laser design and achievement.
5. Acknowledgements
I acknowledge warmly J. Faure, Y. Glinec, C. Rechatin, X. Davoine, E. Lefebvre, and A.
Lifschitz who have largely contributed during this last decade to the work I presented in this
book chapter. I also acknowledge the support of the European Research Council for funding
the PARIS ERC project (contract number 226424), of the European Community-Research
Infrastructure Activity under the FP6 and of European Community ”Structuring the European
Research Area” program (CARE, contract number RII3-CT-2003-506395), of the European
Community-New and Emerging Science and Technology Activity under the FP6 ”Structuring
the European Research Area” program (project EuroLEAP, contract number 028514), and of
the French national agency ANR-05-NT05-2-41699 ”ACCEL1”.
6. References
Andreev, N. E., Gorbunov, L. M., Kirsanov, V. I., Pogosova, A. A. & Ramazashvili, R. R. (1992).
Resonant excitation of wakefields by a laser pulse in a plasma, JETP Lett 55: 571.
Antonsen, Jr., T. M. & Mora, P. (1992). Self-focusing and Raman scattering of laser pulses in
tenuous plasmas, Phys. Rev. Lett. 69(15): 2204–2207.
Clayton, C. E., Tzeng, K C., Gordon, D., Muggli, P., Mori, W. B., Joshi, C., Malka, V.,
Najmudin, Z., Modena, A., Neely, D. & Dangor, A. E. (1998). Plasma wave generation
in a self-focused channel of a relativistically intense laser pulse, Phys. Rev. Lett.
81(1): 100.
305
Laser Plasma Accelerators: Towards High Quality Electron Beam
18 Laser Pulses
Davoine, X., Lefebvre, E., Faure, J., Rechatin, C., Lifschitz, A. & Malka, V. (2008). Simulation
of quasimonoenergetic electron beams produced by colliding pulse wakefield
acceleration, Phys. Plasmas 15(11): 113102.
Drake, J. F., Kaw, P. K., Lee, Y. C., Schmidt, G., Liu, C. S. & Rosenbluth, M. N. (1974). Parametric
instabilities of electromagnetic waves in plasmas, Phys. Fluids 17(4): 778.
Esarey, E., Sprangle, P., Krall, J. & Ting, A. (1997). Self-focusing and guiding of short laser
pulses in ionizing gazes and plasmas, IEEE J. Quant. Electron. 33(11): 1879–1914.
Faure, J., Glinec, Y., Pukhov, A., Kiselev, S., Gordienko, S., Lefebvre, E., Rousseau, J P., Burgy,
F. & Malka, V. (2004). A laser-plasma accelerator producing monoenergetic electron
beams, Nature 431: 541–544.
Faure, J., Rechatin, C., Norlin, A., Lifschitz, A., Glinec, Y. & Malka, V. (2006). Controlled
injection and acceleration of electrons in plasma wakefields by colliding laser pulses.,
Nature 444: 737–739.
Fritzler, S., Lefebvre, E., Malka, V., Burgy, F., Dangor, A. E., Krushelnick, K., Mangles, S. P. D.,
Najmudin, Z., Rousseau, J P. & Walton, B. (2004). Emittance measurements of a
laser-wakefield-accelerated electron beam, Phys. Rev. Lett. 92(16): 165006.
Gahn, C., Tsakiris, G. D., Pukhov, A., Meyer-ter-Vehn, J., Pretzler, G., Thirolf, P., Habs, D. &
Witte, K. J. (1999). Multi-MeV electron beam generation by direct laser acceleration
in high-density plasma channels, Phys. Rev. Lett. 83(23): 4772–4775.
Geddes, C. G. R., T
´
oth, C., van Tilborg, J., Esarey, E., Schroeder, C. B., Bruhwiler, D., Nieter, C.,
Cary, J. & Leemans, W. P. (2004). High quality electron beams from a laser wakefield
accelerator using plasma-channel guiding, Nature 431: 538–541.
Gorbunov, L. M. & Kirsanov, V. I. (1987). Excitation of plasma waves by an electromagnetic
wave packet, Sov. Phys. JETP 66: 290–294.
Hafz, N., Jeong, T. M., Choi, I. W., Lee, S. K., Pae, K. H., Kulagin, V. V., Sung, J. H., Yu, T. J.,
Hong, K H., Hosokai, T., Cary, J. R., Ko, D K. & Lee, J. (2008). Stable generation
of GeV-class electron beams from self-guided laserplasma channels, Nature Photonics
2: 571–577.
Hidding, B., Amthor, K U., Liesfeld, B., Schwoerer, H., Karsch, S., Geissler, M., Veisz, L.,
Schmid, K., Gallacher, J. G., Jamison, S. P., Jaroszynski, D., Pretzler, G. & Sauerbrey,
R. (2006). Generation of quasimonoenergetic electron bunches with 80-fs laser pulses,
Phys. Rev. Lett. 96(10): 105004.
Hosokai, T., Kinoshita, K., Zhidkov, A., Nakamura, K., Watanabe, T., Ueda, T., Kotaki, H.,
Kando, M., Nakajima, K. & Ueseka, M. (2003). Effect of a laser prepulse on a
narrow-cone ejection of mev electrons from a gas jet irradiated by an ultrashort laser
pulse, Phys. Rev. E 67: 036407.
Khachatryan, A. G., van Goor, F. A., Boller, K J., Reitsma, A. J. W. & Jaroszynski, D. A.
(2004). Extremely short relativistic-electron-bunch generation in the laser wakefield
via novel bunch injection scheme, Phys. Rev. ST Accel. Beams 7(12): 121301.
Kruer, W. L. (1988). The physics of laser plasma interactions, Addison-Wesley, New-York.
Leemans, W. P., Nagler, B., Gonsalves, A. J., T
`
oth, C., Nakamura, K., Geddes, C. G. R.,
Esarey, E., Schroeder, C. B. & Hooker, S. M. (2006). GeV electron beams from a
centimetre-scale accelerator, Nature Physics 2: 696–699.
Leemans, W. P., van Tilborg, J., Faure, J., Geddes, C. G. R., T
´
oth, C., Schroeder, C. B., Esarey, E.,
Fubiani, G. & Dugan, G. (2004). Terahertz emission from laser accelerated electron
bunches, Phys. Plasmas 11(5): 2899.
Malka, V., Faure, J., Gauduel, Y. A., Lefebvre, E., Rousse, A. & Ta Phuoc, K. (2008). Principles
306
Laser Pulse Phenomena and Applications
Laser Plasma Accelerators: Towards High Quality Electron Beam 19
and applications of compact laserplasma accelerators, Nature Physics 44: 447–453.
Malka, V., Faure, J., Marqus, J R., Amiranoff, F., Rousseau, J P., Ranc, S., Chambaret, J P.,
Najmudin, Z., Walton, B., Mora, P. & Solodov, A. (2001). Characterization of electron
beams produced by ultrashort (30 fs) laser pulses, Phys. Plasmas 8: 0.
Malka, V., Fritzler, S., Lefebvre, E., Al
´
eonard, M M., Burgy, F., Chambaret, J P., Chemin, J F.,
Krushelnick, K., Malka, G., Mangles, S. P. D., Najmudin, Z., Pittman, M., Rousseau,
J P., Scheurer, J N., Walton, B. & Dangor, A. E. (2002). Electron acceleration by a
wake field forced by an intense ultrashort laser pulse, Science 298: 1596–1600.
Malka, V., Lifschitz, A., Faure, J. & Glinec, Y. (2006). Staged concept of laser-plasma
acceleration toward multi-gev electron beams, Phys. Rev. ST Accel. Beams 9(9): 091301.
Mangles, S., Murphy, C. D., Najmudin, Z., Thomas, A. G. R., Collier, J. L., Dangor, A. E.,
Divall, A. J., Foster, P. S., Gallacher, J. G., Hooker, C. J., Jaroszynski, D. A., Langley,
A. J., Mori, W. B., Nooreys, P. A., Viskup, R., Walton, B. R. & Krushelnick, K. (2004).
Mono-energetic beams of relativistic electrons from intense laser plasma interactions,
Nature 431: 535.
McKinstrie, C. J. & Bingham, R. (1992). Stimulated Raman forward scattering and the
relativistic modulational instability of light waves in rarefied plasma, Phys. Fluids
B 4(8): 2626.
Miura, E., Koyama, K., Kato, S., Saito, S., Adachi, M., Kawada, Y., Nakamura, T. & Tanimoto,
M. (2005). Demonstration of quasi-monoenergetic electron-beam generation in
laser-driven plasma acceleration, Appl. Phys. Lett. 86: 251501.
Modena, A., Dangor, A., Najmudin, Z., Clayton, C., Marsh, K., Joshi, C., Malka, V., Darrow,
C., Neely, D. & Walsh, F. (1995). Electron acceleration from the breaking of electron
plasma waves, Nature 377: 606–608.
Moore, C., Ting, A., Krushelnick, K., Esarey, E., Hubbard, R., Hafizi, B., Burris, H., Manka, C.
& Sprangle, P. (2004). Electron trapping in self-modulated laser wakefields by raman
backscatter, Phys. Rev. Lett. 79: 3909.
Mora, P. (1992). Particle acceleration in a relativistic wave in the adiabatic regime, Phys. Fluids
B 4(6): 1630–1634.
Mori, W. B., Joshi, C., Dawson, J. M., Forslund, D. W. & Kindel, J. M. (1988). Evolution
of self-focusing of intense electromagnetic waves in plasma, Phys. Rev. Lett.
60(13): 1298–1301.
Pukhov, A. & Meyer-ter-Vehn, J. (2002). Laser wake field acceleration: the highly non-linear
broken-wave regime, Appl. Phys. B 74: 355–361.
Rechatin, C., Davoine, X., Lifschitz, A., Ismail, A. B., Lim, J., Lefebvre, E., Faure, J. & Malka,
V. (2009). Observation of beam loading in a laser-plasma accelerator, Phys. Rev. Lett.
103(19): 194804.
Rechatin, C., Faure, J., Davoine, X., Lundh, O., Lim, J., Ben-Ismal, A., Burgy, F., Tafzi, A.,
Lifschitz, A., Lefebvre, E. & Malka, V. (2010). Characterization of the beam loading
effects in a laser plasma accelerator, New Journal of Physics 12(4): 045023.
Rechatin, C., Faure, J., Lifschitz, A., Malka, V. & Lefebvre, E. (2007). Plasma wake inhibition at
the collision of two laser pulses in an underdense plasma, Phys. Plasmas 14(6): 060702.
Sprangle, P. & Esarey, E. (1992). Interaction of ultrahigh laser fields with beams and plasmas,
Phys. Fluids B 4(7): 2241.
Sprangle, P., Tang, C H. & Esarey, E. (1987). Relativistic self-focusing of short-pulse radiation
beams in plasmas, IEEE Trans. Plasma Sci. PS-15(2): 145–153.
Strickland, D. & Mourou, G. (1985). Compression of amplified chirped optical pulses, Opt.
307
Laser Plasma Accelerators: Towards High Quality Electron Beam
20 Laser Pulses
Comm. 56: 219–221.
Tajima, T. & Dawson, J. M. (1979). Laser electron accelerator, Phys. Rev. Lett. 43(4): 267.
Ting, A., Esarey, E. & Sprangle, P. (1990). Nonlinear wake-field generation and relativistic
focusing of intense laser pulses in plasmas, Phys. Fluids B 2(6): 1390.
Tsung, F. S., Narang, R., Mori, W. B., Joshi, C., Fonseca, R. A. & Silva, L.
(2004). Near-gev-energy laser-wakefield acceleration of self-injected electrons in a
centimeter-scale plasma channel, Phys. Rev. Lett. 93(18): 185002.
Umstadter, D., Chen, S Y., Maksimchuk, A., Mourou, G. & Wagner, R. (1996). Nonlinear
optics in plasmas and laser wake field acceleration of electrons, Science 273: 472.
308
Laser Pulse Phenomena and Applications
15
Mechanisms of Nanoparticle Formation by
Laser Ablation
Tatiana Itina
1
and Karine Gouriet
2
1
CNRS/University of Lyon,
2
CNRS/Ecole des Mines de Saint-Etienne,
France
1. Introduction
During the last decade, numerous experiments have been performed, clearly demonstrating
that an interaction of a short (several nanoseconds or shorter) laser pulse with a solid target
leads to the formation of nanoparticles. This technique, known as pulsed laser ablation
(PLA), has become a promising method of the synthesis of nanoclusters for photonics,
electronics and medicine (Movtchan et al., 1995; Yamada et al., 1996; Makimura et al., 1996;
Geohegan et al., 1998; Albert et al., 2003). The PLA method has several advantages
compared to more traditional techniques. In particular, it was shown that this method
provides a possibility for chemically clean synthesis, which is difficult to achieve under
more conventional nanoparticle production conditions. In addition, several experimental
studies indicated that the cluster size distribution could be controlled in PLA by carefully
choosing the laser irradiation parameters and properties of the background gas.
Furthermore, laser ablation allows for an easy production of colloidal metal nanoparticles
for biological and medical applications.
Despite the large number of the experimental results, the theoretical understanding of the
physical and chemical mechanisms leading to the formation of nanoparticles during the
PLA is still lacking. The number of theoretical studies of these mechanisms remains limited
because both the continuum hydrodynamic models and the classical nucleation theory
become inapplicable under the typical PLA conditions. Under these conditions, laser plume
expansion and all collisional processes inside the plume occur so rapidly that equilibrium
conditions are not attained. In addition, fast laser energy deposition may induce an
explosive volume ejection rather than an equilibrium surface evaporation. Nevertheless, the
laser ablation process is often described by a thermal desorption model, which considers the
ablation as a rather slow layer-by-layer evaporation of monomers from the target surface
(Anisimov, 19968). The presence of nanoparticles in the laser plume is then explained by
using a Zel’dovich-Raizer condensation model (Zeldovich, 1966; Luk’yanchuk et al., 1998;
Gusarov et al., 2000). This approach is appropriate for interpretation of the experimental
findings obtained in laser ablation with hundred of nanoseconds and longer laser pulses,
and in the presence of a background gas (Ohkubo et al., 2003; Boldarev et al., 2001). In the
PLA with shorter laser pulses, however, clusters can be ejected directly from the target as a
result of the target disintegration by laser-induced explosion-like process (Bulgakov, 2004;
Amoruso et al., 2004; Zhigilei, 2003). In this case, the common thermal desorption and
Laser Pulse Phenomena and Applications
310
condensation model is insufficient and only a detailed molecular-level simulation can
provide a complete description of the nanoparticle formation process. One of the possible
approaches for such simulations is to combine the molecular dynamics technique (MD) with
the direct simulation Monte Carlo method (DSMC) (Zhigilei & Garrison, 2000; Bird, 1994;
Itina et al., 2002; Zeifman et al., 2002; Mizuseki et al., 2001; Briehl & Urbassek, 1999). This
combination allows one to properly account for both the processes of cluster ejection and
their following evolution during the laser plume expansion as a result of the gas-phase
collisions.
So far, only several theoretical models were proposed to explain the growth of
nanoparticles. For instance, such models as the model of Rice Ramsperger and Kassel (RRK)
(Malakhovskii & Ben-Zion, 2002) and the Classical Nucleation Theory (CNT) were used in
many studies (Kinjo et al. 1999; Zhong et al., 2006; Schenter et al., 1999). An alternative
approach that can be successfully used for the investigation of the condensation-evaporation
processes in small systems is based on the molecular dynamics (MD) method. In this
method, molecular movement and interactions are simulated directly and one can easily
study system dynamics (Kinjo et al. 1999; Zhong et al., 2006; Frenkel & Smit, 1996).
Therefore, MD was also used to study the formation and evolution processes of clusters of
many materials, and the advantages of this approach were demonstrated (Malakhovskii &
Ben-Zion, 2002; Zhong et al., 2006).
Here, first we study the evolution of clusters in the presence of the same gas species. The
study focuses on the influence of the surrounding gas and cluster parameters on the time
evolution of clusters and small molecules formed in typical laser ablation experiments. The
cluster parameters, such as cluster temperature and size, are chosen based on the cluster
properties found in the ablation calculations. In the same way, the corresponding
characteristics of the surrounding environment, such as gas density and temperature, are set
to represent the ablated plume. Calculations are performed for two different materials,
molecular matrix and metal. The roles of both simulation parameters and material
properties are investigated. The applicability of the RRK theory is verified.
Then, we present the numerical results obtained with a hybrid MD-DSMC model of PLA for
different laser pulses and fluences. The objective of this study is to bridge a gap between the
previous molecular dynamics simulations and typical ablation experiments. In fact, the
proposed combination of methods allows us to attain both time and length scales typical for
ablation experiments. By using the combined model, we investigate the time evolution of
clusters in the plume. We examine different types of collisions leading to cluster growth and
decay. As a result, we determine the major collisional processes responsible for the observed
changes in cluster distributions. These results are related to the recent experimental results
on the ablation plume dynamics.
2. Simulation details
2.1 MD calculations of cluster evolution
In the first part of our calculations, classical molecular dynamics (Frenkel & Smith, 1996 and
Zhigilei et al., 1998)
is used to study a system composed by a nickel cluster surrounded by a
gas of the same atoms. In many applications, metal nanoparticles are used due to their
optical (plasmonic), and chemical (sensing) properties (Amoruso et al., 2007). The effective
Embedded Atom Model (EAM) potential (Daw & Baskes, 1984) is used in these calculations.
This force field contains two terms: a pairwise additive interaction φ of the atomic cores
Mechanisms of Nanoparticle Formation by Laser Ablation
311
shielded at short interatomic distances and secondly a contribution F(ρ) of delocalized
electrons to the energy, which is modeled by multi-body term assuming a linear
superposition ρ
i
of atomic electron densities ρ
at.
The energy of an atom i can be written as
()
1
2
iii i
j
i
j
ij
EF r
ρφ
≠
=+
⎡⎤
⎣⎦
∑
(1)
The subscripts i and j run over the number of atoms N in the system. A cut-off radius of
0.53 nm is used for the electron density and the pair potential contribution to the Ni-Ni
interaction.
First, we form a cluster of N particles with the initial temperature T
0
. Then, a background
gas is generated based on the corresponding gas number density and temperature. The
volume of the cell is constant and equal to 100×100×100 nm
3
. Periodic boundary conditions
in all directions are imposed. After generating the gas, we heat it, so that each gas particles
has a velocity based on the Maxwell-Boltzmann distribution with a given gas temperature.
Then the cluster is located in the center of the cell. Thus, we can vary four basic parameters:
two for the cluster (initial temperature and size) and two for the gas (temperature and
density).
In the calculations, we monitor the following processes (i) simple collision
coll
ii
AA AA
ν
+
←⎯ ⎯→+
with the collision rate ν
coll
; and (ii) evaporation and condensation processes
,
1
ec
ii
AA A
νν
+
+←⎯⎯→
with reaction rates ν
e
and ν
c
respectively. The ν
e
(or ν
c
) rate is calculated as the ratio of the
number of evaporated cluster molecules (or condensated gas molecules on the cluster) with
the time step δt. This time step is sufficiently larger than the MD calculation time step (1 fs for
nickel) and in order to 50 ps. Calculations typically continue until about 3 ns. This time delay
is long enough for the establishment of a dynamic equilibrium between the evaporation and
condensation processes. This condition corresponds to ~2 ns in the present calculations.
To determine the number of cluster molecules, we used the neighbor method. Before starting
the simulation, we define differently the both cluster and gas molecules. We calculate the
neighbor list at each 25 fs, and the cluster molecule list at each 50 ps. If a molecule own the
cluster at the last step is not in the new list, this molecule is evaporated and we increased the
number of evaporated molecules N
eva
; and inversely. To investigate the influence of each
parameter on the others, we ran several simulations with 3 fixed parameters.
The cluster evaporation process can be described as unimolecular thermal decomposition
process by using the RRK theory (Malakhovskii & Ben-Zion, 2002 21). In the RRK theory,
the evaporation and the condensation of clusters are controlled by the sublimation energy
1nnn
DEE
−
=−
, where E
n
is the absolute binding energy of the cluster with n molecules. The
evaporation rate is defined as following
1
0
n
s
RRK
nn
en
n
ED
ν ν g
E
−
⎡⎤
−
=
⎢⎥
⎣⎦
(2)
Laser Pulse Phenomena and Applications
312
where ν
0
is the typical molecular vibrational frequency, ν
n
is the number of vibrational
degrees of freedom (1 for dimers and 3N-6 for larger clusters), g
n
is the number of surface
molecules and D
n
is the molecular evaporation energy. For clusters larger than 50 molecules
in size, the evaporation rate can be approximate by
0
exp
RRK
n
en
n
D
ν ν g
E
⎡
⎤
=−
⎢
⎥
⎣
⎦
(3)
For large clusters, we use the following approximations (Malakhovskii & Ben-Zion, 2002)
()
2
1/3 1/3
(36 ) 1
n
gN
π
=− (4)
In addition, we can approximate the condensation rate by the collision rate of monomers
with the cluster
()
2
0cn
crr
ν
πρ
=+ (5)
The average thermal velocity of the monomers in the gas is
(
)
8
Bg
ckTm
π
= , ρ is the monomer
density, k
B
is Boltzmann’s constant, T
g
is the gas temperature and m is the molecular mass, r
0
and r
n
are the hard sphere equivalent radius of a monomer and a cluster. In this expression for
the condensation rate, we approximate the cross section by the surface area of a sphere of
radius r
n
and assume unit sticking probability upon collision. The hard sphere equivalent
radius is calculated based on the gyration radius of the cluster r
gyr
(Arunachalam et al., 1999).
0
5
2
n gyr
rrr
=
+ (6)
To compare the calculation results with the RRK theory, we calculate the evaporation and
condensation rates for a set of simulation parameters (cluster size and temperature and gas
density and temperature and interatomic potentials) that corresponds to the typical laser
applications, such as laser ablation experiments (Handschuh et al., 1999; Vitiello et al; 2005).
2.2 Combined MD-DSMC numerical model
A combined MD-DSMC model is developed for the calculation of the laser plume formation
and long-term evolution. In the model, two different numerical methods are used (i)
molecular dynamics for target material disintegration and ejection of a mixture of clusters
and monomers (14); and (ii) direct simulation Monte Carlo for the calculation of large-scale
three-dimensional plume evolution (Itina et al., 1997). Here, as in the previous MD
calculations (Zhigilei et al., 1998; Zeifman et al., 2002), the breathing sphere model is
adopted to model laser pulse absorption and relaxation processes in the MD part. The
calculation parameters in the MD part are the same as in these calculations for a molecular
solid target. The pulse duration was set to be 15 ps.
The transition between the DSMC and MD calculations is performed by using MD results
obtained at 1 ns after the laser pulse for the design of the initial conditions for the
subsequent DSMC calculation. The collision probabilities in DSMC calculations are
parameterized to describe the material properties in a gas phase, such as viscosity coefficient
and velocity dependence of the equivalent collision cross sections.
Mechanisms of Nanoparticle Formation by Laser Ablation
313
To couple the two models, all plume species are divided into five groups depending on their
size. The groups are chosen as follows: 1 - monomers, 2 - clusters of 2 to 15 molecules, 3 -
clusters of 16 to 100 molecules, 4 - clusters of 101 to 1000 molecules, and 5 - clusters of more
than 1000 molecules. The calculations are performed with laser pulse duration of 15 ps and
an absorbed laser fluence of 61.38 J/m
2
. Cluster size is sampled in each group according to
the size distributions obtained in the MD simulation.
In the present study, we assume that the spatial laser beam profile is top hat and the radial
expansion of the ablation plume is small during the first MD stage. Therefore, the radial
distributions of the simulation parameters are assumed to be uniform within the laser spot.
The axial distributions of the initial DSMC parameters are determined by fitting the axial
distributions of density, velocity, radial and axial temperatures for different groups obtained
from the MD calculations. To fit the axial density distributions, we use normal distribution
functions
()
2
2
() exp /2
2
i
iii
i
d
fz z
μσ
σπ
⎡
⎤
=−−
⎢
⎥
⎣
⎦
(7)
where z is the distance from the initial target surface. The parameters d
i
,
μ
i
, and
σ
i
are
calculated from numerical fits to the MD results performed for each group, and i=1-5. The
linear dependencies
()
iii
gz Az B
=
− (8)
are used to fit axial velocity distributions, where A
i
and B
i
are fitting parameters for each
component (Zhigilei, 2003). The distributions of the axial and radial temperatures as well as
the internal temperatures of the clusters are fitted by six-order polynomial dependencies.
More details of the procedure used for the statistical description of the output of MD
simulations will be presented elsewhere.
2.3 Modification of the DSMC method used for the calculation of ablation flows with
clusters
In the DSMC simulations, the laser plume is modeled by an ensemble of simulated particles
(here, about 8⋅10
6
). The simulated particles are introduced based on the gas-dynamic
parameters obtained from the MD simulations of the initial stage of the plume formation.
The physical space is divided into a network of cells with dimensions smaller than the local
mean free path. The time is incremented by a small time step Δt. The calculations consist in
the repetition of three main steps: (i) indexing of the simulated particles; (ii) calculation of a
representative set of collisions and chemical reactions in each cell; (ii) movement of the
simulated particles and calculation of the interactions with the boundaries (Bird, 1994). In
the present work, collisions are calculated for all particles together based on their
probabilities by using a NTC technique (Bird, 1994).
The initial and boundary conditions are set as follows. At the beginning, simulated particles
are introduced according to the distributions calculated by MD as described in Section 2.2
above. The axis r = 0 is set to be the axis of radial symmetry. At the target surface (Z = 0), a
partial diffuse reflection and re-deposition of particles is sampled by using an
accommodation coefficient. The accommodation coefficient of the target surface is set to be
Laser Pulse Phenomena and Applications
314
0.5 in this work. The simulated volume is increased several times during the calculation to
cover the plume expansion region.
The calculation of collisions and reactions in the present DSMC includes the treatment of the
following processes
i.
elastic collisions;
ii.
inelastic non-reactive collisions;
iii.
sticking reactions in cluster – molecule collisions;
iv.
aggregation reactions in cluster – cluster collisions;
v.
cluster evaporation reactions.
The non-reactive collisions are calculated based on the conservation laws of energy and
momentum. For clusters, the reference cross-sections are computed based on their effective
radii
1/3
n
ran b=+
, where a=3.97 Å, b=1.59 Å, n is the number of monomers in the cluster. A
soft-spheres collision model is used in the present modeling calculation. As we described
above, the initial values of the internal energy,
E
n
, are assigned to each cluster based on the
internal temperature distribution obtained from the MD simulation and the number of
degree freedom in the cluster. To describe the internal energy modification in clusters and
small molecules, Larsen-Borgnakke statistical model (Bird, 1994) is used. Sticking process is
included for collisions in which the relative translational energy before the collision is
smaller than the binding energy of the final cluster. In this case, the sticking of two clusters
containing
n
1
and n
2
molecules occurs with the probability (Hittema & McFeaters, 1996)
()
10 12
x
pp nn
−
=× (9)
where
x is a parameter (x = 1/12 in the present simulation (33)), and p
0
is a constant. The
parameters in (3) are selected based on a separate MD study of cluster evolution in a gas (to
be published in a forthcoming paper). The binding energy in each cluster is given by a
combination of volume and surface terms
2/3
bV s
Eanan=− (10)
where
a
V
and a
S
are material constants and n is the number of molecules in the cluster. To
ensure the energy conservation in the sticking reaction, the relative translational energy of
the monomer and cluster was transferred into the internal energy of the resulting cluster,
whereas the center-of-mass velocity was conserved.
The rate of evaporation from a cluster of
n atoms with internal energy E
n
is calculated
according to a simple exponential decay (Brady et al., 1979)
0
ln /
ev
NN kt=− , (11)
where
ev
k
is the decay constant, or the rate coefficient (Jarold, 1994).
3. Results and discussion
3.1 Cluster evolution
A series of calculation are performed for a cluster with different initial size, but with the same
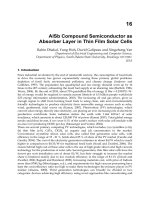
initial cluster temperature and gas density and temperature. Calculation results demonstrate
that both evaporation [Fig. 1(a)] and condensation [Fig. 1(b)] rates increase with initial cluster
Mechanisms of Nanoparticle Formation by Laser Ablation
315
size. The size dependencies are fitted by a polynomial function with the same order of the size
function in theoretical rates. We obtain a reasonable agreement between the theoretical fits
and our results. The evaporation and condensation rates are larger than 1.2 10
11
s
-1
for clusters
containing around 500 atoms and larger than 2.0 10
11
s
-1
for N>1200 atoms.
Furthermore, the initial cluster temperature is varied, keeping other initial parameters equal
to those in the previous series of calculations. Simulations results demonstrate that the
evaporation rate (Fig. 2(a)) decreases exponentially with the inverse of cluster temperature,
while the cluster temperature dependency of the condensation rate is not significant
(Fig.2(b)). In addition, one can see that the calculated dependency of evaporation rate can
be described by the RRK theory. In the RRK theory, the evaporation rate exponentially
decreases with cluster temperature and the coefficient in the exponential (sublimation
energy) corresponds to the minimal kinetic energy required to obtain a significant
evaporation. Our results show that we can determine the sublimation energy D
N
for the
clusters. For instance, for nickel cluster with 604 atoms, we found D
N
= 1.725 eV.
Fig. 1. (a) Condensation rate as a function of R cluster radius of nickel. The condensation
rate is fitted by a function given by the collision rate such as A + B(r
1
+R)
2
, where A=-1.973
1010 s
-1
and B=1.181 10
29
s
-1
m
-2
. (b) Evaporation rate as a function of the number of atoms,
N, in a nickel cluster. The evaporation rate is fitted by a function given by the RRK
evaporation rate. These results are obtained for clusters of different sizes heated initially to
2400 K in a gas with the number density of 10
19
cm
-3
at 5036 K.