báo cáo hóa học: " Comparison of immature and mature bone marrow-derived dendritic cells by atomic force microscopy" potx
Bạn đang xem bản rút gọn của tài liệu. Xem và tải ngay bản đầy đủ của tài liệu tại đây (2.99 MB, 9 trang )
NANO EXPRESS Open Access
Comparison of immature and mature bone
marrow-derived dendritic cells by atomic force
microscopy
Feiyue Xing
1*
, Jiongkun Wang
1
, Mingqian Hu
2
,YuYu
3,4
, Guoliang Chen
1
and Jing Liu
5*
Abstract
A comparative study of immature and mature bone marrow-derived dendritic cells (BMDCs) was first performed
through an atomic force microscope (AFM) to clarify differences of their nanostructure and adhesion force. AFM
images revealed that the immature BMDCs treated by granulocyte macrophage-colony stimulating factor plus IL-4
mainly appeared round with smooth surface, whereas the mature BMDCs induced by lipopolysaccharide displayed
an irregular shape with numerous pseudopodia or lamellapodia and ruffles on the cell membrane besides
becoming larger, flatter, and longer. AFM quantitative analysis further showed that the surface roughness of the
mature BMDCs greatly increased and that the adhesion force of them was fourfold more than that of the
immature BMDCs. The nano-features of the mature BMDCs were supported by a high level of IL-12 produced from
the mature BMDCs and high expression of MHC-II on the surface of them. These findings provide a new insight
into the nanostructure of the immature and mature BMDCs.
Keywords: dendritic cell, nanostructure, adhesion force, comparison
Introduction
Dendritic cells (DCs) are the most potent specialized
antigen-presenting cells, which bridge the innate and
adaptive immune response, controlling both immunity
and tolerance. It is well known that DCs may be derived
from bone marrow progenitors with two major develop-
mental stages: immature and mature DCs [1]. The
development of immature DCs can be induced with
using cytokines, such as granulocyte macrophage-colony
stimulating factor (GM-CSF) [2], FMS-like tyrosine
kinase 3 (FLT3) [3], or cytokine cocktails containing
GM-CSF +/-IL-4 [4] in vitro. After stimulation of lipo-
polysaccharide (LPS), poly I:C or thymic stromal lym-
phopoietin (TSLP), immature DCs can further
differentiate into mature DCs, with increase of IL-12
and up-regulation of MHC-II, CD40, CD80, CD83, and
CD86 molecules on the surface of DCs [5,6]. The
maturation status of DCs is relatively important for
them whether to induce immune tolerance or to initiate
immune response. It is well proved that the transition
from immature DCs to mature DCs is accompanied by
morphol ogical changes to be suitable for requirement of
immunological function changes of DCs. Scanning elec-
tron microscopy (SEM) is a conventional tool for ima-
ging cell morphology, which requires a conductiv e
surface and a high-vacuum condition [7]. By contrast,
atomic force microscopy (AFM), with continuously
growing uses in investigating biomaterials, can be oper-
ated directly in air, vacuum, or physiological conditions
with nanomete r lateral resolution [7,8] . Furthermore,
AFM is capable of providing quantitative analysis of cell
surface and adhesion force features. Although the mor-
phology of DCs has early been observed by conventional
optical microcopy, SEM, and transmission electron
microcopy methods [7,9], comparison of immature and
mature DCs has not been, to date, carried out using
AFM. Therefore, it is necessary to find out nanostruc-
ture of DCs, especially different na no-properties and
adhesive force that cannot be discovered by optical and
electron microscopy. In this study, AFM was exploited
to reveal differences of the nano-features and adhesive
* Correspondence: ;
1
Institute of Tissue Transplantation and Immunology, Jinan University,
Guangzhou 510632, China
5
Department of Stomatology, Jinan University, Guangzhou 510632, China
Full list of author information is available at the end of the article
Xing et al . Nanoscale Research Letters 2011, 6:455
/>© 2011 Xing et al; lic ensee Springer. This is a n Open Access article distributed under the terms of the Creative Commons Attribution
License ( which permits unrestricted use, distribution, and reproduction in any medium,
provided the original work is prop erly cited.
force between both immature and mature bone marrow-
derived dendritic cells (BMDCs). Obviously, this study
would provide a novel insight into the nanostructure
and force feature of immature and mature DCs.
Materials and methods
Preparation of bone marrow cells
Bone marrow-derived dendritic cells were generated
according to Lutz’s publication [10] with a little modifica-
tion. In brief, cervical cords in female Balb/c mice with 6
to 8 weeks old (Sun Yat-sen University, Guangzhou,
China) were mechanically dislocated to sacrifice t hem.
After removing all muscle tissues from the femurs and
tibias, intact bones were left in 70% ethanol for 2 to 5 min
for disinfection and washed with phosphate-buffered sal-
ine (PBS). Then, both ends were cut with scissors and the
marrow was washed with PBS through a syringe. Clusters
within the marrow suspension were disintegrated by vigor-
ous pipetting. The bone marrow cell suspension was cen-
trifuged at 300 × g for 5 min. The cells were collected,
suspended in PBS by addition of red blood cell lysate for
depletion of erythrocytes, and incubated at 37.0°C for 8
min away from light. Then, they were washed with PBS at
300 × g for 5 min three times. At last, the cells were har-
vested and resuspended in RPMI1640 (Gibco BRL,
Gaithersburg, MD, USA) complete culture med ium con-
taining 10% (v/v) fetal bovine serum (FBS) (Gibco BRL), 2
mmol/L L-glutamine, 10 μmol/L 2-mercaptoethanol
(Sigma-Aldrich, St Louis, MO, USA), 100 U/mL penicillin
and 100 μg/mL streptomycin, and adjusted to 2 × 10
9
/L.
Induction and separation of bone marrow-derived
dendritic cells
The above cells were seeded into a 6-well plate to the end
volume of 2 mL per well, and 10.0 μg/L of rmGM-CSF
(PeproTech, Rocky Hill, NJ, USA) plus 10.0 μg/L of rmIL-
4 (PeproTech) was added to the corresponding wells in
the plate and cultured at 37.0°C in an incubator containing
5% CO
2
to induce differentiation of bone marrow cells
into bone marrow-derived dendritic cells. Then, the cells
were fed once at the interval of 1 day with the identical
dose of rmGM-CSF plus rmIL-4 for 6 days. At the end of
the cell induction, all the cells expressing CD11c in the
different wells were isolated respectively using the Mouse
CD11c Positive Selection Kit (EasySep
®
Magnet, StemCell
Technologies, Vancouver, Canada) according to the man-
ufacturer’s instruction and seeded into new wells with
fresh medium. Finally, the CD11c-positive cells were trea-
ted with or without LPS (Si gma-Aldrich) at a dose of 1.0
mg/L for another 24 h in order to obtain mature BMDCs.
Scanning electron microscopy
After the stimulation of LPS, the CD11c-positive cells
were rinsed with PBS containing 0.5 mM MgCl2 and 1
mM CaCl2, made naturally subside to the glutin-coated
glass for 10 min, then fixed at 4°C for 30 min with 2.5%
glutaraldehyde in 0.1 M phosphate buffer, pH 7.4, and
post-fixed for 30 min with 1% o smium tetroxide in 0.1
M phosphate buffer, pH 7.4. The glass was g radually
dehydrated in ethanol (30%, 50%, 70%, 90%, and twice
in 100% for 5 min at each step) and subjected to critical
point drying using carbon dioxide as transitional med-
ium. The samples were stored in a vacuum exsiccator to
prevent putative deterioration by air humidity. Then,
they were connected to stub holders with liquid silver
paint to improve electrical conductivity and imaged in
SEM (ESEM-30, Philips, Mahwah, NJ, USA) with a field
emission electron gun operating at standard high-
vacuum settings.
Flow cytometry
The CD11c-positive cells were harvested after the selec-
tion of immu nomagnetic beads and the stimulation of
LPS as described above. After being centrifuged, they
were washed with PBS at 300 × g for 5 min and resus-
pended in PBS. Then, the cells were stained with both
0.25 μganti-CD11c-FITCand1.0μg anti-MHC-II-PE
(eBioscience, USA) per million cells in a 100μltotal
volume. After being mixed gently on a vortex machine,
they were placed at 4.0°C in the dark for 30 min, a nd
then rinsed with PBS for two times and centrifuged at
300 × g for 5 min. The e xpression level of CD11c on
the surface of the cells was analyzed by flow cytometry
(FAC-Scalibur, Becton Dickinson, Franklin Lakes, NJ,
USA). A total of 5 × 10
3
events were analyzed for eac h
determination and ca lculated by CellQuest software
(Becton Dickinson).
ELISA
The above selected BMDCs were treated with or with-
out LPS at a concentration of 1.0 mg/L for 24 h. Their
culture supernatant was collected. The level of IL-12 in
the supernatant was determined via enzyme linked
immunosorbent assay (ELISA) with the IL-12 ELISA Kit
(Bender MedSystems, Burlingame, CA, USA) according
to the manufacturer’ s protocol. Absorbance value was
measured at 450 nm in 680 type microplate reader (Bio-
Rad, Berkeley, CA, USA). The concentration of IL-12
was quantified according to a standard curve.
AFM analysis
AFM observation was performed according to the
reported method [11,12]. In brief, the mica carrying the
BMDCs was fixed for 15 min in 2% glutaraldehyde phos-
phate buffer at pH 7.4, washed gently with distilled water
three times, and dried naturally. Then, contact mode
scanning was immediately performed using a commercial
AFM (AutoProbe CP Research, Thermomicroscopes,
Xing et al . Nanoscale Research Letters 2011, 6:455
/>Page 2 of 9
Sunnyvale, CA, USA) in air at room temperature. The
curvature radius of the silicon nitride tip (UL20B, Park
Scientific Instruments) was around 10 nm, and a force
constant about 2.8 N/m was used. To obtain high resolu-
tion, we scann ed samples at rate of 0.3 Hz. All of the
AFM images were flattened with provided software
(Thermomicroscopes Proscan Image Processing Software
Version 2.1) to complete quantitative analysis.
An autoprobe CP AFM was used in a contact mode in
air to perform the topography images at room tempera-
ture according to the publications [11-14]. AFM-based
force spectroscopy was used to perform the force dete c-
tion. The same silicon nitride tip was applied for mea-
surement of all the force-distance curves at the same
speed. Force-distance curves were obtained through
standard retraction between the tip and cell surface.
Two hundred fifty-six force-distance curves were
recorded for every cell (n = 10 cells for each group). All
force-distance curve experiments were performed at the
same loading rate.
The root-mean-square (rms) roughness and average
roughness of the cell surface imaged in air were calcu-
lated using the AFM. The rms roughness (R
rms
or R
q
)
and average roughness (R
a
) were defined by formulas
below:
R
rms
=
N
n=1
(
z
n
− z
)
2
N − 1
R
a
=
1
N
N
n=1
Z
n
− Z
where N is a total quantity of measured spots, Z
n
means a height of any spot, and
Z
represents an aver-
age height of all the spots. The calculated R
rms
and R
a
refer only to the area shown in the top central part of
the cells.
Statistical analysis
Numerical data obtained from each experiment were
expressed as mean ± SD, analyzed by SPSS 10.0 statisti-
cal package. The Student’s t test was followed for data
comparison and a P value of less than 0.05 was consid-
ered statistically significant.
Results and discussion
Morphologic and functional characteristics of BMDCs
The bone marrow cells were cultured and induced in
complete RPMI 1640 medium supplemented with a
given dose of GM-CSF plus IL-4 for 6 days. Six days
post induction of rmGM-CSF plus rmIL-4, the BMDCs
appeared predominately round in loosely adhesive
growth under a light microscope (Figure 1A,B) and
SEM (Figure 1E,F). When observed at a high resolution,
the BMDCs were ridgy in shape with a relative smooth
membrane surface (F igure 1F), demonstrating that they
are mostly in immature status. But the BMDCs with
treatment of LPS (LPS-treated BMDCs) changed greatly
under a light microscope (Figure 1C ,D) and SEM (Fig-
ure 1G,H). After treatment of LPS, some of BMDC
became significantly l arger in size with rough surface,
richer ruffles on the cell membrane, and bigger, longer
protrusions or pseudopodia (Figure 1G,H), compared
with the control (Figure 1E,F). The formation of rough-
ness, protrusion, and ruffles on the cell membrane are
considered to be associated with maturation of BMDCs.
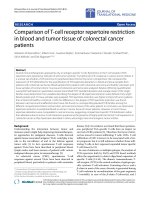
Figure 1 Morphologic changes of immature and mature
BMDCs. (A, B) The morphology of the BMDCs treated with GM-CSF
plus IL-4 was observed under a light microscope (magnification:
×100 (A) and ×400 (B)). (C, D) The morphology of the BMDCs
stimulated with LPS was also done under a light microscope
(magnification: × 100 (C) and × 400 (D)). (E, F) The images of the
BMDCs treated with GM-CSF plus IL-4 were scanned by a scanning
electron microscope (SEM) with different magnifications, including
around ×1,200 (E) and ×5,000 (F); (G, H) SEM images of the BMDCs
stimulated with LPS were recorded with different magnifications, i.e.,
around ×1,200 (G) and ×5,000 (H).
Xing et al . Nanoscale Research Letters 2011, 6:455
/>Page 3 of 9
These results suggest that there exist obviously morpho-
logic characteristics of mature BMDCs, consistent with
previously reported data [15]. Generally speaking, it is
considered that the morphologic change is the founda-
tion of the phenotype and the function of BMDCs.
MHC-II is one of activati on molecules expressed on the
surface of BMDCs, representing a phenotype of mature
BMDCs. Flow cytometry analysis showed that the per-
centage of CD11c
+
MHC-II
+
cells in LPS-treated BMDCs
was twofold more than that in BMDCs (Figure 2A,D),
indicating that some of the LPS-stimulated BMDCs
become mature. This is supported by our finding that
the percentages of CD11c
+
CD86
+
cells, CD11c
+
CD80
+
cells, and CD11c
+
CD40
+
cells in LPS-treated BMDCs
were 1.5-, 1.6-, and 2.5-fold more than those in BMDCs,
respectively [16]. IL-12 release is a functional character-
istic of DC maturation and also crucial for mature DCs
to mediate Th1 differentiation so as to enhance immune
responses. Mature DCs can direct differentiation of
naïve CD4
+
T cells into Th1 cells through IL-12 and
interaction between DCs and the latter [17-19]. There-
fore, we further examined whether BMDCs treated with
LPS were of a functi onal feature of DC maturation. The
amount of IL-12 in cul ture supernatants of BMDC s was
assessed by ELISA. Compared with the control, LPS
promoted significantly secretion of IL-12 by BMDCs
(Figure 2E). In terms of previous reports, nuclear factor
(NF)-kappaB plays a major role in regulation of DC
maturation, and LPS-mediated activation of NF-kappaB
in DCs leads to the production of IL-12 [20,21]. These
results suggest that BMDCs acquire maturation after
treatment of LPS, consistent with up -regulation of a co-
stimulating molecule, MHC-II, on the surface of DCs.
The forgoing finding s from mor phology, phenotype, and
function of B MDCs indicate that there are distinct dif-
ferences between both the immature and mature
BMDCs. The confirmed immature and mature BMDCs
have been successfully induced, isolated, and identified,
being suitable further for a comparative study by AFM.
Nano-structural comparison of immature and mature
BMDCs
Compared with both optica l microscopy and SEM, AFM
has some unique advantages, such as clearer images,
easy sample preparation, extensive environments (in air
or liquid allowing cells to “stay alive” )ofsampleto
escape from the damage of reagents, strong electrical
field, and ultrahigh vacuum in electron microsc opy, and
so on [22,23]. Therefore, a comparative study of imma-
ture and immature BMDCs was carried out by AFM to
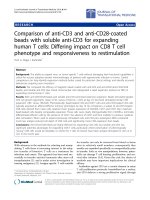
Figure 2 MHC-II expre ssion and IL-12 production of immature and mature BMDCs. (A-D) Flow cytometry was used to detect CD11c and
MHC-II molecule expression on the surface of the immature BMDCs treated with 10.0 μg/L of rmGM-CSF plus 10.0 μg/L of rmIL-4 as the control
(A, C) or the mature BMDCs stimulated with 1.0 mg/L of LPS (B, D), which was displayed respectively by the scattered plots (A, B) and the single
parameter diagrams (C, D). (E) The level of IL-12 secreted by the immature BMDCs or the mature BMDCs was measured by ELISA. *P < 0.05,
compared with the control.
Xing et al . Nanoscale Research Letters 2011, 6:455
/>Page 4 of 9
visualize and quantify nanostructures of them. AFM
images included single and multiple BMDCs, two and
three dimensions, low and high resolutions, cell height
profile and histogram, topography, and roughness on the
surface of the cells (Figure 3). The immature BMDCs
treated with rmGM-CSF plus rmIL-4 were shown on Fig-
ure3A-3G,andthematureBMDCsstimulatedbyaddi-
tion of LPS on Figure 3H-3N, which provided the
quantitative topographic information and the error signal
images for revealing fine surface details. The immature
BMDCs appeared mainly round, and around 18 × 18 μm
in scanning area (Figure 3B,D) with uniformly smooth
cell surface and approximately 2.5 μminheightonthe
center (Figure 3C). However, the mature BMDCs dis-
played an irregular shape with numerou s pseudopodia or
lamellapodia, and ridgy and ruffles on the surface of the
cell membrane in addition to becoming larger and longer.
Some of them were around 30 × 30 μminscanningarea
(Figure 3I,K) and approximately 5.0 μminheightonthe
center (Figure 3J); 5 × 5 μm of the area was scanned
respectively on the edge and top surface of the cells (Fig-
ure 3E,F,L,M). Quantitative analysis showed that the
granule size on the surface of the mature BM DCs (Figure
3M,N) was much higher than that of the immature
BMDCs (Figure 3F,G). At the edge of the mature
BMDCs, there were some longer and more pseudopods
(Figure 3K,L), but shorter and less ones in the immature
BMDCs could be found (Figure 3D,E). The roughness on
thesurfaceofthematureBMDCs(Figure3M,N)was
much higher than that of the immature B MDCs as well
(Figure 3F,G and Figure 4). There exist, to date, no
detailed reports involving nanostructure comparison of
both imm atur e and mature BMDCs. Thus, the foregoing
results would be helpful for profoundly understanding
the morphologic properties and functional foundation of
both immature and mature BMDCs. Obviously, AFM-
revea led features could not be r eplaced by SEM. The dif-
ference between the spatial resolutions may be due to dif-
ferent principles exploited by both SEM and AFM. AFM
scans cell surface with a tip probe, whereas SEM uses an
electron beam to obtain the image of cell surface [7].
Besides, easy sample preparation without conductive
coating could protect AFM image from damage of the
sample [22,24]. In addition to providing topographical
images of cell surfaces with nanometer- to angstrom-
scale resolution, forces between single molecule and
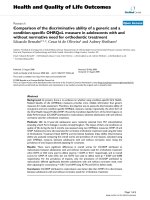
Figure 3 Nanostructure on the surface of immature and mature BMDCs. (A-N) AFM was adopted to determine nanostructures of th e
immature BMDCs treated with 10.0 μg/L of GM-CSF plus 10.0 μg/L of IL-4 (A-G) or the mature BMDCs stimulated with 1.0 mg/L of LPS (H-N),
and to make quantitatively analysis for them; A and H, multiple immature BMDCs (A) or mature BMDCs (H) at lower resolution; B and I, three-
dimensional images respectively from the black line-circled cells on A and H images; C and J, height profiles alone the black lines (b1 and i1)
drawn across the cells on B and I images, respectively; D and K, single immature BMDC in scanning area of 18 × 18 μm (D) or single mature
BMDC in scanning area of 30 × 30 μm (K) respectively from the black line-circled cells on A and H images; E and L, Enlarged view of the
protrusion or pseudopodia on the edge of the immature BMDCs (E) in the scanning size of 3 × 3 μm and the mature BMDCs (L) in the
scanning size of 3 × 3 μm; F and M, Enlarged view of the center of the immature BMDCs (F) and the mature BMDCs (M) in the same scanning
area of 5 × 5 μm; G and N, histograms of the particles of the immature BMDCs (G) and the mature BMDCs (N).
Xing et al . Nanoscale Research Letters 2011, 6:455
/>Page 5 of 9
mechanical property of cells can be investigated by AFM.
This quality can distinguish AFM from conventional ima-
ging techniques of comparable resolution, s uch as elec-
tron microscopy, too.
Regarding the enhancement of the mature DC height
and volume, it is associated with the differentiation and
maturation of DCs induced by LPS. It is well known that
LPS can activate Toll-like receptor 4 on the surface of
immature DCs. The activation of a Toll-like receptor 4
signaling pathway finally causes nuclear translocation of
the nuclear factor (NF)-kappaB transcription factor. The
inhibition of NF-kappaB activation blocks maturation of
DCs, followed by down-regulation of maj or histocompat-
ibility complex and co-stimulatory molecules, which indi-
cates that the activated NF-kappaB signaling pathway
may be responsible for DC maturation. Simultaneously, it
is found that LPS activates the extracellular signal-regu-
lated kinase1/2 (ERK1/2) in DCs. The specific inhibition
of MEK1, an upstream kinase of ERK1/2, abrogates the
ability of LPS to prevent apoptosis but does not impact
the DC maturation, which suggests that ERK1/2 signaling
pathway may mainly maintain DC survival [25]. Ardesh-
na’s research group showed that LPS activated the p38
mitogen-activated protein kinase (p38 MAPK), ERK1/2,
phosphoinositide 3-OH kinase (PI3 kinase)/Akt, and NF-
kappaB pathways in the process of D C maturation. PI3
kinase/Akt signaling pathways are important in maintain-
ing survival of L PS-stimulated DCs. Inhibiting p38
MAPK prevented activation of the transcription factor
ATF-2 and CREB, and significantly reduced the LPS-
induced up-regulation of co-stimulatory molecules [26].
It is also demonstrated by another research group’s
results that ERK1/2, p38MAPK, c-jun N-terminal kinase
(JNK), and NF-kappaB signaling pathways are implicated
in the events of D Cs maturation [27]. The differentiation
and maturation of DCs require more synthetic materials
and energy production, with enhancement of the whole
cellular or subcellular metabolism and function. Morpho-
logical changes of cells are foundation of their metabo-
lism and function changes, adapting to the need of the
both latters. The big increase of subcellular organelles in
LPS-stimulated mature DCs, especially including lyso-
some, mitochondrium, and endoplasmic reticulum with
enrichment of cytoplasm, can be observed under a trans-
mitted electronic microscope, finally resulting in the aug-
mentation of the DC height and volum e. The inc rease of
mature DC surface area may be helpful for the expression
of co-stimulatory molecules and relevant receptors on
the surface of mature DCs, promoting intercellular inter-
action of mature DCs and other associated cells. Of
course, these morphological changes of ma ture DCs may
be regulated by the foregoing different and s ometimes
overlapping pathways.
Adhesive force comparison of immature and mature
BMDCs
Operational principle of AFM was schematically shown
in Figure 5A. Schematic representation of a typical
Figure 4 Quantitative analysis of the surface roughness and the height of immature and mature BMDCs .(A,B)AFMwasexploitedto
show topographic images of the surface nanostructure of the immature BMDCs treated with 10.0 μg/L of GM-CSF plus 10.0 μg/L of IL-4 (A) as
the control or the mature BMDCs stimulated with 1.0 mg/L of LPS (B) in the same scanning area of 5 × 5 μm; (C) The root-mean-square
roughness (R
rms
or R
q
) and average roughness (R
a
) on the surface of the immature BMDCs (A) and the mature BMDCs (B) were quantitatively
analyzed via the formulas as described in the section of “Materials and methods.” (D) The average heights of immature and mature BMDCs were
statistically quantified, respectively. n = 10; *P < 0.05, compared with the control.
Xing et al . Nanoscale Research Letters 2011, 6:455
/>Page 6 of 9
force-distance cycle was used to display the full process
of measuring cell adhesion force. The tip was moved
toward the cell surface (1) and (2), and then retracted at
a c onstant lateral position (3). During tip approach, the
tip with the sample leaded to a force signal with a dis-
tinct shape (4) du ring tip retraction. The force increased
until bond rupture occurred (5) at an unbinding force
[28-30]. Two force-distance curves recorded between
the silicon nitride probe and the surface of the BMDCs
were shown in Figure 5. Force-distance curve measure-
ment demonstrated that the changes in the immature or
mature BDMC surface nanostructur e went along with
profound modification of the nanomechanical property.
Upon approach, no significant deviation from linearity
was seen in the contact region of the immature BDMCs,
indicating that the sample was not deformed by the
probe. Upon retraction, the adhesion force was detected,
reflecting the absence of molecular interaction between
both probe and surface. I n contrast w ith the immature
BDMCs, the mature BDMCs revealed a curvature upon
approach, reflecting sample softness and/or repulsive
surface forces. This might be due to electrostatic inter-
action. Furthermore, silicon nitride surface was shown
to be close to electrical neutrality over a wide pH range
(pH 6 to 8.5). The heterogeneous surface of BDMCs
after addition of GM-CSF or LPS was directly correlated
with differences in adhesion force revealed by retraction
curves. The weak adhesion force was measured between
the probe and the immature BDMC surface, being
around 50 to 80 pN (Figure 5B a), while g reat adhesion
Figure 5 Adhesive force of im mature and mature BMDCs. (A) As shown in Fig ure 5A (slightly modified from Shahin et al.[29,30]), the AFM
tip is moved toward the cell surface (1) and then retracted at a constant lateral position (2) and (3). During the AFM tip retraction, the AFM tip
with the sample leads to a force signal with a distinct shape (4). The force increases until bond rupture occurs (5) at an unbinding force; (B a
and b) The typical force-distance curves were recorded with using an non-functionalized AFM tip to measure the adhesive force of the
immature BMDCs treated with 10.0 μg/L of GM-CSF plus 10.0 μg/L of IL-4 (B a) or the mature BMDCs stimulated with 1.0 mg/L of LPS (B b). The
measured adhesion force (352.37 ± 11.71 pN) on the membrane surface of the mature BMDCs was much bigger than that (70.37 ± 4.55 pN) of
the immature BMDCs (n = 10; P < 0.01).
Xing et al . Nanoscale Research Letters 2011, 6:455
/>Page 7 of 9
force was determined on the mature BDMCs, being
fourfold bigger than the former (n = 10 cells for each
group) (Figure 5B b). All of the 256 force-distance
curves recorded showed the same f eature, indicating
that the sample surface was homogeneous as regards
the nanomechanical property. It has been proved that
polysaccharides play a key role in cellular adhesion [31].
Thus, the increased adhesion force on the surface of the
mature BDMCs might be a ttributed to the pr esence of
polysaccharide aggregation and mechanically beneficial
to deformation, move ment, migration, adh esion, and
interaction of the mature BMDCs, which may adapt to
functional changes of them. In add ition, it should be
pointed out that adhesive force-distance curve measure-
ment was proces sed only using fixed BMDCs due to the
limitation of the used instrument. Therefore, it is rea-
sonably speculated that the measured adhesive force
might be smaller than that under the physiological state
of living BMDCs. Obviously, BMDCs growing in culture
medium merit to be directly observed to explore it
using a more advanced AFM. Moreover, antigen-anti-
body interaction force on the surface of mature BMDCs
remains investigated further by using chemically modi-
fied probes. This would provide a new insight into
molecular mechanisms of bio-interfacial phenomena,
including aggregation, adhesion, molecular recognition,
and intercellular communication of the mature BMDCs.
It should be pointed out that the AFM tip is going to
be contaminated at the first touch and continue with
the following touches, and this contamination can influ-
ence the next interaction of the tip with the cells.
Therefore, contamination control of AFM tips is very
important for reliable AFM ima ging and surface/inter-
face force measurements. Most contaminants may result
in poor imaging quality either by causing tip effects
and/or noise [32]. Tip effects reflect the increase in tip
size as the contaminants add to the tip apex [33]. A
noisy AFM image can be a result of uncontrollable
interaction (such as sudden bridging or breaking)
between the tip and the sample surface mediated by
interspersed sticky contaminants. Nie et al. considered
that such a contaminant confined on the tip apex dis-
plays an uncontrollable variation in the oscillation
amplitude of the cantilever, causing noise in the AFM
images the contaminated tip collects, but such a con-
taminant may be removed from the apex by pushing the
tip into a material soft enough to avoid damage to the
tip [34]. According to our experience, cell samples
should be gently washed with the buffer at least three
times for removing debris attachment from cell culture
media and themselves before AFM determination. We
think that a contact mode for the determination may be
replaced by a tapping mode in order to reduce the con-
tamination and cell damage if serious contamination
occurs. Actually, traditional cleaning methods for the
tip, including plasma, UV-ozone, solvent treatments,
and so on, have been abroad applied, but there still are
some shortcomings. Recently , Gan et al. reported that
calibration gratings with supersharp spikes could be
employed to scrub away contaminants accumulated on a
colloidal sphere probe by scanning the probe against the
spikes at high load at constant-force mode. This method
may be superior to traditio nal cleaning methods in sev-
eral aspects [35]. Anyway, control of AFM tip contami-
nation is an extremely common issue and remains to be
further studied.
Taken together, the above results first reveal the char-
acterization of the surface nanostructure and adhesion
force of the immature and mature BMDCs, providing
profoundly understanding structure/function relation-
ship of BMDCs.
Acknowledgements
This project was supported by the National Natural Science Foundation of
China (no. 30471635, no. 30971465), the Natural Science Foundation of
Guangdong Province in China (04010451, 5006033), the Fundamental
Research Funds for the Central University (21610608), and the “211” project
grant.
Author details
1
Institute of Tissue Transplantation and Immunology, Jinan University,
Guangzhou 510632, China
2
Department of Chemistry, Jinan University,
Guangzhou 510632, China
3
Department of Immunology, H. Lee Moffitt
Cancer Center and Research Institute, Tampa, FL 33612, USA
4
Department of
Blood and Marrow Transplantation, H. Lee Moffitt Cancer Center and
Research Institute, Tampa, FL 33612, USA
5
Department of Stomatology, Jinan
University, Guangzhou 510632, China
Authors’ contributions
JW carried out the experiment, statistical analysis and participated in the
draft of the manuscript. MH carried out AFM analysis. YY offered the
technique supports. GC participated in the cell culture. JL conceived of the
study, participated in the designs and was responsible for the experimental
coordination. FX designed and participated in the experiment, drafted the
manuscript, and was responsible for its coordination. All authors read and
approved the final manuscript.
Competing interests
The authors declare that they have no competing interests.
Received: 6 March 2011 Accepted: 16 July 2011 Published: 16 July 2011
References
1. Lutz MB, Schnare M, Menges M, Rössner S, Röllinghoff M, Schuler G,
Gessner A: Differential functions of IL-4 receptor types I and II for
dendritic cell maturation and IL-12 production and their dependency on
GM-CSF. J Immunol 2002, 169:3574-3580.
2. Lutz MB, Suri RM, Niimi M, Ogilvie AL, Kukutsch NA, Rössner S, Schuler G,
Austyn JM: Immature dendritic cells generated with low doses of GM-
CSF in the absence of IL-4 are maturation resistant and prolong allograft
survival in vivo. Eur J Immunol 2000, 30:1813-1822.
3. Lynch DH: Induction of dendritic cells (DC) by Flt3 Ligand (FL) promotes
the generation of tumor-specific immune responses in vivo. Crit Rev
Immunol 1998, 18:99-107.
4. Lutz MB: IL-3 in dendritic cell development and function: a comparison
with GM-CSF and IL-4. Immunobiology 2004, 209:79-87.
5. Banchereau J, Steinman RM: Dendritic cells and the control of immunity.
Nature 1998, 392:245-252.
Xing et al . Nanoscale Research Letters 2011, 6:455
/>Page 8 of 9
6. Wang J, Xing F: Human TSLP-educated DCs. Cell Mol Immunol 2008,
5:99-106.
7. Poletti G, Orsini F, Lenardi C, Barborini E: A comparative study between
AFM and SEM imaging on human scalp hair. J Microsc 2003, 211:249-255.
8. Arakawa H, Umemura K, Ikai A: Protein images obtained by STM, AFM
and TEM. Nature 1992, 358:171-3.
9. Szakal AK, Gieringer RL, Kosco MH, Tew JG: Isolated follicular dendritic
cells: cytochemical antigen localization, Nomarski, SEM, and TEM
morphology. J Immunol 1985, 134:1349-1359.
10. Lutz MB, Kukutsch N, Ogilvie AL, Rössner S, Koch F, Romani N, Schuler G:
An advanced culture method for generating large quantities of highly
pure dendritic cells from mouse bone marrow. J Immunol Methods 1999,
223:77-92.
11. Hu M, Wang J, Cai J, Wu Y, Wang X: Nanostructure and force
spectroscopy analysis of human peripheral blood CD4+ T cells using
atomic force microscopy. Biochem Biophys Res Commun 2008, 374:90-94.
12. Wu Y, Hu Y, Cai J, Ma S, Wang X, Chen Y, Pan Y: Time-dependent surface
adhesive force and morphology of RBC measured by AFM. Micron 2009,
40:359-364.
13. Hu M, Chen J, Wang J, Wang X, Ma S, Cai J, Chen CY, Chen ZW: AFM- and
NSOM-based force spectroscopy and distribution analysis of CD69
molecules on human CD4+ T cell membrane. J Mol Recognit 2009,
22:516-520.
14. Hu M, Wang J, Zhao H, Dong S, Cai J: Nanostructure and nanomechanics
analysis of lymphocyte using AFM: from resting, activated to apoptosis.
J Biomech 2009, 42:1513-1519.
15. Quaranta MG, Mattioli B, Spadaro F, Straface E, Giordani L, Ramoni C,
Malorni W, Viora M: HIV-1 Nef triggers Vav-mediated signaling pathway
leading to functional and morphological differentiation of dendritic
cells. FASEB J 2003, 17:2025-2036.
16. Xing FY, Liu J, Yu Z, Ji YH: Soluble Jagged 1/Fc chimera protein induces
the differentiation and aturation of bone marrow-derived dendritic cells.
Chinese Sci Bul 2008, 53:1040-1048.
17. Florian C, Barth T, Wege AK, Mannel DN, Ritter U: An advanced approach
for the characterization of dendritic cell-induced T cell proliferation in
situ. Immunobiology 2010, 215:855-862.
18. Hugues S: Dynamics of dendritic cell-T cell interactions: a role in T cell
outcome. Semin Immunopathol 2010, 32:227-238.
19. Nakano K, Higashi T, Takagi R, Hashimoto K, Tanaka Y, Matsushita S:
Dopamine released by dendritic cells polarizes Th2 differentiation. Int
Immunol 2009, 21:645-654.
20. Ouaaz F, Arron J, Zheng Y, Choi Y, Beg AA: Dendritic cell development
and survival require distinct NF-kappaB subunits. Immunity
2002,
16:257-270.
21. Scott P, Hunter CA: Dendritic cells and immunity to leishmaniasis and
toxoplasmosis. Curr Opin Immunol 2002, 14:466-470.
22. Goldsbury CS, Scheuring S, Kreplak L: Introduction to atomic force
microscopy (AFM) in biology. Curr Protoc Protein Sci 2009, Chapter 17,
Unit 17.7.1-9.
23. Verdoodt B, Blazek T, Rauch P, Schuler G, Steinkasserer A, Lutz MB, Funk JO:
The cyclin-dependent kinase inhibitors p27Kip1 and p21Cip1 are not
essential in T cell anergy. Eur J Immunol 2003, 33:3154-3163.
24. Tyagi AK, Malik A: In situ SEM, TEM and AFM studies of the antimicrobial
activity of lemon grass oil in liquid and vapour phase against Candida
albicans. Micron 2010, 41:797-805.
25. Rescigno M, Martino M, Sutherland CL, Gold MR, Ricciardi-Castagnoli P:
Dendritic cell survival and maturation are regulated by different
signaling pathways. J Exp Med 1998, 188:2175-2180.
26. Ardeshna KM, Pizzey AR, Devereux S, Khwaja A: The PI3 kinase, p38 SAP
kinase, and NF-kappaB signal transduction pathways are involved in the
survival and maturation of lipopolysaccharide-stimulated human
monocyte-derived dendritic cells. Blood 2000, 96:1039-1046.
27. Antonios D, Ade N, Kerdine-Romer S, Assaf-Vandecasteele H, Larangé A,
Azouri H, Pallardy M: Metallic haptens induce differential phenotype of
human dendritic cells through activation of mitogen-activated protein
kinase and NF-kappaB pathways. Toxicol In Vitro 2009, 23:227-234.
28. Dupres V, Verbelen C, Dufrene YF: Probing molecular recognition sites on
biosurfaces using AFM. Biomaterials 2007, 28:2393-2402.
29. Shahin V, Hafezi W, Oberleithner H, Ludwig Y, Windoffer B, Schillers H,
Kühn JE: The genome of HSV-1 translocates through the nuclear pore as
a condensed rod-like structure. J Cell Sci 2006, 119:23-30.
30. Shahin V, Ludwig Y, Schafer C, Nikova D, Oberleithner H: Glucocorticoids
remodel nuclear envelope structure and permeability. J Cell Sci 2005,
118:2881-2889.
31. Pelling AE, Li Y, Shi W, Gimzewski JK: Nanoscale visualization and
characterization of Myxococcus xanthus cells with atomic force
microscopy. Proc Natl Acad Sci USA 2005, 102:6484-6489.
32. Dongmo LS, Villarrubia JS, Jones SN, Renegar TB, Postek MT, Song JF:
Experimental test of blind tip reconstruction for scanning probe
microscopy. Ultramicroscopy 2000, 85:141-153.
33. Nie HY, Walzak MJ, McIntyre NS: Use of biaxially oriented polypropylene
film for evaluating and cleaning contaminated atomic force microscopy
probe tips: an application to blind tip reconstruction. Rev Sic Instrum
2002, 73
:3831-3836.
34. Nie HY, McIntyre NS: Unstable amplitude and noisy image induced by tip
contamination in dynamic force mode atomic force microscopy. Rev Sci
Instrum 2007, 78:023701-023706.
35. Gan Y, Franks GV: Cleaning AFM colloidal probes by mechanically
scrubbing with supersharp “brushes”. Ultramicroscopy 2009,
109:1061-1065.
doi:10.1186/1556-276X-6-455
Cite this article as: Xing et al.: Comparison of immature and mature
bone marrow-derived dendritic cells by atomic force microscopy.
Nanoscale Research Letters 2011 6:455.
Submit your manuscript to a
journal and benefi t from:
7 Convenient online submission
7 Rigorous peer review
7 Immediate publication on acceptance
7 Open access: articles freely available online
7 High visibility within the fi eld
7 Retaining the copyright to your article
Submit your next manuscript at 7 springeropen.com
Xing et al . Nanoscale Research Letters 2011, 6:455
/>Page 9 of 9