Management of Organic Waste Part 6 potx
Bạn đang xem bản rút gọn của tài liệu. Xem và tải ngay bản đầy đủ của tài liệu tại đây (296.58 KB, 15 trang )
The Sanitation of Animal Waste Using Anaerobic Stabilization
67
Juriš, P., Rataj, D., Ondrašovič, M., Sokol, J., Novák, P. (2000). Sanitary and ecological
requirements on recycling of organic wastes in agriculture. Vyd. Michala Vaška,
Prešov, 1-178 (in Slovak).
Krupicer, I., Valocká, B., Vasilková, Z., Sabová, M., Papajová, I., Dubinský, P. (2000).
Contamination and survival of helminth eggs in pig slurry and influence of the
lagoon effluent on soil and plant parasitic nematodes. In: Dubinský, P., Juriš, P.,
Moncol, D. J. (Eds.): Environmental protection against the spread of pathogenic
agents of diseases through the wastes of animal production in the Slovak Republic.
Harlequine, Ltd., Košice, p. 79-93.
Lauková, A., Juriš, P., Vasilková, Z., Papajová, I. (2000). Treatment of sanitary-important
bacteria by bacteriocin substance V24 in cattle dung water. Letters in Applied
Microbiology, 30, p. 402-405.
Matsuo, J., Nakashio, S. (2005). Prevalence of fecal contamination in sandpits in public parks
in Sapporo City, Japan. In Veterinary Parasitology, Vol. 128, p. 115-119.
Miterpáková, M., Dubinský, P. Reiterová, K., Stanko, M. (2006) Climate and environmental
factors influencing Echinococcus multilocularis occurrence in the Slovak Republic. In
Annals of Agricultural and Environmental Medicine. Vol. 13, no. 1, p. 235-242.
Mulvaney, R. L. (1996). Nitrogen - inorganic forms. In D. L. Sparks (Ed.), Methods of Soil
Analysis (pp. 1123-1184). Madison, WI: SSSA Inc
Navarro, A. F., Cegarra, J., Roig, A., Garcia, D. (1993). Relationships between organic matter
and carbon contents of organic wastes. Bioresource Technology, 44, 203-207.
Ondrašovič, M., Juriš, P., Papajová, I., Ondrašovičová, O., Ďurečko, R., Vargová, M. (2002):
Lethal effect of selected disinfectants on Ascaris suum eggs. Helminthologia, 39, pp.
205-209.
Papajová, I., Juriš, P. (2009). The effect of composting on the survival of parasitic germs. In:
Pereira, J. C., Bolin, J. L. (Eds.) Composting: Processing, Materials and Approaches.
New York : Nova Science Publishers, p. 124-171. ISBN 978-1-60741-438-4.
Pescon, B. M., Nelson, K. L. (2005). Inactivation of Ascaris suum eggs by ammonia. Environ.
Sci. Technol., 39, pp. 7909-7914.
Plachý, P., Juriš, P. (1995). Use of polyurethane carrier for assessing the survival of helminth
eggs in liquid biological sludges. Vet. Med. 40, 323-326.
Sasáková, N., Juriš, P., Papajová, I., Vargová, M., Ondrašovičová, O., Ondrašovič, M.,
Kašková, A., Szabová, E. (2005). Parasitological and bacteriological risks to animal
and human health arising from waste-water treatment plant. Helminthologia, 42, p.
137-142.
Schwartzbrod, J., Stien, J. L., Bouhoum, K., Baleux, B. (1989). Impact of wastewater treatment
on helminth eggs. Water Science and Technology, 21, 295-297. STATISTICA 6.0,
StatSoft Inc., USA.
STATISTICA 6.0, StatSoft Inc., USA.
Tofant, A., Vučemilo, M., Hadžiosmanović, M., Križanić, J. (1999). Liquid manure: A surface
water pollutant [Einfluß der düngung landwirtschaftlicher flächen mit
schweinegülle auf die wasserqualität in naheliegenden gewässern] Tierarztliche
Umschau 54, 148-150.
Management of Organic Waste
68
Valocká, B., Dubinský, P., Papajová, I., Sabová, M. (2000). Effect of anaerobically digested
pig slurry from lagoon on soil and plant nematode communities in experimental
conditions. Helminthologia, 37, p. 53-57.
4
The Waste Oil Resulting from
Crude Oil Microbial Biodegradation in Soil
Anatoly M. Zyakun, Vladimir V. Kochetkov
and Alexander M. Boronin
Skryabin Institute of Biochemistry and Physiology of Microorganisms RAS
Russia
1. Introduction
Environmental pollution by oil and oil products, which occurs at petroleum extraction
wells, as a result of spills from oil tankers, pipe line breaks, disposal of refinery waste, leaks
at gasoline stations, etc., have caused tremendous damage to ecological systems especially
to many plant species (Adam and Duncan 2002; 2003; Palmroth et al. 2005), and a wide array
of animals (Khan and Ryan 1991; Tevvors and Sair 2010). According to available data
(Wang et al. 2011), the total amount of all major spills in the world was about 37 billion
barrels of crude oil pollute soil and water ecosystems. It exceeds the total amount of crude
oil consumption for the entire world annually (30 billion barrels in 2006) (Mundi 2010).
Consequently, the problem of environmental pollution with anthropogenic hydrocarbons
and their influence on natural ecosystems calls for comprehensive investigation. Crude oil
consists of a number of rather complicated components, which are toxic and can exert side
effects on environmental systems. Oil pool contains aliphatic and polycyclic aromatic
hydrocarbons, for example, crude oil consists of alkanes 15 - 60 %, naphthenes 30-60 %,
aromatics 3-30% and asphaltenes 6 % by weight ( Speight 1990 ). The extent of oil spills can
have a legacy for decades, evens centuries in future (Wang et al. 2011). Toxic effects of oil
and oil products on the soil environment include increasing hydrophobicity of soils and
disruption of water availability to vegetation, and direct toxicity to plants and
microorganisms. At the sub-toxic level, negative effects may include the absorption of low-
molecular oil hydrocarbons into plant tissues, and the inhibition or activation of microbial
soil processes. The soil, although is an important sink for a wide range of substances,
pollutant load exceeding certain threshold has the potential of impacting negatively on the
capacity of the soil to perform its ecosystem functions with repercussions on sustainability
issues such as plant growth and some non-hydrocarbon utilizing microorganisms. For
instance, the aromatics in crude oil produce particular adverse effect to the local soil
microbiota. It was found that phenolic and quinonic naphthalene derivatives inhibited the
growth of some microbial cells (Sikkema et al. 1995). As follows from the work (Wongsa et
al. 2004), the rates of utilization of separate oil fractions may be significantly differed even in
case of one and the same strain of hydrocarbon-oxidizing microorganisms. As a result, the
influence of microorganisms on crude oil in soil may be accompanied by substantial changes
in the initial composition of hydrocarbons, while the rest of hydrocarbons in soil may have
absolutely different properties compared to the initial characteristics. The term ‘waste oil’
Management of Organic Waste
70
was used to designate the hydrocarbon tails of crude oil introduced into soil and
transformed into the product that lost the original properties (i.e., the quantitative ratio of
hydrocarbon components changed and the organic products of microbial biosynthesis
appeared, which differ from the initial oil components in metabolic availability for a wide
range of soil microorganisms, etc). It has been known that soil microbial communities are
able to adjust to unfavourable conditions and to use a broad spectrum of substrates (Jobson
et al. 1974; Nikitina et al. 2003). They have unique metabolic systems that allow them to
utilise both natural and anthropogenic substances as a source of energy and tissue
constituents. These unique characteristics make the microbiota useful tool in monitoring and
remediation processes. Bioremediation of soil contaminated with oil hydrocarbons has been
established as an efficient, economic, versatile, and environmentally sound treatment (van
Hamme et al. 2003). Several reports have already focused on the composition of natural
microbial populations contributing to biotransformation and biodegradation processes in
different environments polluted with hydrocarbons (Juck et al. 2000; Hamamura et al. 2008;
Marques et al. 2008). It is becoming increasingly evident that the fate of anthropogenic
hydrocarbons pollutants entering the soil system requires efficient monitoring and control.
The bioremediation potential of microbial communities in soil polluted with oil
hydrocarbons depends on their ability to adapt to new environmental conditions (Mishra et
al. 2001; Kaplan and Kitts 2004). Investigations into how bioremediation influences the
response of a soil microbial community, in terms of activity and diversity, are presented in a
series of publications (Jobson et al. 1974; Margesin and Schinner 2001; Zucchi et al. 2003;
Hamamura et al. 2006; Margesin et al. 2007). The methods of monitoring and
characterization of hydrocarbon degrading activity of soil microbiota are of special interest
(Margesin and Schinner 2005; Abbassi and Shquirat 2008; Pleshakova et al. 2008). Oil
hydrocarbon biodegradation and transformation in soils can be monitored by estimating the
concentration of pollutant (Tzing et al. 2003) and the formation of respective metabolites.
The most ubiquitous and universal metabolites is carbon dioxide (CO
2
), since respiration is
by far the prominent pathway of biologically processed carbon.
The activity of soil microbiota can be characterized by the method of the substrate-induced
respiration (SIR) which was used for the measurement of CO
2
production and the
estimation of soil microbial biomass. When an easily microbial degradable substrate, such as
glucose, is added to a soil, an immediate increase of the respiration rate is obtained, the size
of which is assumed to be proportional to size of the microbial biomass (Anderson and
Domsch 1978). In addition to SIR, the index of the specific microbial activity in soil is the
priming effect (PE) of introduced exogenous substrate, which was defined as ‘the extra
decomposition of native soil organic matter in a soil receiving an organic amendment”
(Bingeman et al. 1953). The PE may be represented by the following three indices: (a)
positive PE shows that exogenous substrate introduction concurrent with its mineralization
increases SOM mineralization to a rate exceeding the previous rate; (b) zero PE shows that
CO
2
is produced additionally only as a result of microbial mineralization of introduced
substrate without changing the existing rate of SOM mineralization; and (c) negative PE
values show that exogenous substrate introduction decreases SOM mineralization rate and
CO
2
production is determined mainly by mineralization of the substrate. PE determination
only by the difference of CO
2
production rate before and after substrate introduction into
soil suffers from the known uncertainly of CO
2
sources and does not allow distinguishing
between the so-called “real” and “apparent” PE. (Blagodatskaya et al. 2007; Blagodatskaya
The Waste Oil Resulting from Crude Oil Microbial Biodegradation in Soil
71
and Kuzyakov 2008). Obviously, unambiguous determination of PE by CO
2
production calls
for an exogenous substrate different from SOM in carbon isotopes (Zyakun et al. 2003; Dilly
and Zyakun 2008; Zyakun et al. 2011). It has been shown that addition to the soil of a
substrate easily accessible for microorganisms (e.g., glucose, amino acids, etc.) (Harabi and
Bartha1993; Shen and Bartha 1996; Zyakun and Dilly 2005; Blagodatskaya and Kuzyakov
2008), contributes to the increase of SOM mineralization rate 2-3-fold compared to the
processes in native soil. Acceleration of SOM degradation (positive PE) was also observed in
case of addition of an aliphatic hydrocarbon (n-hexadecane) to the soil. Introduction into soil
of n-hexadecanoic acid, the product of n-hexadecane oxidation, resulted in the lower rate of
SOM mineralization compared to native soil (negative PE) (Zyakun et al. 2011). In the light
of brief presentation of methods characterizing biodegradation and transformation of
exogenous organic products entering the soil, the fate of crude oil in soils may be defined by
the following parameters: (a) the rate of CO
2
production as result of mineralization of crude
oil and SOM; (b) activation of mineralization of native soil organic matter by introduced
substrate (priming effect); c) the ratio of the quantities of biomass of the microorganisms
growing on oil hydrocarbons as a substrate and quantities of SOM mineralized into CO
2
.
2. Methods used to analyze the CO
2
microbial production in soil
2.1 CO
2
sampling
Soil samples, 100 g dry weight, were placed into 700-ml glass vials, hermetically closed and
pre-incubated for 3 days at 22
0
С. Metabolic carbon dioxide (CO
2
) formed by microbial
mineralization of SOM and test-substrate (crude oil) was collected using glass plates (10 ml)
placed the over soil surface, containing 2-3 ml of 1M NaOH solution. Production of СО
2
in
the course of the experiment in each of the vials was determined by titration of the residual
alkali in the plates using an aqueous 0.1M HCl solution. The total amount of СО
2
fixed in
the NaOH solution was also determined by precipitation with BaCl
2
and quantitative
retrieval of BaCO
3
. Barium carbonate was washed with water, precipitated, dried, and the
resulting precipitate weighed and used for quantitative calculation of metabolic СО
2
production and carbon isotope analysis.
2.2 The kinetics of CO
2
respiration
Specific CO
2
evolution rates (µ) of soil microorganisms after crude oil addition to soil were
estimated from the kinetic analysis of substrate-induced respiration (CO
2
(t)) by fitting the
parameters of equation [1]:
CO
2
(t)=K+r·exp(µ·t) (1)
where K is the initial respiration rate uncoupled from ATP production, r is the initial rate of
respiration by the growing fraction of the soil microbiota which total respiration coupled
with ATP generation and cell growth, and t is time (Panikov and Sizova 1996; Stenström et
al. 1998; Blagodatsky et al. 2000). The lag period duration (t
lag
) was determined as the time
interval between substrate addition and the moment when the increasing rate of microbial
growth-related respiration r·exp(µ·t) became as high as the rate of respiration uncoupled
from ATP generation.
Management of Organic Waste
72
t
lag
=ln(K/r)/µ (2)
According to the theory of microbial growth kinetic (Panikov 1995; Blagodatskaya et al.
2009), the lag period was calculated by using the parameters of approximated curve of
respiration rate of microorganisms with [2].
2.3 Carbon isotopic analysis
The metabolic activity of soil microbial community with respect to substrate (crude oil
hydrocarbons) was determined from CO
2
evolution rates and the
13
C-CO
2
isotope signature.
The characteristics of abundance ratios of carbon isotopes
13
C/
12
C in SOM, crude oil, and
metabolic СО
2
(as BaCO
3
) were measured using by isotopic mass-spectrometry (Breath
MAT-Thermo Finnigan) connected with a gas chromatograph via ConFlow interface.
Isotope analysis of metabolic СО
2
was performed using about 3-4 mg of obtained BaCO
3
[M
= 197.34], which then was degraded to СО
2
by orthophosphoric acid in a 10-ml container.
For the analysis of carbon isotope contents of organic matter, SOM and crude oil samples
were combusted to СО
2
in ampoules at 560
0
С in the presence of copper oxide.
The ratios of peak intensities in СО
2
mass spectra with m/z 45 (
13
C
16
O
2
) and 44 (
12
C
16
O
2
)
were used for quantitative characterization of the content of
13
C and
12
C isotopes in the
analyzed samples. According to the accepted expression [3], the amount of
13
C isotope was
determined in relative units
13
C (‰):
13
C = (R
sa
/R
st
–1) 1000 ‰ (3)
where R
sa
=(
13
C)/(
12
C) represented the abundance ratios of isotopes
13
C /
12
C in a sample and
R
st
=(
13
C)/(
12
C) was the ratio of these isotopes in the International Standard PDB (Pee Dee
Belemnite) (Craig 1957). Each СО
2
sample was analyzed in three repeats; standard error
was about 0.1‰. The
13
C values are characteristics of stable isotope composition or the
13
C/
12
C abundance ratio in the analyzed compounds. Negative values indicate the
13
C
depletion; positive values indicate
13
C enrichment relative to PDB standard.
2.4 Mass isotope balance
Metabolic carbon dioxide produced in the experiments and controls was accumulated
during the appropriate time intervals (1-3 days) followed by determination of its quantity
and carbon isotope characteristics. The average weighed carbon isotope composition of
metabolic СО
2
(
13
C
ave
), which was obtained in detached time intervals, was determined
using the expression [4]:
13
C
ave
= (∑q
i
,·
13
C
i
)/∑q
i
, ‰ (4)
where q
i
and
13
C
i
were СО
2
production rate and carbon isotope composition at i–intervals,
respectively.
Determination of mass isotope balance is based on the suggestion that the characteristics of
carbon isotope content (δ
13
C) of CO
2
produced during microbial mineralization of
hydrocarbons will inherit the δ
13
C value of crude oil with an accuracy of isotopic
fractionation effect. According to (Zyakun et al. 2003), the δ
13
C value of metabolic CO
2
The Waste Oil Resulting from Crude Oil Microbial Biodegradation in Soil
73
produced during oxidation of n-hexadecane and aliphatic hydrocarbons was less by 1-3
‰ compared to the isotope characteristics of substrates used. It means that the δ
13
C value
of CO
2
produced during microbial degradation of oil hydrocarbons was estimated by δ
13
C
equal to the value over a rang of -28 to -31 ‰, where δ
13
C of the crude oil was about of
δ
13
C
oil
= –28,40,2 %o. It is rather different from CO
2
resulting from soil organic
matter (SOM) mineralization (δ
13
C
SOM
is equal to -23,5±0,5 ‰ for the soil). Thus, after
addition of the oil hydrocarbon to soil, the mass isotope balance for CO
2
evolved during
microbial mineralization of SOM and the exogenous substrate (SUB) was calculated using
equation [5]:
δ
13
C
SOM
×Q
SOM
+ δ
13
C
SUB
×Q
SUB
= δ
13
C
MIX
×(Q
SOM
+ Q
SUB
) (5)
where δ
13
C
SOM
and δ
13
C
MIX
are isotopic characteristics of
13
C content in CO
2
before and after
substrate addition to the soil; δ
13
C
SUB
is the isotopic characteristic of
13
C content in CO
2
produced during microbial mineralization of the test substrate; Q
SOM
and Q
SUB
are CO
2
quantities resulted from microbial mineralization of SOM and added substrate in the soil
samples, respectively.
Here the shares of СО
2
formed by mineralization of SOM (F
SOM
) and oil hydrocarbons (F
SUB
)
are presented, by definition, as [6] and [7]:
F
SOM
= Q
SOM
/(Q
SOM
+ Q
SUB
) (6)
F
SUB
=(1-F
SOM
)= Q
SUB
/(Q
SOM
+ Q
SUB
) (7)
Using carbon isotope characteristics of total СО
2
formed by microbial mineralization of
SOM and oil hydrocarbons (
13
C
tot
) (in experiments) and СО
2
formed by mineralization of
only SOM (
13
C
SOM
) (in controls) and assuming that СО
2
produced by oil mineralization
inherits its isotope composition (
13
C
oil
), respectively, the share of СО
2
formed by
mineralization of SOM (F
SOM
) in experiments was calculated by expression [8].
F
SOM
= (
13
C
tot
-
13
C
oil
)/(
13
C
SOM
-
13
C
oil
) (8)
2.5 Cumulative CO
2
resulted from hydrocarbon mineralization
Cumulative CO
2
produced during the microbial substrate oxidation was calculated as
follows. The ΔQ
i
quantity of CO
2
evolved during the Δt
i
-time interval (i = 1,2, …,n) was
estimated as ΔQ
i
= Δt
i
·v
i
, where the v
i
-value is the rate of CO
2
evolved during the time
interval Δt
i
. Using δ
13
C
soil
, δ
13
C
Subst
and δ
13
C
CO2(mix)(i)
, the fraction of CO
2
resulting from
the exogenous substrate (crude oil hydrocarbons) oxidation during Δt
i
can be calculated
as [9]:
ΔQ
Subst(i)
=(1-F
SOM(i)
)·ΔQ
i
(9)
where F
SOM(i)
value can be estimated using equation [8]. The cumulative CO
2
quantity
(Q
Subst(CO2)
) resulting from microbial oxidation of the substrates in soils was presented by
[10], where i varied from 1 to n:
Q
Subst(CO2)
=Σ ΔQ
Subst(i)
(10)
Management of Organic Waste
74
2.6 Calculation of priming effects
The addition of exogenous test substrate (oil hydrocarbons) to soil was accompanied by the
change in soil microbiota activity: the rate of CO
2
production initially increased as a result of
substrate and probably SOM mineralization and then, on depletion of the substrate, gradually
decreased. The amount of CO
2
evolved was divided by means of mass isotope balance into
two fractions: from the substrates (oil hydrocarbons) and from SOM mineralization. Thus, the
difference between CO
2
evolved from SOM mineralization in oil hydrocarbons amended soil
(C
*SOM
) and in the control soil (C
SOM
) relative to the control (in percentage) was used to
estimate the magnitude of the priming effect (PE) induced by oil hydrocarbons (denoted as
SUB). The PE value was determined in two notations as kinetic PE(Δt
i
) calculated as a value for
Δt
i
–time intervals using equation [11] and the PE(total) calculated as a weighted average value
for the whole period of observation using equation [12].
PE(Δt
i
) [%] = 100×(C
*SOM(i)
- C
SOM(i)
)/C
SOM(i)
(11)
where C
*SOM(i)
= F
i
×C
(SUB+SOM)I
; C
(SUB+SOM)i
is the total C evolved as CO
2
in the amended soil
during Δt
i
-time; and F
i
is the share of CO
2
-C resulting from the SOM in crude oil amended
soil in Δt
i
-time, which was calculated by equation [8].
PE(total) [%]=Σ(PE(Δt
i
)·Δt
i
)/Σ(Δt
i
) (12)
where PE(Δt
i
) was calculated according to Eq. [11].
3. Degradation of oil hydrocarbons by soil microbiota and laboratory bacteria
introduced into soil
3.1 Soil samples
Arable soil samples from the Krasnodar region of Russia were used in the experiment after
they had been cultivated with corn (С
4
-plant). Soil samples were sieved through a 2 mm
sieve and then moistened to 60 % of field capacity. The initial organic matter content was
about 4.9 % of dry soil (DS) weight or 19.6 mg С g
-1
DS. The carbon isotope composition in
the initial SOM was characterized by a
13
C value of -23.01 0.2 ‰, typical of soils vegetated
by С
4
-plants.
3.2 Crude oil test-substrate
The crude oil as hydrophobic compound was applied as follows: crude oil (4 ml of oil
corresponding to 3200 mg) was added to 10 g of dried and dispersed soil and then 10 g of
the soil was mixed with fresh moist soil equivalent to 100 g of dry material. The final
substrate concentration was 27.43 mg C g
-1
soil. Since the content of SOM in the initial dry
soil sample was about 19.6 mg C/g DS, the share of oil hydrocarbons introduced into the
soil exceeded 1.4-fold the quantity of SOM. Assuming that the major part of crude oil spilled
over the soil is contained in the upper 10-cm layer, we find that the supposed degree of soil
pollution will be about 32 tons per 1 ha.
The carbon isotope composition of the oil hydrocarbons used in these experiments was
characterized by a
13
C value of -28.4 0.1 ‰, the light and heavy oil hydrocarbon
The Waste Oil Resulting from Crude Oil Microbial Biodegradation in Soil
75
fractions having values -28.9 %o and -27.2 %o, respectively. The isotopic characteristics
(
13
C) of the oil used in the experiments were found to be close to the samples of crude oil
from oilfields of the Arabian region, where the
13
C value was –27.5 0.5 ‰ for oil, -28
0.5 ‰ for alkane fraction, and -26.5 1.5 ‰ for the fraction containing mainly aromatic
hydrocarbons, respectively (Belhaj et al. 2002).
3.3 Microorganisms
To estimate the potential of microbial mineralization of oil hydrocarbons polluted soils, the
CO
2
production was determined in 12 glass vials with tested soils (three replicates of each
experiment and control) (Table 1). In Experiment 1, crude oil was introduced into vials with
native soil containing only native soil microorganisms; in Experiment 2, the laboratory
strain Pseudomonas aureofaciens BS1393(pBS216) (Kochetkov et al. 1997) was additionally
introduced into the same soil with oil. Native soil without oil and the same soil with the
strain BS1393(pBS216) were used as controls 1 and 2, respectively (Table 1).
The strain Pseudomonas aureofaciens BS1393(pBS216) bears the plasmid pBS216 that controls
naphthalene and salicylate biodegradation, is able to utilize aromatic oil hydrocarbons, and
has an antagonistic effect on a wide range of phytopathogenic fungi (Kochetkov et al. 1997).
The ability of the strain to synthesize phenazine antibiotics and thus staining its colonies
bright-orange on LB agar medium allowed its use as a marker of quantitative presence of
the above microorganisms in soil in the presence of aboriginal microflora ( Sambrook, et al.
1989].
Control 1: Native soil with soil
microbiota (three of glass vials)
Control 2: Native soil with soil microbiota +
Pseudomonas aureofaciens BS1393(pBS216) (three of
g
lass
vials)
Experiment 1: Native soil with soil
microbiota + crude oil (three of
glass vials)
Experiment 2: Native soil with soil microbiota + crude
oil+ Pseudomonas aureofaciens BS1393(pBS216) (three of
glass vials)
Table 1. Scheme of experiments and controls
The introduced strain was previously grown in liquid LB medium till stationary phase
(28°С, 18 h) and then uniformly introduced into soil to a concentration of 10
6
cells g
-1
soil.
The control of the bacteria strain growth was accomplished weekly during 67 days. A
composite soil sample was collected from three separate sub-samples from the vial and
analyzed for bacterial quantities. Approximately one g of the composite soil sample was
suspended in 10 ml of 0.85% NaCl on “Vortex”, soil particles were precipitated, and 1 ml of
supernatant was used for making dilutions (10×-10000×). Volume of 0.1 ml of the
Management of Organic Waste
76
corresponding dilutions was inoculated onto Petri dishes with LB medium. The colony-
forming units (CFU) on the plates were counted and their mean values in the control and
experiments were calculated.
As seen from Table 2, in one day after introduction of the strain P. aureofaciens
BS1393(pBS216) experiments (soil with oil) and controls (soil without oil) showed a decrease
of the quantity of cells of this strain from 10
6
cells g
-1
soil to 10
4
cells g
-1
soil measured as
colony-forming units (CFU). However, in 7 days after the beginning of the experiment, the
CFU number of the bacteria introduced in the experiment with oil was about 2.7 ×10
6
cells g
-
1
DS, i.e. more than 17-fold higher than the CFU of the same bacterium in the control soil
without oil (Table 2). These results indicate the ability of the strain introduced for
biodegradation of oil hydrocarbons to utilize them as a growth substrate. In 14-21 days, the
CFU of the introduced strain noticeably decreased again and by day 28 reached the initial
level of 10
4
cells g
-1
DS.
Variants
Colony-forming units (x10
4
)/g of soil
*1 d 7 d 14 d 21 d 28 d 35 d
Control 8.0 (1.7) 15.7 (5.8) 4.0 (0.9) 1.6 (0.6) 3.1 (3.5) 2.2 (0.9)
Experiment 4.7 (3.4) 268.0 (149) 31.7 (18.7) 21.1 (14.4) 2.4 (1.4) 1.5 (0.5)
*Times after bacteria culture was introduced into soil. (Standard deviations from 3 parallels are given in
parenthesis)
Table 2. Growth of Pseudomonas aureofaciens BS1393(pBS216) without (control) and with
crude oil hydrocarbons (experiment) to a concentration of 10
6
colony-forming units g
-1
of
soil introduced into arable soil.
3.4 Microbial СО
2
production in soil
Total rates of microbial mineralization of SOM and oil hydrocarbons in soil were
determined by the rate of CO
2
production (μg C-CO
2
g
-1
DS h
-1
).
In controls 1 and 2, the rates of SOM mineralization both by aboriginal soil microorganisms
and the mixture of these microorganisms plus introduced strain P. aureofaciens
BS1393(pBS216) were within the range of 0.2 0.02 μg C-CO
2
g
-1
DS h
-1
and practically did
not change during the 67-day observation (Fig. 1, control 1 and control 2). In soil with
added oil hydrocarbons (experiments 1 and 2), the rate of mineralization of total organic
carbon significantly increased and reached the maximum value of about 3.2 μg C-CO
2
g
-1
DS
h
-1
on days 7-8 after the beginning of the exposure
.
(Fig. 1, Exp. 1 and Exp. 2). In
experiment 2, with the bacterium P. aureofaciens BS1393(pBS216) added to the indigenous
microbiota, there are two maximums of CO
2
production rate: the first in 3 days and the
second one in 8 days after the beginning of exposure (Fig. 1, Exp. 2). In the experiment 1
with aboriginal microbiota (Fig. 1, Exp. 1) only one maximum of CO
2
production rate was
observed in 7 days after the beginning of exposure. It is supposed that this special feature
was responsible for the availability of the introduced bacteria P. aureofaciens BS1393(pBS216)
to consume the oil hydrocarbons.
The Waste Oil Resulting from Crude Oil Microbial Biodegradation in Soil
77
Time, d
0 10203040506070
g C-CO
2
g
-1
dw h
-1
0,0
0,5
1,0
1,5
2,0
2,5
3,0
3,5
Tim e, d vs C ontrol 1
Tim e, d vs C ontrol 2
Tim e, d vs Exp 1
Tim e, d vs Exp 2
Fig. 1. Rates of СО
2
production by microbial mineralization of substrates in experiments
simulating microbial utilization of oil hydrocarbons. Control 1 (aboriginal microflora);
Control 2 (aboriginal microflora + introduced bacteria); Experiment 1 (aboriginal microflora
+ oil); Experiment 2 (aboriginal microflora + introduced bacteria + oil)
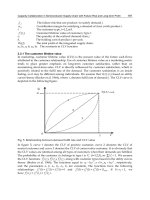
Two to 3 days (Exp. 2) and 5 to 6 days (Exp. 1) days after the start of exposure,
,
the crude oil
introduced into agricultural soil caused an exponential increase in the CO
2
emission rate
indicating microbial growth after lag-phase (Fig. 2).
Tim e, d
012345678
Rate
g C-CO
2
g
-1
dw h
-1
0,0
0,5
1,0
1,5
2,0
2,5
3,0
3,5
Exp. 1
Exp. 2
Fig. 2 Substrate-induced respiratory response of the microbial community during incubation
of soil treated with crude oil hydrocarbons: 1 - the initial CO
2
emission by growth of native
soil microbiota and 2- the initial CO
2
emission by growth of mixture of native soil
microbiota with strain P. aureofaciens BS1393(pBS216)
Management of Organic Waste
78
At the initial stages of microbial oil mineralization in experiments 1 and 2, the specific rates
of metabolic CO
2
emission (µ) were determined using the approximating equation [1] and
lag periods (t
lag
) were calculated by the equation [2] (Table 3). The values of parameters K
as an index of catabolism of microbial cells in soil were calculated from the analysis of CO
2
production at the initial stages of microbial oil mineralization. The values of parameters K
(Table 3) show the close rates of initial production of metabolic CO
2
in these experiments.
At the same time, parameter r indicating the presence of growing microorganisms in soil is
higher by three orders of magnitude in experiment 2 with introduced bacteria compared to
experiment 1 with native microbiota in soil. Parameter µ showing specific rates of CO
2
production in experiments 1 and 2 has close values within the measurement error. As one
would expect, the lag period of test substrate consumption and CO
2
production in
experiment 2 with the introduced bacterium P. aureofaciens BS1393(pBS216) was about
2,5±03 days, i.e., significantly less than in experiment 1 with native microbiota only (the lag
period of 6,2±0,5 days).
Type of soil
µg CO
2
-C g
-1
soil h
-1
t
lag
, d
K r µ
Native soil microbiota (Experiment. 1)
Agricultural soil 0.6085 8.991·10
-6
1.7814 6.2 (0.5)
Native soil microbiota + P. aureofaciens BS1393(pBS216) (Experement. 2)
Agricultural soil 0.4906 7.445·10
-3
1. 6913 2.5 (0.3)
Table 3. Parameters of the equations [1] and [2] characterized the respiration rates of native
soil microbiota (Experiment 1) and mixture microbiota after bioagmentation with strain P.
aureofaciens BS1393(pBS216) (Experiment 2) after crude oil addition to the agricultural soil.
Standard deviation intervals are in brackets
Beginning from day 25 to day 67 from exposure, the rate of СО
2
production in experiments 1
and 2 decreased slightly and stabilized at a level of 1.25 0.25 μg C-CO
2
g
-1
DS h
-1
(Fig. 1).
Total СО
2
production in controls (control 1 and 2) for the 47-day and for 67-day periods of
observation was 24.8 ±1.2 mg C-CO
2
and 35.5 1.2 mg C-CO
2
(Table 4).
Experiment
Mean Production rate,
μg С-СО2 g-1 DS h-1
*Total production,
mg С-СО2
**Time, days
Control 1
Control 1
Control 2
Control 2
Experiment 1
Experiment 1
Experiment 2
Experiment 2
0.228(0.013)
0.228(0.013)
0.213(0.013)
0.213(0.013)
1.480(0.122)
1.480(0.122)
1.546(0.100)
1.546(0.100)
25.7 (0.6)
36.7 (0.6)
24.03 (0.6)
34.25 (0.6)
167 (6)
238 (6)
174 (5)
251 (5)
47
67
47
67
47
67
47
67
*Total production Q
total
=(24·v
average
(μg С-СО
2
g
-1
DS h
-1
)· t (days))x100 g DS
**Time after the crude oil addition to soil. Standard deviations of three parallel determinations are given
in brackets.
Table 4. Mean rates of СО
2
emission (μg С-СО
2
g
-1
DS per h) and total production of С-СО
2
during the time experiment (mg С-СО
2
per 100 g DS)
The Waste Oil Resulting from Crude Oil Microbial Biodegradation in Soil
79
The absence of any significant differences in СО
2
production in controls 1 and 2 was
considered as an evidence of insignificant additional mineralization of SOM attributable to
the introduced strain of P. aureofaciens BS1393(pBS216 ). In the case of oil-containing soils,
the amounts of metabolic СО
2
in experiments 1 and 2 exceeded 6.8-fold that of controls 1
and 2, being 167.0 and 238 mg C-CO
2
(Exp. 1) and 174.0 and 251 mg C-CO
2
(Exp. 2) during
47- and 67-day exposure, respectively (Table 4). The data also showed that the additional
introduction of the hydrocarbon-oxidizing strain P. aureofaciens BS1393(pBS216) into oil-
containing soil (Exp. 2) promoted the increase of metabolic СО
2
amount (4 - 13 %) compared
to the aboriginal soil microorganisms.
Total СО
2
production in experiments 1 and 2 included microbial mineralization of SOM and
oil hydrocarbons, therefore the share of СО
2
formed by mineralization of each of the above
substrates was determined by measuring values
13
C, both in the carbon isotope
characteristics of SOM and oil products and in the metabolic carbon dioxide formed during
this process.
3.5 Analysis of the origin of soil СО
2
using
13
C/
12
C ratios
In experiments 1 and 2, the
13
C values of the metabolic CO
2
released from soil in the 3 days
before oil hydrocarbons introduction into soil were –23.53 0.21 %o and –23.56 0.25 %o,
respectively, and actually identical to the isotopic characteristics of СО
2
in the controls (Fig. 3).
Time, d
0 10203040506070
13
C, %o
-30
-28
-26
-24
-22
-20
time, d vs Control 1
time, d vs control 2
time, d vs exp 1
time, d vs exp 2
Fig. 3. Carbon isotope characteristics (
13
C, ‰) of CO
2
produced in experiments of microbial
mineralization of SOM and oil hydrocarbons introduced into soil: Control 1 (aboriginal
microflora); Control 2 (aboriginal microflora + introduced bacteria); Experiment 1 (aboriginal
microflora + oil); Experiment 2 (aboriginal microflora + introduced bacteria + oil)
Management of Organic Waste
80
After oil hydrocarbons addition to soil, the share of
13
С isotope in metabolic carbon dioxide
abruptly dropped, which was an evidence of СО
2
production partly from oil hydrocarbons
containing less
13
С isotope compared to SOM. The maximum depletion of
13
С isotope in
metabolic СО
2
was registered during the days 11-15 from the beginning of exposure in
experiments 1 and 2. This was considered a result of the mineralization of mainly alkane oil
fractions. Our assumption that the major part of aliphatic hydrocarbons from the introduced
crude oil had already been utilized by that period is evidenced by the carbon isotope
characteristics of the metabolic carbon dioxide with the value of
13
C = -28.5 0.5 %o (Fig.
3). After 15 days and until the end of the experiment (67 days), the isotopic characteristic of
СО
2
was at around the value of
13
C = -26.8 0.5 %o. Using equation [4], the average
weighted isotope composition of СО
2
produced by microbial mineralization of total organic
products (oil hydrocarbons and SOM) in experiments 1 and 2 during 67-days was
characterized by
13
C values about of -26.6 0.1 %o, which significantly differed from the
carbon isotope characteristics of oil (
13
C = -28.4 0.2%o) and SOM (
13
C = -23.01 0.2 ‰,).
It can be said with confidence that metabolic CO
2
was produced during microbial
mineralization of a part of SOM and a part of oil hydrocarbons.
3.6 Priming effect of oil hydrocarbons
The kinetic PE was calculated by comparing СО
2
amounts generated by microbial
mineralization of SOM and oil products (Exp. 1 and 2) to СО
2
amounts generated in the
controls in the corresponding periods of observation [Eq. 11].
In order to quantify both the extent and direction of PE of oil hydrocarbons, we have
compared the rates of СО
2
production by microbial mineralization of SOM before and after
introduction of oil hydrocarbons into soil at the initial period of maximum microbial
activity, i.e., during 15 days after addition of crude oil to soil (Fig. 4). As shown in Figure 4
(A), the activation of the metabolism of aboriginal hydrocarbon-oxidizing soil
microorganisms in experiments 1 took about 6 days from the introduction of the
hydrocarbon substrate, when microbial rate of СО
2
production increased to a rate closer to
that of experiment 2 with the P. aureofaciens BS1393(pBS216) addition. The mass isotope
balance data showed that during these days in experiment 1 the mineralization of oil
hydrocarbons was insignificant and the rate of SOM mineralization was less the rate in
control (negative PE) (Fig. 4, C PE_1). Experiment 2, in contrast to experiment 1, showed the
utilization of oil hydrocarbons in the initial period of exposure was accompanied by a
noticeable increase of SOM mineralization rate compared to the initial value (positive PE)
(Fig. 4, C PE_2). However, PE became negligible in both experiments during 6-8 day
exposure; it is possibly the mineralization time of aliphatic hydrocarbons or their partially
oxidized products. The negative PE has been demonstrated previously in the processes of
the microbial mineralization of n-hexadecanoic acid introduced into soil (Zyakun et al.
2011). At the next period of the exposure, the PE values demonstrate the positive values of
300 % in experiment 1 and about 400 % in experiment 2. On completion experiments, the
total PE has been calculated using Eq. {12}. Taking into account the CO
2
quantity registered
in experiments 1 and 2 during the whole period of exposure (Table 4, Q
tota
l) and the share of
CO
2
under microbial utilization of SOM (Table 5, F
SOM
), we find the quantity of CO
2
form as
a result of SOM mineralization in the experiments (Table 5, [CO
2
]
SOM
)