Báo cáo hóa học: " Surface properties of glass micropipettes and their effect on biological studies" pot
Bạn đang xem bản rút gọn của tài liệu. Xem và tải ngay bản đầy đủ của tài liệu tại đây (2.41 MB, 10 trang )
NANO EXPRESS Open Access
Surface properties of glass micropipettes and
their effect on biological studies
Majid Malboubi
1*
, Yuchun Gu
2
and Kyle Jiang
1*
Abstract
In this paper, an investigation on surface properties of glass micropipettes and their effect on biological
applications is reported. Pipettes were pulled under different pulling conditions and the effect of each pulling
parameter was analyzed. SEM stereoscopic technique was used to reveal the surface roughness properties of
pipette tip and pipette inner wall in 3D. More than 20 pipettes were reconstructed. Pipette heads were split open
using focused ion beam (FIB) milling for access to the inner walls. It is found that surface roughness parameters
are strongly related on the tip size. Bigger pipettes have higher average surface roughness and lower developed
interfacial area ratio. Furthermore, the autocorrelation of roughness model of the inner surface shows that the
inner surface does not have any tendency of orientation and is not affected by pulling direction. To investigate the
effect of surface roughness properties on biological applications, patch-clamping tests were carried out by
conventional and FIB-polished pipettes. The results of the experiments show that polished pipettes make
significantly better seals. The results of this work are of important reference value for achieving pipettes with
desired surface properties and can be used to explain biological phenomenon such as giga-seal formation.
Introduction
Since Barber (1902) used a glass pipette as an intracellu-
lar microelectrode [1], micropipettes have become an
essential tool for biological studies. Dozens of pipettes
may be used by an individual in a single day. A micro-
pipette works as a bridge between microscopic biological
samples and macroscopic measuring devices, most often
by forming a liquid channel for signal acquisition. To
date, micropipettes have been used for many applica-
tions, most notably controll ed delivery of liquids, genes,
or sperms to the target [2-4], fertilization studies [5],
intracellular measurements [1], voltage, current and
patch-cl amp studies [6,7]. In many of these applications,
a smooth tip is preferred because it reduces the chance
of tip con tamination and damage to delicate biological
samples [5]. Recent development in microengineering
and nanosciences has found many applications of
micro/nanopipettes, such as generating microdroplets
[8], single-molecule fluorescence tracking [2], cr eating
nanoscale features by nanolithography and nanowriting
methods [9], and nanosensing in scanning probe
microscopy [10]. Although there are many studies in the
literature on the shapes and geomet ries of pipett es
[1,6,11-15 ], there are no reports about numerical analy-
sis on the effect of pulling parameters on surface rough-
ness properties of glass micropipettes. This information
is important in applications which require direct contact
of pipette and samples. This paper presents an investiga-
tion on the surface roughness properties of glass micro-
pipettes. Pipettes were pulled under different pulling
conditions and the effect of each pulling parameter on
surface roughness properties is investigated. SEM stereo-
scopic technique was used in finding the surface proper-
ties of micropipettes. More than 20 pipettes were
reconstructed. To measure the inner wall surface prop-
erties of the pipettes, the pipette heads were split and
cut by means of focused ion beam (FIB) milling. The
results show that both of the pipette tips and pipette
inner walls are rough. There is a direct correlation
between tip size and surface roughness of pipette, i.e.,
by increasing the tip size, surface roughness also
increases. Autocorrelation plot of the inner wall surface
of pipette shows that the surface does not have any ten-
dency of orientation and is not affected by pulling direc-
tion. The importance of pipette surface roughness
properties in biological studies is also shown. Patch-
* Correspondence: ;
1
School of Mechanical Engineering, The University of Birmingham,
Edgbaston, Birmingham, B15 2TT UK
Full list of author information is available at the end of the article
Malboubi et al. Nanoscale Research Letters 2011, 6:401
/>© 2011 Malboubi et al; licensee Springer. This is an Open Access article distributed under the terms of the Creative Commons
Attribution License ( which permits unrestricte d use, distribution, and reproduction in
any medium, provided the original work is properly cited.
clamp technique is taken as an example of verifying the
findings. Patch-clamping tests were performed using
conventional and FIB-polished pipettes. It is found that
polished pipettes make significantly better seals. This
improvement can be explained by measured surface
roughness properties and bearing area curves para-
meters. The results of this work are of important refer-
ence value for achieving pipettes with desired surface
properties, modeling cell-pipette interactions, and
expl aining some biological phenomena such as giga-seal
formation.
Materials and methods
Pulling pipettes
The puller used in the experiments was Flaming/Brown
micro pipette puller (Model P-97, Sutter Instrument,
Novato, CA). The six parameters on this machine for
controlling the shape and size of micropipettes are heat,
pull, velocity, delay, time, and pressure. F ull details of
these parameters can be found in manufacturer’s catalog
[16].
To investigate the effect of each parameter on pip-
ette’s tip surface properties, one parameter was varied
whereas the others were held uncha nged in every set of
experiments. Delay and time are both c ooling para-
meters. Time has quite narrow working range, whereas
delay provides wider range of control. Therefore, the
effect of delay is investigated. Table 1 shows values of
the parameters used in the experiments. Glass micropip-
ettes pulled from borosilicate glass tubes have an outer
diameter of 1.5 mm and an inner diameter of 0.86 mm
(BF150-86-10, Sutter Instrument). The filament of t he
puller machine was FB230B (2.0-mm-square box fila-
ment, 3.0 mm wide, Sutter Instrument). Pulling pipettes
continuously will make the chamber warm and gradually
decrease the heating time for subsequent pipettes. For
this reason the chamber was left for 5 min to cool down
after pulling every five pipettes.
To test the reproducibility of the puller, ten pipettes
were pulled with each set of parameters and their tip
sizes were measured by SEM. Figure 1 is a summary of
the statistics of the experiments. A few sud den varia-
tions in tip sizes are mainly because of the nonhomo-
geneities in the composition and molecular structure of
borosilicate glass [1]. In the experiments, pipettes with
irregular sizes, far from the expected value, were not
used for reconstruction.
3D reconstruction of pipette tip
To determine the three-dimensional structure of pipette
tips, SEM stereoscopic technique was used in the inves-
tigation [17]. To capture high-quality SEM images
which satisfy stereoscopic technique requirements, glass
micropipettes were coated with a thin layer of platinum
(< 5 nm). The SEM machine used for 3D reconst ruc-
tions was “Quanta 3D FEG” (FEI, Hillsboro, OR, USA).
Three SEM images were taken from different angles by
tilting the stage with respect to the electron beam direc-
tion. Differences in heights of features appear as lateral
displacements in ever y pair of SEM images and the
third dimension can be calculated from the difference
between right and left images. To measure the surface
characteristics, Digital Elevation Model (DEM) of the tip
was created by 3D reconstruction technique using a
comme rcial software package MeX (Alicona, Graz, Aus-
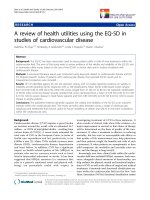
tria) [18]. Figure 2 shows the SEM stereo images used
in reconstruction of a pipette and its DEM.
The important factors in SEM stereoscopic technique
are magnification, tilting angle, and resolution. Since
the maximum pixel resolution of the machine is lim-
ited, different magnifications, and tilting angles have
been used to reconstruct every pipette’s tip with maxi-
mum disparity and highest lateral and vertical resolu-
tion. Such a reconstruction could be expected to have
theinaccuracyoflessthan5%[19].Table2givesthe
values of tip diameter, tilting angle, magnification, lat-
eral resolution, and vertical resolution for three differ-
ent-sized pipettes.
Table 1 Pulling parameters values.
Experiment Heat Velocity Pull Delay Pressure
Effect of heat 595, 600 605 10 0 1 500
Effect of velocity 606 4, 8, 10, 12, 14 0 1 500
Effect of pull 606 10 0, 10, 30 1 500
Effect of delay 606 10 0 1, 20, 40 500
Effect of pressure 606 10 0 1 300, 350, 400, 450
Pi
p
ette number
T
i
ps
i
ze [m]
Figure 1 Pipette pulling experiment records. Ten pipettes were
pulled with the same pulling parameters and their tip sizes were
measured using SEM.
Malboubi et al. Nanoscale Research Letters 2011, 6:401
/>Page 2 of 10
Cell culture and patch-clamping experiments
Human umbilical vein endothelial cells (HUVECs) were
used for patch-clamping experiments. HUVECs were
cultured in Endothelial Basal Medium (EBM, CC-3121,
Lonza, Basel, Switzerland) on coverslips for 2 to 3 days
before the experiments . At the time of experiments, the
confluence of the cells was over 80%. Incubation was
done at 37°C. Patch-clamp experiments were done using
axon multiclamp 700B microelectrode amplifier (Axon
Instruments, Union City, CA, USA). The average open-
ing of the pipette tips was about 1.4 μm in diameter.
The backfilling solution was composed of 40 mM KCl,
96 mM K-gluconate, 4 mM K
2
ATP, 2 mM GTP, 10
mM HEPE, and at 7.2 in pH, and the bath solution was
composed of 110 mM NaCl, 5 mM KCl, 1 mM MgCl
2
,
1 mM CaCl
2
, 5 mM HEPEs, 5 mM HEPE-Na, and at 7.2
in pH.
Results and discussion
Over 20 pipettes have been reconstructed in the study.
The effect of each parameter is studied by investigating
at least three reconstructions. Tip diameter (D
t
)and
average surface roughness (S
a
) of all pipettes have been
measured. Figures 3, 4, 5, 6 and 7 show correlations
between pulling parameters and D
t
and S
a
.
As it can be seen from Figures 3, 4, 5, 6 and 7, velo-
city has the most significant effect. A small increase in
velocity significantly d ecreases D
t
and S
a
. The effects of
pull and heat are very similar a nd not as significant as
the effect of velocity. Delay and pressure are factors to
change the taper length of the pipettes while keeping
the tip size unchanged [16]. Increasing delay and pres-
sure will result in a shorter taper. Although these two
factors do not change tip diameter significantly, it can
be seen from Figures 6 and 7 that the bigger pipette has
abc
d
Figure 2 SEM stereoscopic images captured from different angles. -5° (a), 0° (b), and 5° (c), DEM created using MeX (d). For surface texture
parameters of this pipette please see Tables 3 and 5. The bar represents 10 μm.
Table 2 Reconstruction information for three pipettes.
Pipette number Tip diameter (μm) Tilting angle (left to right) Magnification Lateral resolution (nm) Vertical resolution (nm)
1 34.5 10 5,000 29 41
2 19.3 10 8,000 18.1 19.7
3 3.7 10 50,000 5.8 8.2
Malboubi et al. Nanoscale Research Letters 2011, 6:401
/>Page 3 of 10
H
eat
Surface roughness (nm)
Tip diameter (
m)
D
t
S
a
Figure 3 The effect of heat on tip diameter and average
surface roughness. The heat is controlled by the level of electrical
current supplied to the filament. The unit of heat is milliamp. Useful
changes in heat are 5 units or more to see an effect. By increasing
the heat, both of the S
a
and D
t
decreases.
Velocit
y
Tip diameter (
m)
Surface roug
h
ness
(
nm
)
D
t
S
a
Figure 4 The effect of velocity on tip diameter and average
surface roughness. This control measures the velocity of the glass
carriage system as the glass softens. By increasing the velocity, both
the tip size and the surface roughness decrease. The velocity has the
most significant effect on the tip size and the surface roughness. A
small change in velocity value decreases S
a
and D
t
rapidly.
P
u
ll
Tip diameter (
m)
Surface roug
h
ness
(
nm
)
D
t
S
a
Figure 5 The effect of the pull on tip diameter and average
surface roughness. This parameter controls the force of the hard
pull. The amount of the pull determines the current to the pull
solenoid. Useful changes in pull strength are 10 units or more to see
an effect. By increasing the pull, both of the S
a
and D
t
decreases.
Dela
y
Surface roughness (nm)
Ti
p
diameter
(
m
)
D
t
S
a
Figure 6 The effect of delay on tip diameter and average
surface roughness. Delay is a cooling mode which controls the
delay time between the time when the heat turns off and the time
when the hard pull is activated. One unit of delay represents 1/2
ms. Delay is an effective means of controlling tip length which does
not change the size of pipette tip notably.
= .
+ .
Ti
p
diameter
(
m
)
Surface roug
h
ness
(
nm
)
Figure 8 Average surface roughness of pipette tip (S
a
) versus
tip diameter (D
t
). S
a
is strongly dependent on D
t
and has a direct
correlation with it. A first degree polynomial equation fitted to data
suggests that S
a
can be estimated knowing the tip diameter of a
given pipette with good approximation.
Pressure
Tip diameter (μm)
Surface roughness (nm)
D
t
S
a
Figure 7 The effect of pressure on tip diameter and average
surface roughness. This control sets the pressure generated by the
air compressor during the active cooling phase of the pull cycle.
The unit of pressure is psi. Changes of less than 10 units will not be
noticeable. Pressure is another way of controlling tip length and
does not change the size of pipette tip significantly.
Malboubi et al. Nanoscale Research Letters 2011, 6:401
/>Page 4 of 10
a higher surface roughness. From Figures 3, 4, 5, 6 and
7 it can be understood that D
t
and S
a
have direct corre-
lation. Figure 8 is obtained by plotting D
t
versus S
a
for
21 pipettes pulled with different pulling parameters. It
can be seen that average surface roughness of pipette is
strongly related to tip size. D
t
and S
a
have direct corre-
lation, i.e., by increasing the tip size, surface roughness
also increases.
As an example, the surface properties of two pipettes
with considerably different tip sizes are shown in Table
3. The bigger pipette has higher average surface rough-
ness (S
a
) and lower developed interfacial ratio (S
dr
). The
importance of these parameters in giga-seal formation
will be discussed later.
Further investigation was conducted for measuring the
inner wall surface roughness properties of glass micro-
pipettes. Two pipettes with different sizes (D
t
=13and
9 μm) were chosen. The pipettes were split and cut
open using focused ion beam milling for access to the
inner walls. The imaging direction was perpendicular to
the cutting plane, avoiding redeposition of sputtered
materials from the FIB cutting to the area. After cutting,
the pipettes were turned 90° by means of a holder
which was previously fabricated. Three SEM images
were taken from the inside wall and 3D structures of
the inner wall were obtained u sing MeX software. Fig-
ures 9 and 10 show an FIB-milled pipette and stereo
images. Table 4 shows inner surface properties of small
Table 3 Tip surface properties for two pipettes having different sizes.
Name Value (D
t
= 34.5 μm) Value (D
t
= 3.9 μm) Description
S
a
149.1 nm 30.8 nm Average height of selected area
S
q
209.9 nm 42.0 nm Root-mean-square height of selected area
S
p
1437.4 nm 304.1 nm Maximum peak height of selected area
S
v
1,409.3 nm 238.0 nm Maximum valley depth of selected area
S
z
2,846.7 nm 542.1 nm Maximum height of selected area
S
10z
2,304.3 nm 414.59 nm Ten-point height of selected area
S
sk
-0.2118 -0.514 Skewness of selected area
S
ku
7.0253 6.4208 Kurtosis of selected area
S
dq
0.5767 1.3246 Root-mean-square gradient
S
dr
13.129% 79.532% Developed interfacial area ratio
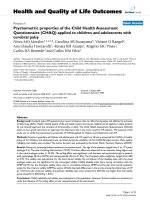
ab
5m
Figure 9 SEM images of pipett e before (a) and after (b) FIB milling. Notice that milled surface is much smoot her than the original
unmodified surface.
Malboubi et al. Nanoscale Research Letters 2011, 6:401
/>Page 5 of 10
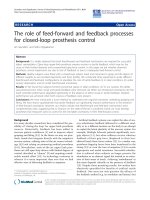
a b
1m
c d
Figure 10 SEM stereoscopic images of the inner wall o f a pipette taken with different prospective.(a) With a tilting angle of -5°, (b)
without a tilting angle, and (c) with a tilting angle of 5° and (d) DEM of the pipette inner wall surface.
Table 4 Inner wall surface properties of two different sized pipettes.
Name Value (D
t
=13μm) Value (D
t
=9μm) Description
S
a
31.1 nm 22.2 nm Average height of selected area
S
q
39.0 nm 28.4 nm Root-mean-square height of selected area
S
p
158.5 nm 151 nm Maximum peak height of selected area
S
v
150.3 nm 132.6 nm Maximum valley depth of selected area
S
z
308.9 nm 303.6 nm Maximum height of selected area
S
10z
273.3 nm 247.5 nm Ten-point height of selected area
S
sk
0.0267 0.186 Skewness of selected area
S
ku
2.945 3.740 Kurtosis of selected area
S
dq
0.616 0.838 Root-mean-square gradient
S
dr
17.773% 31.965% Developed interfacial area ratio
Malboubi et al. Nanoscale Research Letters 2011, 6:401
/>Page 6 of 10
and big pipettes. The small pipette has a lower S
a
and
higher S
dr
. To determine the effect of pulling direction
on surface texture of pipette inner wall, autocorrelation
of roughness model for the pipette inner surface is
obtained. The autocorrelation plot, Figure 11, suggests
that the surface does not have any tendency of orienta-
tion and is not affected by pulling direction.
The fact that both the pipette tips and pipette inner
walls are rough may help better understanding of the
mechanism of applications in which pipettes are in con-
tact with vulnerable biological samples. Patch-clamp
technique is taken as an example of pipette applications.
Patch-clamping suffers from current leakage between
cell membrane and glass surface. Cell membrane is
sucked from 5 to 100 μ m into a pipette in patch clamp-
ing. Optical and electron microscope images of patches
show that membrane and pipette are in close con tact,
but they do not show the surface topography involved
in seal formation [20,21]. Surface roughness of glass
micropipettes is reported in the literature to play an
important role in giga-seal formation [11-13,22,23]. Nor-
mally, pipettes are fire polished before experiments to
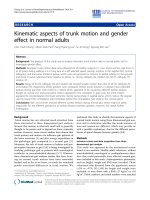
Autocorrelation of roughness model
S
al
=141.42nm
S
tr
=0.8453
01234
1
2
3
4
[
m
]
[
m]
Figure 11 Autocorrelation of roughness model of the surface shown in Figure 10. The plot shows that the surface doesn’thaveany
texture orientation. Large value of Texture Aspect Ratio of the Surface (S
tr
) indicates uniform texture in all directions i.e., no defined lay. Small
value of Autocorrelation Length (S
al
) denotes that the surface is dominated by high frequency components (see the inset in Figure 10d).
Malboubi et al. Nanoscale Research Letters 2011, 6:401
/>Page 7 of 10
make rough tips smoother. In this study, FIB milling is
used for polishing pipette. FIB polishing was found to
be a more controllable process. Fire polishing requires a
very good timing and positioning. Pipette end can be
easily overheated which results in a closed tip or irregu-
lar tip shape. Fire polishing melts the glass and makes
pipette tips smoother but it also has a blunting effect on
tips which change the pipette shape and sharpness. FIB
polishing allows working ontheveryendofpipettes
(the last one micron from the tip) without changing
other properties of pipettes such as shape and sharp-
ness. To observe the importance of surface roughness of
pipette on giga-seal formation, patch-clamp experiments
were carried out using conventional and FIB-polished
pipettes. FIB milling of pipettes leaves an ultimately
smooth surface free from peaks and valleys or sharp
spikes. Figure 12 shows images of a pipette before and
after FIB milling. Because of the conic shape of pipette
only the very end of pipette was cut during milling pro-
cess in order not to change the pipette opening signifi-
cantly. Ten recordings were obtained for each type of
pipettes. Seal resistances are shown in Figure 13. FIB-
polished pipettes formed significantly better seals which
made it possible to measure single ion channel currents
with considerably lower noise (see Figures 14 and 15).
Higher seal resistance for polished pipettes could be
explained by their better sealing potential. Contact area
between pipette tip and cell membrane is higher for
polished pipettes and since there are no peaks or spikes,
membrane can get closer to the tip. As a result, it is
more difficult for ions to escape form glass-membra ne
distance and higher seal are achievable.
It is well known that pipettes with a smaller opening
form a better seal and lower leakage current. This can
also be explained by comparing the roughness para-
meters of pipettes with different size openings. For
instance, Table 5 shows the bearing area curve para-
meters of the two pipettes discussed in Table 3. Surface
bearing area curve provides useful information about
the peak, core and valley volumes, and fluid retention
ability of the surface [24].
Tables 3 and 4 show that bigger pipettes have higher
S
a
both at the tip and at the inner surface. Maximum
peak to valley distance is also higher for bigger pipettes.
Table 5 shows that valley void volume (V
vv
) is consider-
ably high for bigger pipettes. This indicates that the big-
ger pipettes have more fluid retention ability. The ratio
of V
vc
/V
mc
is also larger for bigger pipettes, which
means that there are more voids present compared to
smaller pipettes. During patch-clamp experiments, val-
leys and voids are filled with conductive media facilitat-
ing ion escape, increasing the leakage current and
compromising the seal. By comparing the values in
Tables 3 and 4, one can also find that developed interfa-
cial area ratio (S
dr
) changes significantly for small and
big pipettes. S
dr
is expressed as the percentage of addi-
tional surface area contributed by the texture as com-
pared to an ideal plane [24]. This parameter is useful in
applications which involve surface coatings and adhe-
sion. A recent study show s that having higher S
dr
can
promote cell adhesion significantly [25]. In giga-seal for-
mation membrane proteins are denatured against the
glass and pull the membrane closer to glass, causing a
tight se al [26]. The fact that smaller pipettes have nota-
bly higher S
dr
at the tip and at the pipette inner wall
surface means that a higher percentage of the pipette
surface contributes in glass-membrane interactions. This
ab
1m2m
Figure 12 Glass micropipette before (a) and after (b) FIB milling.
Malboubi et al. Nanoscale Research Letters 2011, 6:401
/>Page 8 of 10
increases the number of membrane proteins sticking to
the pipette inner wall and improves the seal.
Conclusions
In this paper, the effect of pulling parameters on the
surface properties of glass microp ipettes is rep orted.
Although different pulle rs are being used in labora-
tories, they utilize the same principles; therefore the
results of this study can be applied to almost all of the
puller machines. More than 20 pipettes were r econ-
structed with SEM ste reoscopic technique. The results
show that surface roughness parameters of glass
micropipettes are strongly related to tip size. A further
inspection on the inner wall surface properties of big
and small pipettes found that the bigger pipettes had
higher S
a
and lower S
dr
. Autocorrelation of roughness
model shows that the inner surface does not have any
orientation tendency and is not affected by pulling
direction. Surface roughness parameters of pipette tips
have significant influence on many applications, espe-
cially when pipettes are used in contact with
vulnerable biological samples, for example, in patch-
clamping experiments. Single-channel currents
recorded from HUVECs cells show significantly lower
noise and leakage current for pipettes polished by FIB
milling. This enhancement accounts for better contact
conditions of polished pipettes and the fact that
polished pipettes do not have valleys and voids which
facilitate current leakage in the patch-clamping. The
resultsofthisstudycanbeusedtoexplainsome
observations in laboratory practice. For example, smal-
ler pipettes make better seals because smaller pipettes
have lower S
a
and higher S
dr
than bigger pipettes. The
results of this work have important reference value for
Conventional pipettes
FIB Polished pipettes
Treatment method
Seal resistance [GΩ]
Figure 13 Seal resistances for the two types of pipettes.The
results are from 20 experiments. As it can be seen, the statistics of
the FIB-polished pipettes are significantly better than conventional
pipettes.
0 20000 40000 60000 80000
Time
[
ms
]
2
1
3
I patch [pA]
Figure 14 Sing le-cha nnel currents recorded from HUVECs for
conventional pipettes.
0 20000 40000 60000 80000
Time
[
ms
]
0
1
2
Ipatc
h
[pA]
Figure 15 Sing le-cha nnel currents recorded from HUVECs for
FIB-polished pipettes. Comparing with Figure 14, FIB-polished
pipettes resulted in a lower leakage current and noise due to the
better sealing conditions of FIB-polished pipettes.
Table 5 Values of the bearing area curve for two pipette
tips having different sizes.
Name Value
(D
t
= 34.5 μm)
Value
(D
t
= 3.9 μm)
Description
S
k
412.7 nm 85.5 nm Core roughness depth,
Height of the core material
S
pk
266.3 nm 42.6 nm Reduced peak height, mean
height of the peaks above
the core material
S
vk
320.1 nm 66.3 nm Reduced valley height, mean
depth of the valleys below
the core material
S
mr1
10.91% 8.16% Peak material component,
the fraction of the surface
which consists of peaks
above the core material
S
mr2
89.08% 84.98% Peak material component,
the fraction of the surface
which will carry the load
V
mp
0.013 ml/m
2
0.002 ml/m
2
Peak material volume of the
topographic surface (ml/m
2
)
V
mc
0.146 ml/m
2
0.033 ml/m
2
Core material volume of the
topographic surface (ml/m
2
)
V
vc
0.204 ml/m
2
0.039 ml/m
2
Core void volume of the
surface (ml/m
2
)
V
vv
0.028 ml/m
2
0.006 ml/m
2
Valley void volume of the
surface (ml/m
2
)
V
vc
/
V
mc
1.410 1.174 Ratio of V
vc
parameter to
V
mc
parameter
Malboubi et al. Nanoscale Research Letters 2011, 6:401
/>Page 9 of 10
achieving pipettes with desired surface properties, and
may also change the way of modeling cell-pipette
interactions.
Author details
1
School of Mechanical Engineering, The University of Birmingham,
Edgbaston, Birmingham, B15 2TT UK
2
IMM, Peking University, 5 Yiheyuan
Road Beijing, 100871 China
Authors’ contributions
MM conceived and designed the study, carried out the experiments,
analyzed the results and drafted the manuscript. YG assisted in patch
clamping experiments. KJ supervised the research, contributed in
interpretation of data and revision of the manuscript. All the authors have
given final approval of the version to be published.
Competing interests
The authors declare that they have no competing interests.
Received: 15 February 2011 Accepted: 31 May 2011
Published: 31 May 2011
References
1. KT Brown, DG Flaming, Advanced micropipette techniques for cell physiology.
(San Francisco: Wiley, 1995)
2. A Bruckbauer, P James, D Zhou, JW Yoon, D Excell, Y Korchev, R Jones, D
Klenerman, Nanopipette delivery of individual molecules to cellular
compartments for single-molecule fluorescence tracking. Biophys J. 93,
3120–3131 (2007). doi:10.1529/biophysj.107.104737
3. RG Martin Keith, RL Klein, HA Quigley, Gene delivery to the eye using
adeno-associated viral vectors. Methods. 28, 267–275 (2002). doi:10.1016/
S1046-2023(02)00232-3
4. Y Kimura, R Yanagimachi, Intracytoplasmic sperm injection in the mouse.
Biol Reprod. 52, 709–720 (1995). doi:10.1095/biolreprod52.4.709
5. M Yaul, R Bhatti, S Lawrence, Evaluating the process of polishing
borosilicate glass capillaries used for fabrication of in-vitro fertilization (iVF)
micro-pipettes. Biomed Microdevices. 10, 123–128 (2008). doi:10.1007/
s10544-007-9117-8
6. B Sakmann, E Neher, Single-channel recording. (New York: Plenum Press,
1983)
7. E Neher, B Sakmann, Single-channel currents recorded from membrane of
denervated frog muscle-fibers. Nature. 260, 799–802 (1976). doi:10.1038/
260799a0
8. A Huebner, S Sharma, M Srisa-Art, F Hollfelder, JB Edel, AJ DeMello,
Microdroplets: A sea of applications? Lab Chip. 8, 1244–1254 (2008).
doi:10.1039/b806405a
9. MH Hong, KH Kim, J Bae, W Jhe, Scanning nanolithography using a
material-filled nanopipette. Appl Phys Lett. 77, 2604–2606 (2000).
doi:10.1063/1.1319181
10. L Ying, A Bruckbauer, D Zhou, J Gorelik, A Shevchuk, M Lab, Y Korchev, D
Klenerman, The scanned nanopipette: a new tool for high resolution
bioimaging and controlled deposition of biomolecules. Phys Chem Chem
Phys. 7, 2859–66 (2005)
11. M Malboubi, H Ostadi, S Wang, Y Gu, K Jiang, Effects of the surface
morphology of pipette tip on giga-seal formation. Engineering Letters. 17,
281–285 (2009)
12. M Malboubi, Y Gu, K Jiang, Experimental and simulation study of the effect
of pipette roughness on giga-seal formation in patch clamping.
Microelectron Eng. 87, 778–781 (2010). doi:10.1016/j.mee.2009.11.115
13. M Malboubi, K Gu Jiang, Study of the tip surface morphology of glass
micropipettes and its effects on giga-seal formation. Lecture Notes in
Electrical Engineering. 60, 609–619 (2010). doi:10.1007/978-90-481-8776-
8_52
14. H Ostadi, M Malboubi, PD Prewett, K Jiang, 3D reconstruction of a micro
pipette tip. Microelectron Eng. 86, 868–870 (2009). doi:10.1016/j.
mee.2008.11.041
15. BI Yakobson, MA Paesler, Kinetics, morphology and pulling regimes for
sensing tips in near-field microscopy. Ultramicroscopy. 57, 241–245 (1995).
doi:10.1016/0304-3991(94)00146-E
16. Flaming/brown micropipette puller, operational manual, sutter instrument
company.
17. G Piazzesi, Photogrammetry with the scanning electron microscope. J Phys
E.
6, 392–396 (1973). doi:10.1088/0022-3735/6/4/023
18. MeX™ software: Alicona Imaging GmbH. Graz, Austria.cona.
com
19. F Marinello, P Bariani, E Savio, A Horsewell, LD Chiffre, Critical factors in SEM
3D stereomicroscopy. Meas Sci Technol. 19,1–12 (2008)
20. M Sokabe, F Sachs, The structure and dynamics of patch-clamped
membranes: A study using differential interface contrast light microscopy. J
Cell Biol. 111, 599–606 (1990). doi:10.1083/jcb.111.2.599
21. A Ruknudin, MJ Song, F Sachs, The ultrastructure of patch-clamped
membranes: A study using high voltage electron microscopy. J Cell Biol.
112, 125–134 (1991). doi:10.1083/jcb.112.1.125
22. S Li, L Lin, A single cell electrophysiological analysis device with embedded
electrode. Sens Actuators A Phys. 134,20–26 (2007). doi:10.1016/j.
sna.2006.04.034
23. N Fertig, RH Blick, JC Behrends, Whole cell patch clamp recording
performed on a planar glass chip. Biophys J. 82, 3056–3062 (2002).
doi:10.1016/S0006-3495(02)75646-4
24. KJ Stout, L Blunt, Three-Dimensional Surface Topography. (London: Penton
Press, 2000)
25. N Eliaz, S Shmueli, I Shur, D Benayahu, D Aronov, G Rosenman, The effect
of surface treatment on the surface texture and contact angle of
electrochemically deposited hydroxyapatite coating and on its interaction
with bone-forming cells. Acta Biomater. 5, 3178–3191 (2009). doi:10.1016/j.
actbio.2009.04.005
26. TM Suchyna, VS Markin, F Sachs, Biophysics and structure of the patch and
the gigaseal. Biophys J. 97, 738–747 (2009). doi:10.1016/j.bpj.2009.05.018
doi:10.1186/1556-276X-6-401
Cite this article as: Malboubi et al.: Surface properties of glass
micropipettes and their effect on biological studies. Nanoscale Research
Letters 2011 6:401.
Submit your manuscript to a
journal and benefi t from:
7 Convenient online submission
7 Rigorous peer review
7 Immediate publication on acceptance
7 Open access: articles freely available online
7 High visibility within the fi eld
7 Retaining the copyright to your article
Submit your next manuscript at 7 springeropen.com
Malboubi et al. Nanoscale Research Letters 2011, 6:401
/>Page 10 of 10