Báo cáo hóa học: " Influence of surface properties on the electrical conductivity of silicon nanomembranes" pot
Bạn đang xem bản rút gọn của tài liệu. Xem và tải ngay bản đầy đủ của tài liệu tại đây (683.81 KB, 7 trang )
NANO EXPRESS Open Access
Influence of surface properties on the electrical
conductivity of silicon nanomembranes
Xiangfu Zhao
1,2
, Shelley A Scott
1
, Minghuang Huang
1
, Weina Peng
1
, Arnold M Kiefer
1
, Frank S Flack
1
,
Donald E Savage
1
and Max G Lagally
1*
Abstract
Because of the large surface-to-volume ratio, the conductivity of semiconductor nanostructures is very sensitive to
surface chemical and structural conditions. Two surface modifications, vacuum hydrogenation (VH) and hydrofluoric
acid (HF) cleaning, of silicon nanomembranes (SiNMs) that nominally have the same effect, the hydrogen
termination of the surface, are compared. The sheet resistance of the SiNMs, measured by the van der Pauw
method, shows that HF etching produces at least an order of magnitude larger drop in sheet resistance than that
caused by VH treatment, relative to the very high sheet resistance of samples terminated with native oxide. Re-
oxidation rates after these treatments also differ. X-ray photoelectron spectroscopy measurements are consistent
with the electrical-conductivity results. We pinpoint the likely cause of the differences.
PACS: 73.63 b, 62.23.Kn, 73.40.Ty
Introduction
Semiconductor nanomembranes (NMs), ultrathin layers
of single-crystal semiconductor, can, because of the high
surface-to-volume ratio, have elec tronic transport prop-
erties that are extremely sensitive to surface and inter-
face conditions [1-3]. This surface sensitivity has a
potential, so far not fully realized, for diverse applica-
tions, among others biological and chemical sensors
[4-6], chemically gated transistors, or light-gated
switches [7]. This sensitivity highlights the need for a
greater understanding of the influence of chemical
modifiers, even quite mundane ones, on the near-surface
electronic properties and thus the charge transport
properties of the semiconductor.
We consider here a model system, silicon nanomem-
branes (SiNMs). SiNMs can be either freestanding or
bonded to a host substrate. In the simplest form, they
are bonded to a SiO
2
layer on a bulk Si substrate, so-
called silicon on insulator (SOI). Very thin SiNMs under
ambient condi tions, i.e., terminat ed with oxide on all
sides, are highly resistive because interface states trap
most of the free charges. Consider, for example, a 10-
nm thick crystalline sheet of Si with a nominal doping
density of 10
15
cm
-3
.Thesheetdensityofdopantsin
this thin membrane (10
9
cm
-2
) is much less than the
typical trap density of even a high-quality Si/SiO
2
inter-
face (10
11
cm
-2
eV
-1
); thus, carrier depletion due to
interface charge trapping renders the membrane effec-
tively intrinsic. Consequently, any surface modification
that significantly alters the trap density or provides free
carriers by some other means (suc h as transf er doping
via clean-surface states [2]) has a profound impact on
the conductivity.
As an example of the extreme sensitivity of the con-
ductivity of SiNMs to surface chemical condition, we
describe in this paper t he replacement of the surface
oxide with a hydrogen termination [1,6,8-11] in two
different ways. In one case, H-terminated SiNMs are
prepared using surfaces cleaned in ultrahigh vacuum
(UHV)thataredosedwithpurehydrogen.Theother
approach uses the conventional HF wet etching of
the oxide, which leaves the surfa ce “ H-terminated” .
Ele ctrical transport properties are measured via the van
der Pauw method in dry air (relative humidity <5%) and
correlated with the surface chemical condition, deter-
mined from X-ray photoelectron spectroscopy (XPS).
As suggested by prior work, the two treatments produce
different surface chemistry [12-16]. The transport data
demonstrate an extreme sensitivity of the conductivity to
even trace surface chemical differences, a phenomenon
* Correspondence:
1
University of Wisconsin-Madison, Madison WI 53706, USA
Full list of author information is available at the end of the article
Zhao et al. Nanoscale Research Letters 2011, 6:402
/>© 2011 Zhao et al; licensee Springer. This is an Open Access article distributed under the terms of the Creative Commons Attribution
License ( which permits unrestricted use, distribution, and reproduction in any medium,
provided the original work is properly cited.
totally absent i n the bulk. The data lead us a step closer
to an atomistic understanding of the complicated
problem of the influence of surfaces on charge t ransport
in semiconductor nanosystems.
Background
The influence of the surface condition on silicon nano-
membrane conductivity has been dramatically illustrated
with scanning tunneling microscopy (STM) on Si(001).
STM on clean bulk Si(001) produces high-quality
images. Several attempts were made to image the sur-
face of thin SOI(001) with STM, without success
[17,18]. Considering the above estimate of charge carrier
density when interface states are present, STM should
not, in fact, be possible because STM requires a reason-
ably conducting sample. When the Si surface is carefully
cleaned in ultrahigh vacuum (UHV), however, revealing
the signature Si(001) 2 × 1 reconstruction and its asso-
ciated surface state bands, STM images can be readily
obtained with a quality similar to that of bulk samples.
When the sample is not so c arefully cleaned, a nd the 2
× 1 reconstruction is weak or absent, imaging is not
possible. The me chanism for conduction for the clean,
reconstructed surface is ascribed to an interaction
between the surface bands produced by the 2 × 1 recon-
struction and the “ bulk bands” in the membrane. A
thermally activated charge transfer between the b ulk
and surface bands, called “surface transfer doping,” pro-
duces enough carriers to create high conductivity [3].
If the clean-surface bands are disrupted, the STM
image quality rapidly degrades. So it is conjectured that
incomplete removal of the oxide in UHV (oxide removal
without destroying the template Si layer is quite a
difficult problem for SOI), or any other kind of surface
disorder, prevents formation of the 2 × 1 surface bands
[3]. Additionally, the STM image degrades quickly if the
clean surface of thin SOI (001) is exposed to H in UHV
[19], while bulk Si(001) continues to be easily imaged
[20]. Because the d imer-row-created surface band struc-
ture on clean Si is rapidly destroyed by H [19], the
mechanism for conduction in thin SiNMs is eliminated.
The observation of H dosing of t hin SOI(001) u nder
UHV conditions producing a rapid drop in STM image
quality(andthereforeapresumedlargereductionin
conductivity) is, however, in contrast to recent electrical
measurements of HF-treated membranes, which feature
adramaticincreaseinconductivity[1].Itiswell
known that HF etching of the oxide leaves a nominally
H-terminated Si(001)surface, but with some residual F
[12,13].
The STM measur ements are only an indirect measure
of conductivity; one can calculate for a given STM and
given operating conditions what the limits on sheet con-
ductance are to obtain a good image [2]. Whereas we
are not able to duplicate here the exact conditions in
UHV, because we at this stage cannot perform van der
Pauw measurements in UHV, we prepare the vacuum H
termination s amples in a manner that permits dosing a
nominally clean surface with clean H, as an intermediate
step to the ultimate. We perform ex situ sheet resistance
measurements and compare to H termination via HF
etching for the same membrane thicknesses and sheet
resistance measurement conditions.
Experimental
P-type SOI(001) samples with nominal doping levels of
10
15
cm
-3
were patterned into 4 × 4 mm squares using
photolithography and reactive-ion etching. Two different
thicknesses of Si template layers (220 and 28 nm) were
subjected to HF and vacuum H-dosing (VH) treatments.
The choice of thicknesses i s dictated by the earlier reali-
zation that 220 nm SiNMs behave close to bulk, while
28 nm SiMNs exhibit great surface sensitivity because
the total dopant number is an order of magnitude smal-
ler. The 28-nm samples were prepared with cycles of
thermal oxidation and buffered oxide et ching from the
220-nm commercial SOI wafers (Soitec, Peabody, MA,
USA). From X-ray diffraction measurements of several
samples diced from the same region of a wafer after
thinning, we estimate that the thickness variation within
each sample is less than 1 nm and the surface
roughness, determined with atomic force microscopy, is
typically 0.3 nm [1]. For HF treatment, samples were
pre-cleaned with acetone and isopropyl alcohol, followed
by a deionized (DI) water rinse, then dipped into 49%
HF solution for 1 min, followed by a 1-min DI water
rinse, and finally dried with flowing N
2
.FortheVH
treatment, samples were cleaned with Piranha (H
2
SO
4
+
H
2
O
2
), AHP (H
2
O+NH
4
OH + H
2
O
2
),anddippedin
10% HF immediately prior to loading into the vacuum
chamber. Once under vacuum (10
-9
torr), the sample
was flash heated to 900°C to remove the ex situ H
termination and obtain the 2 × 1 reconstruction (as
determined by reflection high-energy electron diffrac-
tion). Silane in a H
2
carrier gas was then flowed across
the sample for 30 s while it was maintained at 580°C
and for an additional 2 min after turning off the heat
source. It is known that this procedure produces a
H-terminated surface [21], and indeed, the samples were
hydrophobic after removing from vacuum.
Indium point contacts were soldered to the sample
immediately after terminating with hydrogen in both
preparations. The sheet resistances were measured by
the van der Pauw method [22] with a semiconductor
parameter analyzer (Agilent 4156C, Agilent Technolo-
gies, Palo Alto, CA, USA) in dry air (relative humidity,
RH < 5%) to restrict the influence of humidity because
water vapor plays an important role in the conductivity
Zhao et al. Nanoscale Research Letters 2011, 6:402
/>Page 2 of 7
of low-doped thin SOI [8]. The first sheet resistance
measurement was always performed within 20 min of
forming the H termination.
XPS measurements were performed with a PHI 5400
ESCA system (Physical Electronics, Division of Ulvac-
PHI Chanhassen, MN USA) using Mg Ka X rays (1,254
eV). A larger take-off angle (45°) was chosen for survey
spectra to obtain a stronger overall signal. A smaller
take-off angle (15°), which brings more information
from the surface, was selected for high-energy-resolution
spectra to observe the change of the Si 2p core level
peak in SiO
2
to reveal the oxidation rate.
Results and discussion
As mentioned above, the NM thicknesses chosen for
these measurements provide total dopant sheet charge
densities differing by about one order of magnitude for
the same bulk dopant concentration. The thicker mem-
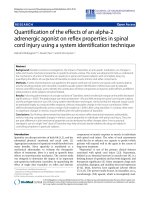
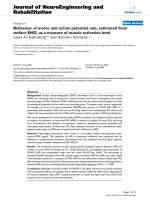
brane should thus have lower resistance. Figure 1 shows
a summary of the evolution of sheet resistance with
time. The gray bar on top of each panel is the range of
sheet resistance measured for the NM with an oxidized
surface; no time dependence is measured nor expected.
For oxide termination, the sheet resistance for the thin-
ner NM is much higher, as predicted.
Figure 1a shows the evolution of the sheet resistance
of 220-nm Si membranes in dry air for the two surface
modifications. The data points are averages of several
samples. The first data points were measured no more
than 20 min after the surface modifications, as
mentioned above. The HF treatment reduces the sheet
resistance by more than two orders of magnitude com-
pared to samples with the n ative-oxide termination
(gray band). The sheet resistance increases slowly with
time as the surface oxidizes gradually to form electrically
active interface traps that deplete free carriers. This
behavior is consistent with the results in Ref [1].
Figure 1a also shows that the behavior of the sheet
resistance after treating with pure hydrogen under
vacuum (VH) is quite different from the HF-treated
case. The sheet resistance rapidly reaches a value only
slightly below the sheet resistance of samples with a
native-oxide surface. At early times, the sheet resistance
may be as much as an order of magnitude lower than
the oxide-termination values, but these measurements
are less reliable. Such changes in conductivity would not
be observable with bulk samples because the surface-to-
volume ratio is much smaller for bulk samples, and the
conducting paths through the bulk would drown out
any changes due to surface modification.
Although the conductiv ity of SiNMs is increased,
relative to the oxide termination, for both H surface
modifications, the differences observed for the two sug-
gest structurally or chemicall y different surfaces. In fact,
HF treatment results in a sheet resistance even lower
than the value calculated for a NM with bulk doping
(10
15
cm
-3
) in the complete absence of interface traps,
as has been shown earlier [3]. It has been suggested that
Figure 1 The evolution of sheet resistance with time of Si nanomembranes in dry air. After two surface modifications, VH and HF etching.
(a) 220 nm. (b) 28 nm. The sheet resistance is lower for thicker NMs.
Zhao et al. Nanoscale Research Letters 2011, 6:402
/>Page 3 of 7
the cause is residual species such as F and OH [1] and
their chemical action with time [12,14,23].
Similar results are obtained for the 28-nm SiNMs, as
shown in Figure 1b. Comparison of Figure 1a,1b shows
that thinner Si membranes are more sensitive to the
surface modifications (a much higher sheet resistance
for the oxidized surface, as expected from discussions
earlier, and a dramatic drop in sheet resistance with H
termination). HF treatment causes about three orders of
magnitude d rop in the sheet resistance, while VH
treatment produces over two orders of magnitude drop,
relative to the oxidized NM surface. Interestingly, the
post-treatment values are not as different from each
other for the two NM thicknesses as are the values for
the oxidized surface. The implication is that both H
treatments reduce or eliminate the oxide-induced inter-
face states and instead introduce somewhat differing
states that do not trap as much charge.
Figure 1 also shows the initial evolution of the sheet
resistance with time in an ambient (dry air) environment
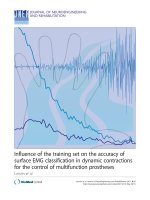
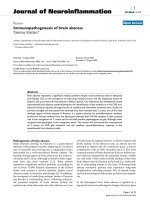
for both surface treatments. Figure 2 extends this time
to 6 days for the thinner membrane. The inset (similar
to Figure 1, but over a longer time) shows that for
approximately the first hour, the sheet resistance of
samples treated by VH increases faster than tha t of
samples treated with HF, although the data in this regime
are likely to be less reliable than for longer times. The
sheet resistance of the HF-treated samples then increases
more rapidly, crossing the sheet resistance of the
VH-treated samples at approxim ately 8 h of exposure,
after which time, the HF-treated samples become more
resistive than those with the VH termination.
It is known that after dosing with hydrogen under
vacuum, the surface is purely H-t erminated [16,21],
while after HF treatment and DI water rinse, th e surface
is H-terminated with trace amounts of OH and F
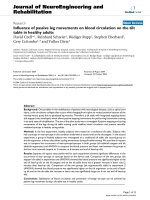
[12,14,23]. Figure 3 shows XPS spectra of 220-nm
SiNMs treated by the two surface modifications after
20-min exposure to air. The samples treated with HF
show a F 1s core level peak, confirming that the HF
treatment leaves F ions on the surface [14], a feature
that is absent in the VH-terminated sample. Comparison
of the O1s peak for the H-terminated samples with the
O1s peak from the sample with a native oxide confirms
that the native oxide was removed after both H surface
modifications.
It is attractive to regard the change in sheet resistance in
terms of re-oxidation of the surface, i.e., the re-formation
Figure 2 Sheet resistance of 28-nm-thick Si membranes as a function of time. After VH and HF treatments (linear scales). The inset shows
the sheet resistance (log scale) for the first 16 h after treatment, showing the crossover point in sheet resistances.
Zhao et al. Nanoscale Research Letters 2011, 6:402
/>Page 4 of 7
of oxide interface states from the condition of the surface
produced by H termination. The simplest situation for the
H-terminated surface would be complete passivation of
surface states by H (including the “ poisoning” of the
clean-surface bands produced by the 2 × 1 reconstruction)
[2,3]. If one adopts this model, then the evolution of sheet
resistance plots the re-oxidation rate, and differences in
re-oxidation rates of the NMs can be very sensitively
inferred from the change of sheet resistance. There will
then be a crossover point at 8 h where the degrees of oxi-
dation of the two surface terminations switch. The VH
termination appears then to be much more resistive to re-
oxidation, i.e., it provides a much better surface chemical
passivation than HF etching.
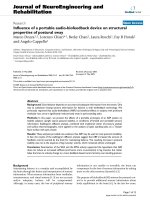
There is XPS support for this conclusion. Figure 4
shows the Si 2p core level peak and corresponding
chemically shifted peak due to presence of oxide as a
function of exposure time in air. It is clear that with a
2-h exposure to air, the Si 2p core level peak in SiO
2
of
the sample treated by VH is stronger than that of sam-
ple treated by HF, indica ting that the VH-terminated
sample has a higher oxidation rate at the beginning. As
the samples continue to oxidize, the magnitudes of the
chemically shifted Si 2p core level peaks for each sample
type become closer and eventually reach a similar peak
height after an 8-h exposure to air. As oxidation con-
tinues past 1 day, the peak for the H F-treated sample
becomes stronger than that for VH-treated sample and
continues to increase over the 18 days of measurements,
almost reaching the level of the sample with a native-
oxide surface. Comparison of O1s peaks confirms
increasing oxidation, relative to the initial stages
(Figure 3), but at different rates, as predicted from the
sheet resistance data. These observations are in excellent
agreement with the results of the electrical measure-
mentsshowninFigures1and2.Fromtheinsetin
Figure 2, it is clear that within 1 day after surface modifi-
cation, the sheet resistances of both sample types reach a
similar value of around 3 × 10
7
ohms/square.
There is, howev er, a caution. Low-doped (10
15
cm
-3
)
p-type SiNMs with thicknesses of 220 n m or less show
inversion of carrier type from p to n, even before any
H termination treatments [10]. The conductivity that is
measured is due to electrons, even though the material
is nominally p-type [1]. This behavior can be due to
trapped charges at the i nterfaces, whose effect becomes
noticeable only for thin sheets, where the total number
of bulk dopants is low. The sheet resistance returns to
the initial (with native oxide) value within 30 days.
Figure 5 shows XPS spectra after 30 days exposure to air.
The small F 1s core level peak seen in Figure 3 can still
be observed after a month of oxidation. The implication
is that the trace surface F does not influence the ultimate
sheet resistance. It is clear that the surface terminations
Figure 3 XPS spectra of samples treated by the two surface modifications after 20-min exposure to air. Take-off angle is 45°, pass energy
is 89.45 eV. The unlabeled peak is the O Auger line.
Zhao et al. Nanoscale Research Letters 2011, 6:402
/>Page 5 of 7
with HF and vacuum hydrogenation differ and that the
passivation induced by HF is much less effective t han
that induced by clean-H exposure of a vacuum-cleaned
surface, but it appears that presence of F does not ulti-
mately play the decisive role in the re-oxidation kinetics.
Conclusions
Semiconductor nanomembranes offer an excellent plat-
form to investigate small changes in surface chemical
and structural differences, if appropriate electronic
transport measurements are made. The reason is that
the density of mobile charge in thin sheets or ribbons,
and all Si nanowires, is so low at conventional doping
levels that any small modification in the c harge density,
no matter from what source, significantly influences the
conductivity. Such changes in conductivity would not be
observable with bulk samples because the surface-to-
volume ratio is much smaller for bulk samples and the
conducting paths through the bulk would overwhelm
any changes due to surface modification. Especially the
oxidized surface, because of interface states, has a very
high resistivity at conventional doping levels, and for
that reason, studies employing Si nanowires invariably
use close to degeneratively doped material.
To demonstrate this surface sensitivity, we investi-
gated two surface modifications on thin SiNMs that are
nominally identical but differ in trace amounts of
adsorbed species, H termination via HF etching and H
termination via exposure of a clean surface to H in an
UHV system. The difference in these surfaces appears to
be a trace adsorption of F, although we cannot be sure
that H occupies the same surface sites in both
oxidizedsurfac
e
Figure 4 Si 2p XPS core level peaks for Si and SiO
2
.Asa
function of exposure time in air: red solid lines, blue dashed lines,
and black dotted line correspond to samples treated by VH, HF, and
with native-oxide surface, respectively. Take-off angle is 15°, pass
energy is 35.75 eV. The top curve has been shifted by
approximately 0.4 eV to facilitate comparison with the other curves.
This shift is presumably due to surface charging.
Figure 5 XPS spectra of 220-nm SiNMs after 30 days exposure to air, compared to oxidized surface. The F peak persists in the HF-treated
SiNM. Take-off angle is 45°, pass energy is 89.45 eV.
Zhao et al. Nanoscale Research Letters 2011, 6:402
/>Page 6 of 7
situations. The results confirm the extreme sensitivity of
the conductance of thin semiconductor sheets to chemi-
cal changes and demonstrate how thinness plays a role.
In addi tion, we investigated the oxidation rate via sheet
resistance measurements as a function of time. Within
the assumption that oxide-produced interface states
replace the H passivation, the sheet resistance sensitively
tracks the coverage of oxygen on the surface, to the
extent that one observes up to four orders of magnitude
change in sheet resistance (depending on NM thickness,
NM bulk doping, and nature of the surface modifica-
tion) for the replacement of one monolayer of atoms. It
is expected that this sensitivity can be exploited in
future sensor applications using nanomembranes. It is
also clear that nanomembranes provide an excellent
vehicle for investigating interface states and defects that
control the conductivity. In particular, electrical mea-
surements in UHV (currently underway) will enable a
more detailed understanding of the mechanisms of
transport modulation via surface and interface modifica-
tion in very thin semiconductors. That field of inquiry is
still in its very early stages.
Acknowledgements
This work was supported by DOE, grant no. DE-FG02-03ER46028. XFZ was
supported by the China Scholarship Council (CSC). Facilities support from
NSF/MRSEC is acknowledged.
Author details
1
University of Wisconsin-Madison, Madison WI 53706, USA
2
School of
Electronic Science and Engineering, Nanjing University, Nanjing 210093,
China
Authors’ contributions
XFZ made the measurements, with assistance from WP, SAS, AMK, and FSF.
XFZ, SAS, WP, and MHH fabricated samples. All authors contributed to
setting directions for the research and to discussions of the results and the
manuscript. XFZ, SAS, and MGL participated in the preparation of the
manuscript.
Competing interests
The authors declare that they have no competing interests.
Received: 9 March 2011 Accepted: 31 May 2011 Published: 31 May 2011
References
1. Scott SA, Peng WN, Kiefer AM, Jiang HQ, Knezevic I, Savage DE,
Eriksson MA, Lagally MG: Influence of surface chemical modification on
charge transport properties in ultrathin silicon membranes. ACS Nano
1999, 3:1683-1692.
2. Zhang PP, Tevaarwerk E, Park BN, Savage DE, Celler GK, Knezevic I,
Evans PG, Eriksson MA, Lagally MG: Electronic transport in nanometer-
scale silicon-on-insulator membranes. Nature 2006, 439:703-706.
3. Zhang PP, Nordberg E, Park BN, Knezevic I, Evans PG, Eriksson MA,
Lagally MG: Electrical conductivity in silicon nanomembranes. N J Phys
2006, 8:200.
4. Cui Y, Wei Q, Park H, Lieber CM: Nanowire nanosensors for highly
sensitive and selective detection of biological and chemical species.
Science 2001, 293:1289-1292.
5. Nikolaides MG, Rauschenbach S, Bausch AR: Characterization of a silicon-
on-insulator based thin film resistor in electrolyte solutions for sensor
applications. J Appl Phys 2004, 95:3811-3815.
6. Ha S: Electrical properties of surface-modified silicon membranes. PhD
thesis University of Wisconsin-Madison, Physics; 2008.
7. Werner R, Zimmermann C, Kalz A: Light dependence of partially depleted
SOI-MOSFETs using SIMOX substrates. IEEE Trans Electron Devices 1995,
42:1653-1656.
8. Dubey G, Lopinski GP, Rosei F: Influence of physisorbed water on the
conductivity of hydrogen terminated silicon-on-insulator surfaces. Appl
Phys Lett 2007, 91:232111.
9. Watanabe D, En A, Nakamura S, Suhara M, Okumura T: Anomalously large
band-bending for HF-treated p-Si surfaces. Appl Surf Sci 2003, 216:24-29.
10. Schlaf R, Hinogami R, Fujitani M, Yae S, Nakato Y: Fermi level pinning on
HF etched silicon surfaces investigated by photoelectron spectroscopy. J
Vac Sci Technol A 1999, 17:164-169.
11. Angermann H, Henrion W, Rebien M, Röseler A: Wet-chemical preparation
and spectroscopic characterization of Si interfaces. Appl Surf Sci 2004,
235:322-339.
12. Takahagi T, Ishitani A, Kuroda H, Nagasawa Y: Fluorine-containing species
on the hydrofluoric acid etched silicon single-crystal surface. J Appl Phys
1991, 69:803-807.
13. Lee CH, Ritz CS, Huang MH, Ziwisky M, Blise R, Lagally MG: Wafer-scale
integrated freestanding single-crystal silicon nanowires: conductivity and
surface treatment. Nanotechnology 2011, 22:055704-055710.
14. Gräf M, Grundner M, Schulz R: Reactions of water with hydrofluoric acid
treated silicon (111) and (100) surfaces. J Vac Sci Technol A 1989,
7:808-813.
15. Grundner M, Schulz R: The surface state of Si (100) and (111) wafers after
treatment with hydrofluoric acid. AIP Conf Proc 1987, 167:329-337.
16. Takahagi T, Ishitani A, Kuroda H, Nagasawa Y, Ito T, Wakao S: Fluorine-
containing species on the hydrofluoric acid etched silicon single-crystal
surface. J Appl Phys 1990, 68:2187-2191.
17. Lin KC, Holland OW, Feldman LC, Weitering HH: Surface characterization
of silicon on insulator material. Appl Phys Lett 1998, 72:2313-2315.
18. Sutter P, Ernst W, Sutter E: Scanning tunneling microscopy on ultrathin
silicon on insulator (100). Appl Phys Lett 2004, 85:3148-3150.
19. Zhang PP: Structure and electronic properties of nanometer-scale silicon
membranes in silicon-on-insulator. PhD thesis University of Wisconsin-
Madison, Physics; 2006.
20. Boland JJ: Structure of the H-saturated Si(001) surface. Phys Rev Lett 1990,
65:3325-3328.
21. Liehr M, Greenlief CM, Offenberg M, Kasi SR: Equilibrium surface hydrogen
coverage during silicon epitaxy using SiH4. J Vac Sci & Technol A 1990,
8:2960-2964.
22. van der Pauw LJ: A method of measuring specific resistivity and Hall
effect of discs of arbitrary shape. Philips Res Repts 1958, 13:1-9.
23. Ling L, Kuwabara S, Abe T, Shimura F: Multiple internal reflection infrared
spectroscopy of silicon surface structure and oxidation process at room
temperature. J Appl Phys 1993, 73:3018-3022.
doi:10.1186/1556-276X-6-402
Cite this article as: Zhao et al.: Influence of surface properties on the
electrical conductivity of silicon nanomembranes. Nanoscale Research
Letters 2011 6:402.
Submit your manuscript to a
journal and benefi t from:
7 Convenient online submission
7 Rigorous peer review
7 Immediate publication on acceptance
7 Open access: articles freely available online
7 High visibility within the fi eld
7 Retaining the copyright to your article
Submit your next manuscript at 7 springeropen.com
Zhao et al. Nanoscale Research Letters 2011, 6:402
/>Page 7 of 7