Báo cáo hóa học: "Experimental stability analysis of different waterbased nanofluids'''' doc
Bạn đang xem bản rút gọn của tài liệu. Xem và tải ngay bản đầy đủ của tài liệu tại đây (704.27 KB, 8 trang )
NANO EXPRESS Open Access
Experimental stability analysis of different water-
based nanofluids
Laura Fedele
1
, Laura Colla
1
, Sergio Bobbo
1*
, Simona Barison
2
and Filippo Agresti
2
Abstract
In the recent years, great interest has been devoted to the unique properties of nanofluids. The dispersion process
and the nanoparticle suspension stability have been found to be critical points in the development of these new
fluids. For this reason, an experimental study on the stability of water-based dispersions containing different
nanoparticles, i.e. single wall carbon nanohorns (SWCNHs), titanium dioxide (TiO
2
) and copper oxide (CuO), has
been developed in this study. The aim of this study is to provide stable nanofluids for selecting suitable fluids with
enhanced thermal characteristics. Different dispersion techniques were considered in this study, including
sonication, ball milling and high-pressure homogenization. Both the dispersion process and the use of some
dispersants were investigated as a function of the nanoparticle concentration. The high-pressure homogenization
was found to be the best method, and the addition of n-dodecyl sulphate and polyethylene glycol as dispersants,
respectively in SWCNHs-water and TiO
2
-water nanofluids, improved the nanofluid stability.
Introduction
Nanofluids are a new family of fluids, prepared by dis-
persing nanoparticles, i.e. particles of nanometric dimen-
sions, in common fluids, such as water, o ils or glycols.
In general, the employed particles are metals, metal oxi-
des or carbon, in different allotropic forms.
The first nanofluids were studied by Choi and East-
man in 1995 [1], to exploit their potentialities, in parti-
cular, for heat conduction applications, but until now
the studies have not delved into the behaviour of these
fluids. With regard to thermal engineering applications,
several articles have been published showing a consider-
able increase of the heat transfer coefficient relative to
the base fluids, due to the high thermal conductivity of
the solid nanoparticles. Enhancements of up to 60% in
the thermal conductivity of water-based nanofluids as
per several studies were found in the literature [2,3].
Moreover, unlike the micrometric suspensions, the se
fluids can potentially keep a good stability over a long
time, since nanoparticle aggregation and settling can be
avoided. However, in fact, these two phenomena are not
easytobecontrolled,andtheyrequirethestudyofthe
correct combination of different variables [4]. In
particular, nanoparticles often aggregate, i.e. they mix
together creating clusters, because of forces of different
nature, which interact amongst particles, leading to the
settling down of aggregat es. These two phenomena may
occur independently or can be interlinked. Anyway, they
involve a reduction of stability of the nanofluids and,
consequently, a poor reproducibility of fluid properties.
Different experimental studies and models have been
proposed to study the stability of nanofluids (e.g. [5-7])
basing on different techniques for the analysis of the
stability, such as dynamic light scattering (DLS) and
spectrophotometry, and considering different variables,
such as nanoparticle concentration, Z P otential, pH and
preparation method. It is also impo rtant to realize mod-
els that are able to evaluate nanoparticle aggregation
and sedimentation characteristics in nanofluids.
Amongstothers,themostusedmodelsforthesimula-
tion of the nanoparticle behaviour within the fluid are
the diffusion limited aggregation model which can be
used only to describe nanoparticle aggregation [5]; the
Brownian dynamics model which can b e used only to
describe nanoparticle sedimentation [5]; and the fractal
model [8-10].
Considering the rather high discrepancy found in the
published data regarding nanofluids due to the low sta-
bility of suspensions, the aim of this study is to provide
successive stable fluids investigation of successively
* Correspondence:
1
Consiglio Nazionale delle Ricerche, Istituto per le Tecnologie della
Costruzione, Corso Stati Uniti, I-35127 Padova, Italy
Full list of author information is available at the end of the article
Fedele et al. Nanoscale Research Letters 2011, 6:300
/>© 2011 Fedele et al; licensee Springer. This is an Open Access article distributed under the terms of the Creative Commons Attribution
License ( which pe rmits unrestricted use, distribution, and reproduction in any medium,
provided the original work is properly cited.
investigated as potential thermal vectors i n thermal
applications. New systematic data have been established,
concerning the effects of different preparation methods,
nanoparticle concentrations and dispersants on the sta-
bility of water-based nanofluids, obtained by dispersing
titanium dioxide (TiO
2
), single wall carbon nanohorn
(SWCNH) and copper oxide (CuO) nanoparticles. Up to
now, several studies have been made on these three
kinds of nanofluids, but the results are often discordant.
The selection of a proper preparation method is essen-
tial to prevent the aggregation and sedimentation phe-
nomena, strongly influencing the stability of the
nanofluids and their thermophy sical properties. For this
reason, three different pr eparation techniques were con-
sidered, i.e. sonication, ball milling and high-pressure
homogenization. Furthermore, in order to optimize the
stability of the fluids, different dispersants were tested.
After careful analysis of the time of the average dimen-
sion of the suspended nanoparticles by means of a DLS
apparatus, Zeta potential measurements and visual
observation of the suspensions, sodium n-dodecyl sul-
phate ( SDS) and polyet hylene glycol (PEG) were chosen
as dispersants for the nanofluids based on SWCNHs
and TiO
2
, respectively.
Experimental
Materials
Deionized water (Millipore, Billerica MA, USA, 18.2
MΩ) was used as base fluid.
The TiO
2
nanoparticles used for the dispersions were
purchased from Degussa (TiO
2
,P25),withaspherical
shape and a declared 21-nm diameter.
The S WCNHs were supplied by Carbonium Srl with
an estimated equivalent diameter of 100 nm.
CuO was purchased from Alfa Aesar with the indi-
cated mean size being 30-50 nm.
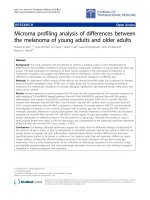
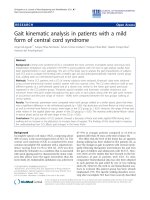
The morphological characterization of nanoparticles
was performed by field emission scanning electron
microscopy (FE-SEM) using a SIGMA Zeiss instrument
(Carl Zeiss SMT Ltd., UK).
SEM images of C uO, TiO
2
and S WCNHs are shown
in Figure 1.
As dispersants, SDS (99%, Alfa Aesar), PEG 600 (Alfa
Aesar), hydrochloric acid (37%, Carlo Erba) and citric
acid (≥99.5%, Fluka) were te sted to improve the stability
of suspensions.
All the nanofluids studied in this article are su mmar-
ized in Table 1, which shows the type of nanoparticle,
the dispersant and the weight concentration.
Nanofluids preparation methods
Thenanofluidswerepreparedbydispersingthenano-
particles in water by a two-step method. Three
preparation techniques were compared regarding the
final stability of dispersions:
• the sonication, performed at 130 W and 20 kHz
for 1 h (the best solution a mongst different tested
sonication times) using an ultrasonic processor
(VCX130, Sonics);
• the ball milling, carried out at 300 rpm for 2 h
using a planetary b all mill (Pulverisette 7, Fritsch),
using WC grinding bowls and 0.5-cm-diameter balls.
• the homogenization, achieved at 1000 bar using a
high pressure homogenizer (GEA) with 30 passes.
Particle size measurements
In order to evaluate the tendency of nanoparticles to
aggregate an d eventually sedimentate, the nanoparticle
size distribution in the fluid over time was selected as
control parameter. A Zetasizer Nano ZS (Malvern) was
used for measuring the average dimension of the nano-
particles in solution. This instrument can detect the size
from 0.6 nm to 6 μm using a DLS process. The cell is
illuminated by a laser, and the particles scatter the light
which is measured using a detector. The particles in a
liquid move ab out randomly, and their speeds of move-
ment are used for determining the size of the particle.
An important feature of the Brownian motion is that
small particles move quickly and large particles move
slowly . There ar e correspondences between the size of a
particle and its speed due to Brownian motion, as
shown by the Stokes-Einstein equation. On the base of
this physical behaviour, the Zetasizer Nano ZS measures
the Brownian motion of the part icles i n the sample and
relatesthistoasizebased on established theories
[11,12].
The particle size measured in a DLS instrument is the
diameter of the ideal sphere that diffuses at the same
rate of the particle being measured. All the size mea-
surements were performed at 25°C with a scattering
angle of 173°. The DLS measurements provide the size
distribution using a correlation which can separate three
different populations existing in the sample, showing
one peak for each populat ion. If by a measurement only
one peak is found, then it means that a large majority of
the particles have a diameter around the common aver-
age value.
After the nanofluids’ preparation, two samples of each
fluid listed in Table 1 were placed in two different mea-
surement cuvettes. The first sample was measured
almost every day for 30 days without shaking the fluid,
to evaluate the size distribution changes due to natural
sedimentation. The second sample was measured almost
every day for 30 days after shaking the fluid, to evalua te
Fedele et al. Nanoscale Research Letters 2011, 6:300
/>Page 2 of 8
the size distribution changes after mechanically recover-
ing the settled particles. Each test using the Zetasizer
was repeated three times, and the results shown
here are the mean values of the three measurements.
The measurement was always made at a constant height
from the base of the cuvette. At this specific height, an
average diameter was measured. For the unstable nano-
fluids, the diameter of the nanoparticles in the unshaken
fluid decreases day after day, because of the precipita-
tion of the bigger particles.
However, e ven without sedimentation, if a change in
nanoparticles size occurs, indicating a nanoparticle’s
aggregation, then it affects the thermophysical properties
of the nanofluid.
Zeta potential measurements
Another important parameter to consider to get informa-
tion on the stability of the nanofluid is the Zeta potential.
In a colloidal suspension, the Zeta potential is the electric
potential existing between the particle surface and the dis-
persing liquid at the slipping plane. The Zeta potential of
nanoparticles was measured using the Zetasizer Nano
(Malvern), too. This instrument uses a combination of
two-measurement techniques, i.e. electrophoresis and
laser Doppler velocimetry. This combination method mea-
sures the velocity of a particle in a liquid when an electri-
cal field is applied. Then, Henry equation can be applied,
knowing the viscosity and the dielectric constant of the
sample. The Smoluchowski equation is used for obtaining
the Zeta potential from the measured mobility for the par-
ticles in aqueous media (for high ionic strengths).
pH measurements
Since it is known that the p H of a colloidal solution is
one of the main parameters influencing the particle
aggregation and the stability of the suspension, the pH
of each nanofluid here considered has been measured
using a pocket-sized pH meter with replaceable elec-
trode (HANNA Instruments provided by Vetrotecnica,
Padova, Italy).
100 nm
(a)
(b)
(c)
Figure 1 SEM images of nanoparticles.(a)CuO,(b)TiO
2
and (c)
SWCNH nanoparticles.
Table 1 Water based nanofluids considered in the
present work
Nanoparticles Dispersant
wt.% Compound wt.%
CuO 0.1
TiO
2
0.1
0.01 citric acid 0.01
0.1
0.1 hydrochloric acid
0.01 PEG 0.02
0.1 0.2
12
SWCNHs 0.1
0.01 SDS 0.01
0.01 0.03
0.1 0.1
11
Fedele et al. Nanoscale Research Letters 2011, 6:300
/>Page 3 of 8
Results and discussion
In order to obtain a stable nan ofluid, several water-
based nanofluids were analysed and various parameters
were investigated : different preparation methods, various
kinds o f dispersants varying both the concentration of
the nanoparticles and of the dispersants. As already
described, for each nanofluid, the mean size value was
obtained, repeating the measurements almost every day
for 30 days, both for the nanofluid stored in static mode
and for the same nanofluid after mechanical shaking.
Moreover, the Zeta potential measurements and the sus-
pensions visual observation were used f or analysing the
nanofluid’s stability.
Comparison between different dispersion techniques
Initially, some tests on 0.1 wt.% solutions of TiO
2
,CuO
and SWCNHs in w ater were performed, comparing the
three different dispersion techniques without
dispersants.
Ball milling method
Table 2 shows nanoparticles’ mean diameters a t differ-
ent days from their dispersions by different methods.
Only 2 days are presented for the ball milling because,
only after 4 days for TiO
2
nanofluids, the nanoparticles
got completely precipitated.
The mean particle size obtained by ball milling was
over the nanometric range (day 1). These nanofluids
turned out to be unstable. In fact, from the first to the
last day of measurement, the mean diameter decreased
since at the constant height from the base of the cell,
where the average diameter was measured, only t he
smaller particles remained in suspension and therefore
could be detected, while the bigger ones got precipitated
at the bottom of the cell. After 14 and 4 days, respec-
tively, for CuO a nd TiO
2
nanofluids, the nanoparticles,
as highlighted by visual inspection, got completely preci-
pitated and the concentration of th e particles in suspen-
sion was too low to allow the measurements using the
nanosizer.
Moreover, the Zeta potential was around +10 mV for
CuO-water nanofluid and around 0 mV for TiO
2
-water
nanofluid. These low values are typical of unstable
solutions.
Considering the poor results obtained f or the suspen-
sions prepared by the ball milling process, this method
was no longer tested, and other techniques were preferred.
Sonication method
The mean diameter of CuO, TiO
2
and SWCNH nano-
particles dispersed in water by sonication method are
presented in Table 2, at days 1, 4 and 15. This method
proved to be more effective than the ball milling method
in reducing aggregates. However, in terms of stability,
for CuO nanopart icles, t he results are similar to those
obtained by ball milling method, since they could not be
measured after 15 days, because of particle precipitation,
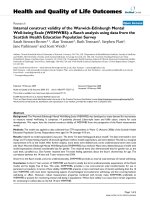
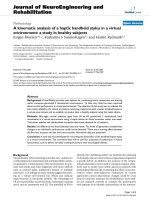
as highlighted by vis ual observation. Also in TiO
2
-water
nanofluid, a precipitation occurred, even if being slower
than with ball milling, as shown in Figure 2 which pre-
sents the nanoparticles ’ size distributions for water con-
taining TiO
2
at days 1, 4 and 15.
In SWCNHs-water nanofluid, a stable population with
a 100-nm ave rage diameter was observed, although with
the presence of larger particles, with a mean diameter of
approximately 4 μm, according to DLS measurements,
which disappeared after 24 days, probably because of
settling down.
The measured Zeta potentials were approximately +10,
+50and+35mVforCuO,TiO
2
and SWCNHs water-
based nanofluids, respectively. Owing to the strong opacity
of the SWCNHs nanofluid, it was necessary to dilute that
suspension to perform the Zeta potential measurements.
Considering the strong instability of TiO
2
nanoparticles,
the value obtained is in disagreement with the empirical
limit of |30| mV, over which a nanofluid should remain
stable.
Table 2 Nanoparticles mean diameters at three different
days from their preparation by three different methods,
by DLS measurements on static sample
Day from
preparation
Diameter
peak 1 (nm)
Diameter
peak 2 (nm)
Diameter
peak 3 (nm)
Ball milling method
CuO 1 1843 5560
4 342
TiO
2
1 1281
4 532
Sonication method
CuO 1 452 4923
4 197
15 405 1407 5560
TiO
2
1 173
4 154
15 95
SWCNH 1 151 4830
4 169 4526
15 147 4370
Homogenization method
CuO 1 1248 4968
5 280
TiO
2
1 196 4936
5 141
15 117
SWCNH 1 107
5 132 4714
15 169 4701
All the nanofluid concentrations are 0.1 wt.%.
Fedele et al. Nanoscale Research Letters 2011, 6:300
/>Page 4 of 8
Homogenization method
The mean diameters of CuO, TiO
2
and SWCNH nano-
particles in water, dispersed by the homogenization
method, are presented in Table 2, which shows the dif-
ferences in them at days 1, 5 and 15 after preparation.
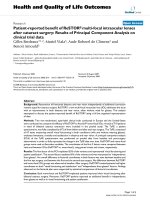
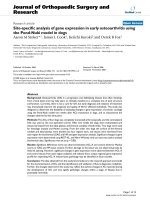
The CuO-based fluid shows aggregates having mean
diameters of 1 μm or more and precipitation in 8 days,
as highlighted also by the visual inspection (Figure 3).
In TiO
2
-water nanofluid, all the aggregates observed on
the first day precipitated after 21 days, as measured by
DLS, while the other nanoparticles tended to settle down.
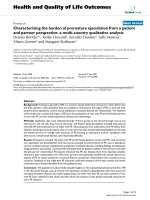
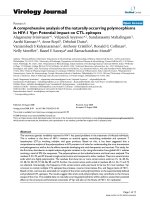
The SWCNHs nanofluid turned out to be qu ite stable.
In fact, the mean size measured by DLS the first day
was almost constant for 33 days, as shown by Figure 4.
However, from day 5, a micrometric aggregate was
found, indicating a partial instabili ty of the solution.
Moreover, the mean particle size in water was slightly
higher than the size measured in the powder.
TheZetapotentialsfortheCuOandTiO
2
nanofluids
were approximately +10 and +35 mV, respectively, while
for the SWCNHs-water nanofluid, it was not possible to
obtain a stable value, even after diluting the suspension.
Therefore, the homogenization process proved to be
the most effective method for preparing nanofluids.
However, these preliminary results pointed out that the
precipitation of the CuO nanoparticles was evident even
after a few days with any of the three analysed methods.
For this reason, this nanofluid was no longer investigated.
At this point, in order to improve the stability of TiO
2
and SWCNHs nanofluids, different dispersants were
tested.
Use of dispersants and acidification of the solutions
All the fluids discussed in this section were prepared
with the high-pre ssure homogenization method, consid-
ering its superiority over the other methods. Table 3
shows nanoparticles’ mean diameters and standard
deviations at different days from their dispersion.
TiO
2
-water nanofluids
Initially, two acidic solutions having pH 4-5 prepared
with citric acid or hydrochloric acid were tested for the
titanium dioxid e-water nanofluid. In view of the poten-
tial use of these nanofluids in,e.g.hydrauliccircuits,
lower pH val ues were n ot considered. H owever, these
acids were ineffective in producing stable suspensions at
these pH values, since the particle precipitation was
visually evident.
Therefore, a non-ionic dispersant, PEG 600, was inves-
tigated, based on [13]. Various concentrations of PEG
and TiO
2
were measured. The variation along time of
TiO
2
-PEG nanoparticle mean diameters, with TiO
2
at
0
2
4
6
8
10
12
14
16
18
0.1 1 10 100 1000 10000
Intensity (%)
Diameter (nm)
Figure 2 Nanoparticles size distribution for water containing
0.1 wt.% TiO
2
dispersed by means of the sonication method.
At (thick line) day 1, (dashed line) day 4 and (dashed-dotted line)
day 15.
Figure 3 The CuO-water nanofluid, showing precipitation just
after 8 days.
Fedele et al. Nanoscale Research Letters 2011, 6:300
/>Page 5 of 8
0.01, 0.1 and 1 wt.% and PEG at 0.02, 0.2 and 2 wt.%,
respectively, are shown in Figure 5.
The first nanofluid (at TiO
2
concentration of about
0.01 wt.%) became unstable, i.e. just after 5 days, an
aggregation occurred, and after 18 days, all the nanopar-
ticles settled down (as gathered by visual observation).
Theirregulartrendshowninthefigureisprobablydue
to the instability of the suspension.
On the contrary, the other samples were quite stable.
In the case of static solutions, the mean size slightly
decreasedtoaround70nmafterafewdaysandthenit
remained stable, indicating only a partial precipitation.
However, after a simple mechanical shaking a mean par-
ticle size of approximately 130 nm was repeatedly recov-
ered, suggesting the absence of further aggregation
phenomena. This result is of interest because it suggests
a possible application in devices where the fluids are fre-
quently or c ontinuously stirred , e.g. in plants with
forced circulation. All the measur ements provided aver-
age diameters higher than t he 21 nm of the base pow-
der, but the aggregates grew just after preparation,
keeping nanometric and constant dimensions even after
30 days. In order to highlight this behaviour, Figure 6
represents the nanoparticle size d istribution for water-
TiO
2
at 0.1 and 0.2 wt.% PEG. After 30 days, while the
static sample shows a smaller average diameter than at
the first day, the shaken nanofluid gives the same value,
i.e. no further aggregation was detected.
The measured Zeta potential was +40 mV for the nano-
fluids containing 1 and 0.1 wt.% TiO
2
, supporting their
non-aggregating tendency, while the values obtained for
the 0.01 wt.% TiO
2
fluid were not stable. The PEG:TiO
2
=
2:1 ratio turned out to be effective, but further research is
needed to optimize nanoparticle and dispersant concentra-
tion as a function of their application.
SWCNHs-water nanofluids
SWCNHs-water nanofluids with SDS as dispersant were
tested in several concentrations. An anionic dispersant
was chosen based on [14]. The investigated fluids were
• wa ter +0.01, 0.1 and 1 wt.% SDS at 0.01, 0.1 and 1
wt.% SWCNHs, respectively;
• water +0.01 wt.% SWCNHs +0.03 wt.% SDS.
Figure 7 represents the mean particle diameters as a
function of time for the nanofluid in static mode and
for the same nanofluid after mechanical shaking.
0
2
4
6
8
10
12
14
16
0.1 1 10 100 1000 10000
Intensity (%)
Diameter (nm)
Figure 4 Nanoparticles size distribution for water containing
0.1 wt% SWCNH, dispersed by means of the homogenization
method.without dispersant. At (thick line) day 1 and (dashed line)
day 33.
Table 3 Nanoparticles mean diameters and standard
deviations at different days from their preparation by
means of the homogenization method
Day from
preparation
Diameter
peak 1 (nm)
S.D.
peak 1
Diameter
peak 2 (nm)
S.D.
peak 2
TiO
2
/PEG (wt.%)
0.01/
0.02
1 198 0.8
5 166 3
15 268 6
16 159 1
0.1/
0.2
1 161 2
4 130 1
16 81 0.7
1/2 1 132 0.7
5 123 1
15 88 0.5
16 86 0.4
SWCNH/SDS (wt.%)
0.01/
0.01
1 109 0.6
5 131 2
15 106 1.4
0.01/
0.03
1 129 7
5 105 0.3
15 131 0.6 4358 427
0.1/
0.1
1 101 0.4
5 106 0.9
15 115 0.6
1/1 1 183 5
5 293 105 4312 158
15 261 18 3678 1503
All the values are related to the static measurements and at most two peaks
are identified.
Fedele et al. Nanoscale Research Letters 2011, 6:300
/>Page 6 of 8
Water-SWCNHs containing 0.01 wt.% SDS formed
aggregates, which are visible in Figure 7a in the upper
curve relative t o the shaken nanofluid. In order to
improvethestabilityofthissuspension,ahigherSDS:
SWCNHs ratio was tested. The result is shown in the
same figure with t riangle, where the suspension
0
100
200
300
400
500
600
0 5 10 15 20 25 30 35
Diameter (nm)
Day from preparation
Figure 5 Nanoparticles mean diameter. Diameter in relation to
the time elapsed from the day of preparation, for water containing
(a) 0.01 wt.% TiO
2
+ 0.02 wt.% PEG: (filled square) static, (open
square) shaken; (b) 0.1 wt.% TiO
2
+ 0.2 wt.% PEG: (filled triangle)
static, (empty triangle) shaken; (c) 1 wt.% TiO
2
+ 2 wt.% PEG: (filled
circle) static, (open circle) shaken.
0
2
4
6
8
10
12
14
16
18
0.1 1 10 100 1000 10000
Intensity (%)
Diameter (nm)
Figure 6 Nanoparticles’ size distribution for water containing
0.1 wt.% TiO
2
+ 0.2 wt.% PEG. At (thick line) day 1, (dashed line)
day 30 for static and day 30 for shaken (dashed-dotted line).
0
100
200
300
400
500
600
700
0 5 10 15 20 25 30 35 40 45
Diameter (nm)
Day from preparation
0.01 wt% SWCNHs
(a)
0
100
200
300
400
500
600
700
0 5 10 15 20 25 30
Diameter (nm)
Day from preparation
0.1 wt% SWCNHs
(b)
0
100
200
300
400
500
600
700
0 5 10 15 20 25 30 35 40 45
Diameter (nm)
Day from preparation
1 wt% SWCNHs
(c)
Figure 7 Nanoparticles ’ mean diameter. Diameter in relation to
the time elapsed from the day of preparation, for water containing
(a) 0.01 wt.% SWCNHs + 0.01 wt.% SDS: (filled circle) static, (open
circle) shaken; 0.01 wt.% SWCNHs + 0.03 wt.% SDS: (filled triangle)
static, (empty triangle) shaken; (b) 0.1 wt.% SWCNHs + 0.1 wt.% SDS:
(filled circle) static, (open circle) shaken; (c) 1 wt.% SWCNHs + 1 wt.
% SDS: (filled circle) static, (open circle) shaken.
Fedele et al. Nanoscale Research Letters 2011, 6:300
/>Page 7 of 8
containing 0.01 wt.% of SWCNHs and 0.03 wt. % of SDS
showed a very stable behaviour for 39 days, keeping a
mean diameter of about 120 nm.
Water-SWCNHs containing 0.1 wt.% SDS (Figure 7b)
shows a constant diameter around 100 nm, i.e. a value
very similar to the one measured for the powder, for
both the static and stirred sample even after 25 days,
suggesting a good stability of the fluid.
Analogous behaviour was shown by water-SWCNHs
containing 1 wt.% SDS (Figure 7c), though the me an
diameter of nanoparticles was about 180 nm.
ThemeasuredZetapotentialwasaround-40mV,
negative as expected in the case of anionic dispersant
[6,14], for all the studied S WCNHs-nanofluids, support-
ing their non-aggregating tendency. Owing to the strong
opacity of the solutions at 0.1 and 1 wt.%, they were
diluted to perform the Zeta potential measurements.
In conclusion, the water-based nanofluids containing
SWCNHs and SDS proved to be very stabl e and further
investigation on their properties is underway.
Conclusion
Water-based nanofluids, obtained by dispersing titanium
dioxide, SWCNH and copper oxide nanoparticles, were
investigated. By us ing a DLS apparatus, different pre-
paration techniques, i.e. ball milling, sonication and high
pressure homo genization, were compared. In fact, size
measurements can detect the mean diameter distribu-
tion variation along time and therefore the nanoparticles
have the tendency to settle down. Moreover, Zeta
potential measurements indicate the nanoparticles’ ten-
dency to aggregate. All these measurements, coupled
with the visual observation of the suspension, permitted
a stability analysis of the nanofluids.
The ball milling method turned out to be the worst
one to obt ain a stable nanofluid, while the homogeniza-
tion method was the more effective and, therefore, it
was selected to prepare the fluids in which the disper-
sants were added.
PEG a nd SDS were found to be good dispersants for
the nanofluids based on TiO
2
and SWCNHs, respec-
tively. Water-TiO
2
at0.1and1wt.%andwithaPEG:
TiO
2
= 2:1 ratio showed a fairly good stability when the
fluids are stirred, suggesting their applications in sys-
tems where they are always kept in motion. Water con-
taining 0.01, 0. 1 and 1 wt.% SWCNHs and 0.03 , 0.1 and
1 wt.% SDS, respectively, proved to be very stable even
in static mode for at least 25 days.
Therefore, this study demonstrated the feasibility of
stable nanofluids by controlling var ious v ariables.
Further development is need for the optimization of the
dispersant concentration and the study of the properties
of these fluids.
Abbreviations
DLS: dynamic light scattering; FE-SEM: field emission scanning electron
microscopy; PEG: polyethylene glycol; SDS: sodium n-dodecyl sulphate;
SWCNHs: single wall carbon nanohorns.
Author details
1
Consiglio Nazionale delle Ricerche, Istituto per le Tecnologie della
Costruzione, Corso Stati Uniti, I-35127 Padova, Italy
2
Consiglio Nazionale delle
Ricerche, Istituto per l’Energetica e le Interfasi, Corso Stati Uniti, I-35127
Padova, Italy
Authors’ contributions
SBarison and FA carried out the nanofluid preparation step. LC performed
the DLS and Z potential measurements. LF and SBobbo conceived the study
and analyzed the results. All author s read and approved the final manuscript.
Competing interests
The authors declare that they have no competing interests.
Received: 2 November 2010 Accepted: 6 April 2011
Published: 6 April 2011
References
1. Choi SUS, Eastman JA: Enhancing thermal conductivity of fluids with
nanoparticles. ASME International Mechanical Engineering Congress &
Exposition San Francisco, CA; 1995.
2. Keblinski P, Prasher R, Eapen J: Thermal conductance of nanofluids: is the
controversy over? Nanopart Res 2008, 10:1089.
3. Yu W, France DM, Routbort JL, Choi SUS: Review and Comparison of
Nanofluid Thermal Conductivity and Heat Transfer Enhancements. Heat
Transfer Eng 2008, 29:432.
4. Meibodi ME, Vafaie-Sefti M, Rashidi AM, Amrollahi A, Tabasi M, Kalal HS: The
role of different parameters on the stability and thermal conductivity of
carbon nanotube/water nanofluids. Heat Mass Transfer 2010, 37:319.
5. Jiang W, Ding G, Peng H, Hu H: Modeling of nanoparticles aggregation
and sedimentation in nanofluid. Curr Appl Phys 2010, 10:934.
6. Li X, Zhu D, Wang X: Evaluation on dispersion behavior of the aqueous
copper nano-suspensions. J Colloid Interface Sci 2007, 310:456.
7. Chung SJ, Leonard JP, Nettleship I, Lee JK, Soong Y, Martello DV, Chyu MK:
Characterization of ZnO nanoparticle suspension in water: Effectiveness
of ultrasonic dispersion. Powder Technol 2009, 194:75.
8. Lee D: Thermophysical properties of interfacial layer in nanofluids.
Langmuir 2007, 23:6011.
9. Lee D, Choi M: Coalescence enhanced synthesis of nanoparticles to
control size, morphology and crystalline phase at high concentrations.
Aerosol Sci 2002, 33:1.
10. Wang B-X, Zhou L-P, Peng X-F: A fractal model for predicting the
effective thermal conductivity of liquid with suspension of
nanoparticles. Int J Heat Mass Transfer 2003, 46:2665.
11. Pecora R: Dynamic Light Scattering: Applications of Photon Correlation
Spectroscopy Plenum Press; 1985.
12. Washington C: Particle Size Analysis in Pharmaceutics and other Industries:
Theory and Practice England: Ellis Horwood; 1992.
13. Alphonse P, Bleta R, Soules R: Effect of PEG on rheology and stability of
nanocrystalline titania hydrosols. J Colloid Interface Sci 2009, 337:81.
14. Sun Z, Nicolosi V, Rickard D, Bergin SD, Aherne D, Coleman JN:
Quantitative Evaluation of Surfactant-stabilized Single-walled Carbon
Nanotubes: Dispersion Quality and Its Correlation with Zeta Potential. J
Phys Chem C 2008, 112:10692.
doi:10.1186/1556-276X-6-300
Cite this article as: Fedele et al.: Experimental stability analysis of
different water-based nanofluids. Nanoscale Research Letters 2011 6:300.
Fedele et al. Nanoscale Research Letters 2011, 6:300
/>Page 8 of 8