Báo cáo hóa học: " Research Article On the Soft Fusion of Probability Mass Functions for Multimodal Speech Processing" ppt
Bạn đang xem bản rút gọn của tài liệu. Xem và tải ngay bản đầy đủ của tài liệu tại đây (12.23 MB, 14 trang )
Hindawi Publishing Corporation
EURASIP Journal on Advances in Signal Pr ocessing
Volume 2011, Article ID 294010, 14 pages
doi:10.1155/2011/294010
Research Ar ticle
On the Soft Fusion of Probability Mass Functions for
Multimodal Speech Processing
D. Kumar, P. Vimal, and Rajesh M. Hegde
Department of Electrical Engineering, Indian Institute of Technology, Kanpur 208016, India
Correspondence should be addressed to Rajesh M. Hegde,
Received 25 July 2010; Revised 8 February 2011; Accepted 2 March 2011
Academic Editor: Jar Ferr Yang
Copyright © 2011 D. Kumar et al. This is an open access article distributed under the Creative Commons Attribution License,
which permits unrestricted use, distribution, and reproduction in any medium, provided the original work is properly cited.
Multimodal speech processing has been a subject of investigation to increase robustness of unimodal speech processing systems.
Hard fusion of acoustic and visual speech is generally used for improving the accuracy of such systems. In this paper, we discuss the
significance of two soft belief functions developed for multimodal speech processing. These soft belief functions are formulated on
the basis of a confusion matr ix of probability mass functions obtained jointly from both acoustic and visual speech features. The
first soft belief function (BHT-SB) is formulated for binary hypothesis testing like problems in speech processing. This approach
is extended to multiple hypothesis testing (MHT) like problems to formulate the second belief function (MHT-SB). The two
soft belief functions, namely, BHT-SB and MHT-SB are applied to the speaker diarization and audio-visual speech recognition
tasks, respectively. Experiments on speaker diarization are conducted on meeting speech data collected in a lab environment and
also on the AMI meeting database. Audiovisual speech recognition experiments are conducted on the GRID audiovisual corpus.
Experimental results are obtained for both multimodal speech processing tasks using the BHT-SB and the MHT-SB functions. The
results indicate reasonable improvements when compared to unimodal (acoustic speech or visual speech alone) speech processing.
1. Introduction
Multi-modal speech content is primarily composed of acous-
tic and visual speech [1]. Classifying and clustering multi-
modal speech data generally requires extraction and com-
bination of information from these two modalities [2].
The streams constituting multi-modal speech content are
naturally different in terms of scale, dynamics, and temporal
patterns. These differences make combining the informa-
tion sources using classic combination techniques difficult.
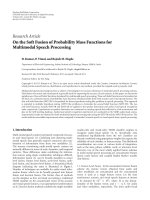
Information fusion [3] can be broadly classified as sensor
level fusion, feature level fusion, score-level fusion, rank-
level fusion, and decision-level fusion. A hierarchical block
diagram indicating the same is illustrated in Figure 1.
Number of techniques are available for audio-visual infor-
mation fusion, which can be broadly grouped into feature
fusion and decision fusion. The former class of methods
are the simplest, as they are based on training a traditional
HMM classifier on the concatenated vector of the acoustic
and visual speech features, or an appropriate transformation
on it. Decision fusion methods combine the single-modality
(audio-only and visual-only) HMM classifier outputs to
recognize audio-visual speech [4, 5]. Specifically, class
conditional log-likelihoods from the two c lassifiers are
linearly combined using appropriate weights that capture the
reliability of each classifier, or feature stream. This likelihood
recombination can occur at various levels of integration,
such as the state, phone, syllable, word, or utterance level.
However, two of the most widely applied fusion schemes
in multi-modal speech processing are concatenative feature
fusion (early fusion) and coupled hidden Markov models
(late fusion).
1.1. Feature Level Fusion. In the concatenative feature fusion
scheme [6], feature vectors obtained from audio and
video modalities are concatenated and the concatenated
vector is used as a single feature vector. Let the time
synchronous acoustic and visual speech features at instant
t, be denoted by O
(t)
S
∈ R
D
s
,whereD
s
is the dimen-
sionality of the feature vector, and s
= A, V, for audio
and video modalities, respectively. The joint audio-visual
2 EURASIP Journal on Advances in Signal Processing
Fusion before matchingFusion before matching
Feature levelSensor level Expert fusion
Match score level Rank level Decision level
Multimodal
information fusion
Figure 1: Levels of multi-modal information fusion.
feature vector is then simply the concatenation of the two ,
namely
O
(t)
=
O
(t)
A
T
, O
(t)
V
T
T
∈ R
D
,
(1)
where D
= D
A
+ D
V
. These feature vectors are then used
to train HMMs as if generated from single modality and
are used in the speech processing and recognition process.
Hierarchical fusion using feature space transformations like
hierarchical LDA/MLLT [6], are also widely used in this
context. Another class of fusion schemes uses a decision
fusion mechanism. Decision fusion with adaptive weighting
scheme in HMM-based AVSR systems is performed by
utilizing the outputs of the acoustic and the visual HMMs
for a given audiovisual speech datum and then fuse them
adaptively to obtain noise-robustness over various noise
environments [7]. However, the most widely used among
late fusion schemes is the coupled hidden Markov model
(CHMM) [8].
1.2. Late Fusion Using Coupled Hidden Markov Models. A
coupled HMM can be seen as a collection of HMMs, one for
each data stream, where the discrete nodes at time t for each
HMM are conditioned by the discrete nodes at time t
− 1of
all the related HMMs. Parameters of a CHMM are defined as
follows
π
c
o
(
i
)
= P
q
c
t
= i
,
b
c
t
(
i
)
= P
O
c
t
| q
c
t
= i
,
a
c
i| j,k
= P
q
c
t
= i | q
0
t
−1
= j, q
1
t
−1
= k
,
(2)
where q
c
t
is the state of the couple node in the cth stream at
time t. In a continuous mixture with Gaussian components,
the probabilities of the obser ved nodes are given by
b
c
t
(
i
)
=
M
c
i
m=1
w
c
i,m
N
O
c
t
, μ
c
i,m
, U
c
i,m
,
(3)
where μ
c
i,m
and U
c
i,m
are the mean and covariance matrix
of the ith state of a coupled node, and mth component
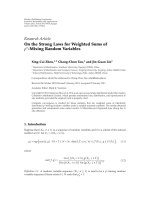
t = 0, t = 1, t = T − 2, t = T − 1,
······
t,
Figure 2: The audio-visual coupled HMM.
of the associated mixture node in the cth channel. M
c
i
is
the number of mixtures corresponding to the ith state of a
coupled node in the cth stream and the weight w
c
i,m
represents
the conditional probability P(s
c
t
= m | q
c
t
= i)wheres
c
t
is the component of the mixture node in the cth stream
at time t. A schematic illustration of a coupled HMM is
shown in Figure 2. Multimodal information fusion can also
be classified as hard and soft fusion. Hard fusion methods
are based on probabilities obtained from Bayesian theory
which generally place complete faith in a decision. However,
soft fusion methods are based on principles of Dempster-
Shafer theory or Fuzzy logic which involve combination
of beliefs and ignorances. In this paper, we first describe
a new approach to soft fusion by formulating two soft
belief functions. This formulation uses confusion matrices of
probability mass functions. Formulation of the two soft belief
functions is discussed first. The first belief function is suitable
for binary hypothesis testing (BHT) like problems in speech
processing. One example for a BHT-like problem is speaker
EURASIP Journal on Advances in Sig nal Processing 3
diarization. The second soft belief function is suitable for
multiple hypothesis testing (MHT) like problems in speech
processing, namely audio-visual speech recognition. These
soft belief functions are then used for multi-modal speech
processing tasks like speaker diarization and audio-visual
speech recognition on the AMI meeting database and the
GRID corpus. Reasonable improvements in performance are
noted w hen compared to the performance using unimodal
(acoustic speech or visual speech only) methods.
2. Formulation of Soft Belief Functions Using
Matrices of Probability Mass Functions
Soft information fusion refers to a more flexible system to
combine information from audio and video modalities for
making better decision. The Dempster Shafer (DS) theory
is a mathematical theory of evidence [9]. It allows one
to combine evidence from different sources and arrive at
a degree of belief (represented by belief function) that
takes into account all the available e vidences. DS theory
is a generalization of the Bayesian theory of subjective
probability. While the Bayesian theory requires probabilities
for each question of interest, belief functions allow u s to have
degrees of belief for one question on probabilities of a related
question.
2.1. Belief Function in Dempster Shafer Theory. Dempster
Shafer theory of ev idence allows the representation and com-
bination of different measures of evidence. It is essentially a
theory that allows for soft fusion of evidence or scores. Let
Θ
=
(
θ
1
, , θ
k
)
(4)
be a finite set of mutually exclusive and exhaustive hy pothesis
referred as singletons and Θ is referred as a frame of
discernment. A basic probability assignment is a function m
such that
m :2
Θ
−→
[
0, 1
]
(5)
where
A⊂Θ
m
(
A
)
= 1, m
(
Φ
)
= 0.
(6)
If
¬A is complementary set of A, then by DS Theory
m
(
A
)
+ m
(
¬A
)
< 1,
(7)
Which is in contrast to probability theory. This divergence
from probability is called Ignorance. The function assigning
sum of masses of all the subsets of the set of interest is called
the belief function and is given by
Bel
(
A
)
=
B⊂A
m
(
B
)
. (8)
A belief function assigned to each subset of θ is a measure of
total belief in the preposition represented by the subset. This
definition of the belief function is used to formulate the soft
belief functions proposed in the following sections.
Table 1: Reliability of the unimodal features.
Classification feature Reliability
Acoustic speech: X
audio
x
Visual speech: X
video
y
3. A Soft Belief Function for Binary Hypothesis
Testing-Like Problems in Speech Processing
This sec tion describes the proposed methodology of using
the confusion matrices of probability mass functions to
combine decisions obtained from acoustic and visual speech
feature streams. The degree of belief for a decision is
determined from subjective probabilities obtained from the
two modalities and then are combined using Dempster’s
rule, making a reasonable assumption that the modalities are
independent.
3.1. Probability Mass Functions for Binary Hypothesis Testing-
Like Problems. The probability mass function (PMF) in D-S
theory defines a mass distribution based on the reliability of
the individual modalities. Consider two unimodal (acoustic
or visual speech feature) decision scenarios as follows
X
audio
: the audio feature-based decision.
X
video
: the v ideo feature-based decision.
On the other hand let us consider a two hypothesis problem
(H
1
or H
2
) of two exclusive and exhaustive classes, which we
are looking to classify with the help of above feature vectors.
Both X
audio
and X
video
can hypothesize as H
1
or H
2
. Thus the
focal elements of both the features are H
1
, H
2
and Ω,where
Ω is the whole set of classes
{H
1
, H
2
}. The unimodal source
reliabilities provide us with a certain degree of trust that we
should have on the decision of that modality. The reliabilities
of acoustic and visual speech-based decisions is decided on
the number of times the X
audio
and X
video
classifies the given
data correctly. At a particular time interval, the acoustic
speech features give a certain probability of classification.
If P( X
audio
= H
1
) = p
1
, then the mass distribution is
m
audio
(H
1
) = xp
1
. Similarly, the mass assigned to H
2
is
m
audio
(H
2
) = x(1 − p
1
). The remaining mass, is allocated
to the whole set of discernment, m
audio
(Ω) = 1 − x. Similarly
we assign a mass function for the visual speech feature-based
decision.
3.2. Generating Confusion Matrix of Probability Mass Func-
tions. It is widely accepted that the acoustic and visual
feature-based decisions are independent of each other.
Dempster’s rule of combination can therefore be used
for arriving at a joint decision given any two modalities.
However , there are three PMFs corresponding to the two
hypothesis. The two mass functions with respect to hypoth-
esis H
1
and H
2
and the mass function corresponding to the
overall set of discernment make up the three PMFs. Since we
have three mass functions corresponding to each modality,
a confusion matrix of one versus the other can be formed.
4 EURASIP Journal on Advances in Signal Processing
The confusion-matrix of PMFs thus obtained for the audio-
visual speech features combined is shown in Ta bl e 2.
3.3. Formulating the Soft Belief Function Using the Confusion
Matrix of Mass Functions. The premise of coming up
with such a confusion matrix is due to the fact that the
two modalities under consideration carry complementary
information. Hence if the decisions of the two modalities
are inconsistent, their product of masses is assigned to a
single measure of inconsistency, say k.FromTab l e 2,total
inconsistency k is defined as
k
= xyp
1
1 − p
2
+ xyp
2
1 − p
1
. (9)
Hence the combined belief in hypothesis H
1
and H
2
,
obtained from the multiple modalities (speech and video)
can now be formulated as
Bel
(
H
1
)
=
xyp
1
p
2
+ xp
1
1 − y
+
(
1 − x
)
yp
2
(
1
− k
)
,
Bel
(
H
2
)
=
xy
1 − p
1
1 − p
2
+ x
1 − p
1
1 − y
(
1
− k
)
+
(
1
− x
)
y
1 − p
2
(
1
− k
)
.
(10)
Note that the mass functions have been normalized by the
factor (1
− k). The soft belief function for BHT-like problems
(BHT-SB), formulated in (10), gives a soft decision measure
for choosing a better hypothesis from the two possible
classifications.
3.4. Multimodal Speaker Diarization As a B inary Hypothesis
Testing-Like Problem in Speech P rocessing. In the context of
audio document indexing and retrieval, speaker diarization
[10, 11], is the process which detects speakers turns and re
groups those uttered by the same speaker. It is generally based
on a first step of segmentation and often preceded by a speech
detection phase. It also involves partitioning the regions of
speech into sufficiently long segments of only one speaker.
This is followed by a clustering step that consists of giving
the same label to segments uttered by the same speaker.
Ideally, each cluster corresponds to only one speaker and vice
versa. Most of the systems operate without specific a priori
knowledge of speakers or their number in the document.
They generally need specific tuning and parameter training.
Speaker diarization [10], can hence be considered as BHT-
like problem since we only have two hypothesis to decide
on. Hypothesis H
1
decides on a speaker change detected
and hypothesis H
2
decides on speaker change not detected.
Hence the aforementioned BHT-SB function is used on the
multi-modal speaker diarization task [11], in the section on
performance evaluation later in this paper.
4. A Soft Belief Function for Multiple
Hypothesis Testing-Like Problems in
Speech Processing
In this section we describe the formulation of a soft belief
function for multiple hypothesis Testing-Like problems in
speech processing, by taking an example of audio-visual
speech recognition. Audio-visual speech recognition can be
viewed as a multiple hypothesis testing problem, depending
on the number of words in the dictionary. More specifically
audio-visual speech recognition is an N hypothesis problem,
where each utterance has N possible options to be classified
into .
4.1. Probability Mass Functions for Multiple H ypothe-
sis Testing-Like Problems. Consider the following multiple
hypothesis testing scenario for word-based speech recogni-
tion
H
1
:word1
H
2
:word2
···
H
N
:wordN.
Recognition probabilities from individual modalities are
given by (11)
P
(
X
audio
= H
i
)
= A
i
; P
(
X
Video
= H
i
)
= V
i
;1≤ i ≤ N.
(11)
The problem is to find out most likely hypothesis by using
X
Audio
and X
Video
,where
X
audio
: the acoustic speech feature-based decision.
X
video
: the visual speech feature-based decision.
The reliability of audio and video based decision is as given
in Ta bl e 3.
4.2. Generating Confusion Matrix of Probability Mass Func-
tions. The premise that acoustic and visual feature-based
decisions are independent of each other can still be applied
to a audio-visual speech recognition problem. Dempster’s
rule of combination can therefore be used for arriving at
a joint decision given any two modalities even in this case.
However , there are (N + 1) PMFs, as we are dealing with a
N (multiple) hypothesis problem. The N +1massfunctions
with respect to h ypothesis H
1
through HN and the mass
function corresponding to the overall set of discernment
make up the N +1 PMFs. Since we have three mass functions
corresponding to each modality, a confusion matrix of one
versus the other can be formed. The confusion-matrix of
probability mass functions (PMFs), for this “N”hypothesis
problem is shown in Tab le 4.
4.3. Formulating the Soft Belief Function Using the Confusion
Matrix of Mass Functions. From Table 4 ,thetotalinconsis-
tency k is given by
k
=
N
i=1
i
/
= j
N
j=1
xyA
i
V
j
. (12)
EURASIP Journal on Advances in Sig nal Processing 5
Table 2: The confusion-matrix of probability mass functions (PMFs) for multi-modal features.
m
v
(H
1
) = yp
2
m
v
(H
2
) = y(1 − p
2
) m
v
(Ω) = 1 − y
m
a
(H
1
) = xp
1
m
a,v
(H
1
) = xyp
1
p
2
k = xyp
1
(1 − p
2
) m
a,v
(H
1
) = x(1 − y)p
1
m
a
(H
2
) = x(1 − p
1
) k = xyp
2
(1 − p
1
) m
a,v
(H
2
) = xy(1 − p
1
)(1 − p
2
) m
a,v
(H
2
) = x(1 − y)(1 − p
1
)
m
a
(Ω) = 1 − xm
a,v
(H
1
) = (1 − x)yp
2
m
a,v
(H
2
) = (1 − x)y(1 − p
2
) m
a,v
(Ω) = (1 − x)(1 − y)
Table 3: Reliability of the unimodal features.
Classification feature Reliability
Acoustic speech: X
audio
x
Visual speech: X
video
y
Hence, the combined belief in hypothesis H
k
,1≤ k ≤ N,
obtained from the multiple modalities (speech and video)
can now be formulated as
Bel
(
H
k
)
=
xyA
k
V
k
+ x
1 − y
A
k
+
(
1 − x
)
yV
k
(
1
− k
)
.
(13)
The soft belief function for MHT-like problems (MHT-SB),
formulated in (13), gives a soft decision measure for choosing
a better hypothesis from the N possible options.
4.4. Audio-Visual Speech Recognition As a Multiple Hypothesis
Testing Problem. Audio-visual speech recognition (AVSR) is
a technique that uses image processing capabilities like lip
reading to aid audio-based speech recognition in recognizing
indeterministic phones or giving preponderance among very
close probability decisions. In general, lip reading and audio-
based speech recognition works separately and then the
information gathered from them is fused together to make
a better decision. The aim of AVSR is to exploit the human
perceptual principle of sensory integration (joint use of
audio and visual information) to improve the recognition
of human activity ( e.g., speech recognition, speech activity,
speaker change, etc.), intent (e.g., speech intent) and identit y
(e.g., speaker recognition), particularly in the presence of
acoustic degradation due to noise and channel, and the
analysis and mining of multimedia content. AVSR can be
viewed as a multiple hypothesis Testing-Like problem in
speech processing since there are multiple words to be
recognized in a typical word-based audio-visual speech
recognition system. The application of the aforementioned
MHT-SB function to such a problem is discussed in the
ensuing section on performance evaluation.
5. Performance Evaluation
5.1. Databases Used in Experiments on Speaker Diarization.
In order to evaluate and compare the performance of the soft
belief function for BHT-like problems, the BHT-SB is applied
to a speaker diarization task on two databases. The first
database is composed of multi-modal speech data recorded
on the lab test bed and the second database is the standard
AMI meeting corpus [12].
S1
2CX
P1 P2
C1
C2
P4P3
M3
M1 M2
M4
C1
C2
C3
C4
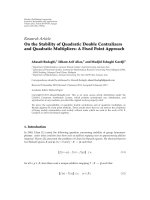
Figure 3: Layout of the lab test bed used to collect multi-modal
speech data.
5.1.1. Multimodal Data Acquisition Test Bed. The experi-
mental lab test bed is a typical meeting room setup which
can accommodate four participants around a table. It is
equipped with an eight-channel linear microphone array
and a four channel video array, capable of recording each
modality synchronously. Figure 3 represents layout of the
test bed used in data collection for this particular set of
experiments. C1, and C2 are two cameras; P1, P2, P3, P4 are
four participants of the meeting; M1, M2, M3, M4 represents
four microphones and S is the screen. It is also equipped
with a two-channel microphone array (2CX), a server and
computing devices. A manual timing pulse is generated to
achieve start to end multi-modal synchronization. For the
purpose of speaker diarization we use only one channel of
audio data and two-channel of video data with each camera
focusing on the participants face. The multi-modal data used
in our experiments is eighteen minutes long, consisting of
3 speakers taking turns as in a dialogue, and the discussion
was centered around various topics like soccer, research, and
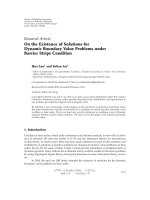
mathematics. Figure 4 shows the snapshot of the lab test bed
used for acquiring the multi-modal data.
5.1.2. AMI Database. The AMI (augmented multi-party
interaction) project [12] is concerned with the development
of technology to support human interaction in meetings, and
to provide better structure to the way meetings are run and
documented. The AMI meeting corpus contains 100 hours
of meetings captured using many synchronized recording
devices, and is designed to support work in speech and
video processing, language e ngineering, corpus linguistics,
6 EURASIP Journal on Advances in Signal Processing
Table 4: The confusion-matrix of probability mass functions for multi-modal features.
m
v
(H
1
) = yV
1
m
v
(H
2
) = yV
2
··· m
v
(H
N
) = yV
N
m
v
(Ω) = 1 − y
m
a
(H
1
) = xA
1
m
a,v
(H
1
) = xyA
1
V
1
k = xyA
1
V
2
··· k = xyA
1
V
N
m
a,v
(H
1
) = x(1 − y)A
1
m
a
(H
2
) = xA
2
k = xyA
2
V
1
m
a,v
(H
2
) = xyA
2
V
2
··· k = xyA
2
V
N
m
a,v
(H
2
) = x(1 − y)A
2
··· ··· ··· ··· ··· ···
m
a
(H
N
) = xA
N
k = xyA
N
V
1
k = xyA
N
V
2
··· m
a,v
(H
N
) = xyA
N
V
N
m
a,v
(H
N
) = x(1 − y)A
N
m
a
(Ω) = 1 − xm
a,v
(H
1
) = (1 − x)yV
1
m
a,v
(H
2
) = (1 − x)yV
2
··· m
a,v
(H
N
) = (1 − x)yV
N
m
a,v
(Ω) = (1 − x)(1 − y)
Figure 4: Snapshot of the actual test bed used to acquire multi-
modal speech data.
Figure 5: AMI’s instrumented meeting room (source: AMI web-
site).
and organizational psychology. It has been transcribed or-
thographically, with annotated subsets for every thing from
named entities, dialogue acts, and summaries to simple gaze
and head movement. Two-thirds of the corpus consists of
recordings in which groups of four people played different
roles in a fictional design team that was specifying a
new kind of remote control. The remaining third of the
corpus contains recordings of other types of meetings. For
each meeting, audio (captured from multiple microphones,
including microphone arrays), video (coming from multiple
cameras), slides (captured from the data projector), and
textual information (coming from associated papers, cap-
tured handwritten notes and the white board) are recorded
and time-synchr onized. The multi-modal data from the
augmented multi-party interaction (AMI) corpus is used
here to perform the experiments. It contains the annotated
data of four participants. The duration of the meeting was
around 30 minutes. The subjects in the meeting are carr y ing
out various activities such as presenting slides, white board
explanations and discussions round the table.
5.2. Database Used in Experiments on Audio-Visual Speech
Recognition: The GRID Corpus. GRID [13] corpus is a large
multitalker audio-visual sentence corpus to support joint
computational behavioral studies in speech perception. In
brief, the corpus consists of high-quality audio and video
(facial) recordings of 1000 sentences spoken by each of 34
talkers (18 male, 16 female). Sentences are of the form “put
red at g nine now”.
5.2.1. Sentence Design. Each sentence consisted of a six
word sequence of the form indicated in Tab l e 5.Ofthesix
components, three-color, letter, and d igit were designated
as keywords. In the letter position, “ w” was excluded
since it is t he only multisyllabic English alphabetic letter.
“Zero”wasusedratherthan“oh”or“naught”toavoid
multiple pronunciation alternatives for orthographic 0. Each
talker produced all combinations of the three keywords,
leading to a total of 1000 sentences per talker. The remain-
ing components command, preposition, and adverb were
fillers.
5.2.2. Speaker Population. Sixteen female and eighteen male
talkers contributed to the corpus. Participants were staff
and students in t he Departments of Computer Science
and H uman Communication Science at the University of
Sheffield. Ages ranged from 18 to 49 years with mean age
being 27.4 years.
5.2.3. Collection. Speech material collection was done under
computer control. Sentences were presented on a computer
screen located outside the booth, and talkers had 3 seconds
to produce each sentence. Talkers were instructed to speak
in a natural style. To avoid overly careful and drawn-out
utterances, they were asked to speak sufficiently q uickly to
fit into the 3 seconds time window.
5.3. Experiments on Speaker Diarization. In the ensuing
sections we describe the experimental conditions for uni-
modal speech diarization [14], and the proposed multi-
modal speaker diarization using the BHT-SB function.
EURASIP Journal on Advances in Sig nal Processing 7
Table 5: Sentence structure for the Grid corpus. Keywords are identified with asterisks.
Command Color
∗
Preposition Letter
∗
Digit
∗
Adverb
bin blue at A–Z 1–9, 0 again
lay green by excluding W now
place red in please
set white with soon
5.3.1. Speech-Based Unimodal Speaker Diarization. The BIC
(bayesian information criterion) for segmentation and clus-
tering based on MOG (mixture of gaussian) is used for
the purpose of speech-based unimodal speaker diarization.
The likelihood distance is calculated between two segments
to determine whether they belong to the same speaker
or not. The distances used for acoustic change detection
can also be applied to speaker clustering in order to infer
whether two clusters belong to the same speaker. For a given
acoustic segment X
i
, the BIC value of a particular model M
i
,
indicates how well the model fits the data, and is determined
by (16). In order to detect the audio scene change between
two segments with the help of BIC, one can define two
hypothesis. Hypothesis 0 is defined as
H
0
:x
1
,x
2
, ,x
N
∼ N
μ, Σ
,
(14)
which considers the whole sequence to consist no speaker
change. Hypothesis 1 is defined as
H
1
:x
1
,x
2
, ,x
L
∼ N
μ
1
, Σ
1
,
x
L+1
,x
L+2
, ,x
N
∼ N
μ
2
, Σ
2
(15)
is the hypothesis that a speaker change occurs a t time L.A
check of whether the hypothesis H
0
better models the data as
compared to the hypothesis H
1
, for a mixture of Gaussian
case can be done by computing a function similar to the
generalized likelihood ratio as
ΔBIC
(
M
i
)
= log
(
L
(
X, M
))
−
log
(
L
(
X
i
, M
i
))
+ log
L
X
j
, M
j
−
λΔ#
i, j
log
(
N
)
,
(16)
where Δ#(i, j)isthedifference in the number of free param-
eters b etween the combined and the individual models.
When the BIC value based on mixture of Gaussian
model exceeds a certain threshold, an audio scene change
is declared. Figure 6, illustrates a sample speaker change
detection plot with speech information only using BIC. The
illustration corresponds to the data from the AMI multi-
modal corpus. Speaker changes have been detected at 24, 36,
53.8 and 59.2 seconds. It is important to note here that the
standard mel frequency cepstral coefficients (MFCC) were
used as acoustic features in the experiments.
5.3.2. Video Based Unimodal Speaker Diarization U sing
HMMs. Unimodal speaker diarization based on video fea-
tures uses frame-based video features for speaker diarization.
(s)
24 36 53.8 59.2
Figure 6: Speech-based unimodal speaker change detection.
Figure 7: Video frame of silent speaker.
Figure 8: V ideo frame of talking speaker.
8 EURASIP Journal on Advances in Signal Processing
Figure 9: Extracted face of silent speaker.
Figure 10: Extracted face of talking speaker.
The feature used is the histogram of the hue plane of the
face pixels. The face of the speaker is first extracted from
thevideo.Thehueplaneofthefaceregionofeachframe
is then determined. The histogram of this hue plane in
thirty-two bins is used as video feature vector. Hue plane
features of the whole face are used and not just of the lips.
This is primarily because the face contains a considerable
amount of information from the perspective of changes in
the hue plane. It was also noted from initial experiments
that the changes in the hue plane of the face pixels when a
person is speaking compared to when silent are significant.
This histogram is then used as feature vector for training
hidden Markov models. Figures 7, 8, 9,showsaframeof
the video of a silent speaker from the AMI database, whose
skin colored pixels are tracked and then the hue plane of
the frame extracted. In Figures 10, 11, 12, a similar set of
results are illustrated for the same speaker and from the
same video clip, when she is speaking. Using the features
extracted f rom the histogram of the hue plane, speaker
diarization is now performed over a video segment of a
certain duration by calculating the likelihood of the segment
belonging to a model. The segment is classified as belonging
to that speaker, for which the model likelihood is maximum.
HMMs for each speaker are trained a priori using the video
features. A speaker change is detected if the consecutive
Figure 11: Hue plane of silent speaker.
Figure 12: Hue plane of talking s peaker.
segments are classified as belonging to different models. The
probability of speaker change is computed as the probability
of two consecutive video segments belonging to two d ifferent
models.
5.4. Experimental Results on Multimodal Speaker Diarization
Using the BHT-Soft Belief Function. To facilitate for the
synchronization of multi-modal data, that is, the video
frame rate of 25 fps, and the speech sampling rate of
44100 Hz, we consider frame-based segment intervals for
evaluating speaker change detection and subsequent speaker
diarization. An external manual timing pulse is used for
synchronization. The results obtained are compared with the
annotated data of the AMI corpus. The multi-modal data
recorded from the test b ed has video frame rate of 30 fps and
is manually annotated. Speaker diarization performance is
usually evaluated in terms of diarization error rate (DER),
which is essentially a sum of three terms namely, missed
speech (speech in the reference but not in the hypothesis),
false alarm speech (speech in the hypothesis but not in
the reference), and speaker match error (reference and
hypothesized speakers differ). Hence the DER is computed
as
DER
=
FA + MS + SMR
SPK
%,
(17)
EURASIP Journal on Advances in Sig nal Processing 9
02468101214
0
0.1
0.2
0.3
0.4
0.5
0.6
0.7
Feature dimension
Bhattacharaya distance
Audio + video
Audio
Video
Figure 13: Separability analysis results as the BD versus the feature
dimension for unimodal and multi-modal features.
where missed speaker time (MS) is the total time when less
speakers are detected than what is correct, false alarm speaker
time (FA) is the total time when more speakers are detected
than what is correct, speaker match error time (SMR) is
the total time when some other speaker is speaking rather
than the speaker detected and scored speaker time (SPK) is
the sum of every speakers utterance time as indicated in the
reference.
5.4.1. Separability Analysis for Multimodal Features. In order
to analyze the complementary nature of the acoustic and
visual speech features, separability analysis is performed
using the Bhattacharya distance as a metric. The Bhat-
tacharya distance ( BD), which is a special c ase of the
Chernoff distance is a probabilistic error measure and relates
more closely to the likelihood maximization classifiers that
we have used for performance evaluation. Figure 13 illustrate
the separability analysis results as the BD versus the feature
dimension for both unimodal (speech only & video only)
and multi-modal (speech + video) features in Figure 13.
The complementarity of the multi-modal features when
compared to unimodal speech features can be noted from
Figure 13.
5.4.2. Experimental Results. The reliability of each feature
is determined by its speaker change detection performance
on a small development set created from unimodal speech
or video data. The reliability values of the audio and video
features computed from the development data set are given
in Ta bl e 6, for the two corpora used in our experiments. The
speaker diarization error rates (DER) for both the multi-
modal corpora used is also shown in Figure 14.Reasonable
reduction in DER is noted on using the BHT-SB function
Table 6: Reliability of the unimodal information a s computed from
their feature vectors on the two multi-modal data sets.
Unimodal Feature
Reliability on AMI
corpus
Reliability on test
bed data
Audio: X
audio
90.47 87.50
Video: X
video
87.50 78.04
0
5
10
15
20
25
30
Speaker DER
AMI corpus data Test bed data
Unimodal audio
Audio + video fusion
1
2
Figure 14: Speaker DER using unimodal audio and multi-modal
information fusion on the two data sets.
as a soft fusion method when compared to the experimental
results obtained from unimodal speech features.
5.4.3. Discussion on Speaker Diarization System Performance.
Performance of speaker diarization system increases consid-
erably when video information is fused with audio informa-
tion as compared to audio only based system. A measure of
the system performance, Diarization Error Rate (DER), is
considerably low for system based on the proposed method
of fusion of audio and visual information, as compared to
audio only system. This result is shown in Figure 14,forthe
AMI database and also for multi-modal data from the lab
testbed. Ta bl e 6, indicates that audio has been more reliable
than video, which is quiet evident as there are certain sounds
which can be produced without involving mouth movement
(e.g., nasals). This fact is also reflected in Figure 13.
5.5. Experiments on Audio-Visual Speech Recognition. The
potential for improved speech recognition rates using visual
features is well established in the literature on the basis
of psychophysical experiments. Canonical mouth shapes
that accompany speech utterances have b een categorized,
andareknownasvisualphonemesor“visemes”.Visemes
[15], provide information that complements the phonetic
stream from the point of view of confusability. A viseme
is a repr esentational unit used to classify speech sounds in
the visual domain. This term was introduced based on the
interpretation of the phoneme as a basic unit of speech in
the acoustic domain. A viseme describes particular facial and
10 EURASIP Journal on Advances in Signal Processing
Table 7: Visemes as phoneme classes.
Viseme Phoneme class
0silence
1fvw
2sz
3SZ
4pbm
5gkxnNrj
6td
7l
8Ie:
9EE:
10 A
11 @
12 i
13 O Y y u 2: o: 9 9: O:
14 a:
oral positions and movements that occur alongside the voic-
ing of phonemes. Phonemes and visemes do not always
share a one-to-one correspondence. Often, several phonemes
share the same viseme. Thirty tw o visemes are required
in order to produce all possible phoneme with the human
face. If the phoneme is distorted or muffled, the viseme
accompanying it can help to clarify what the sound actually
was. Thus, visual and auditory components work together
while communicating orally. Earlier experimental work on
audio-visual speech recognition for recognizing digits can be
found in [16]. Experimental work on recognizing words can
be referred to in [17, 18], while the recognition of continuous
speech is dealt with in [19– 21].
5.5.1. Feature Vectors for Acoustic and Visual Speech. Acoustic
features used in the experiments are t he conventional mel
frequency cepstral coefficients (MFCC), appended with delta
and acceleration coefficients. Visual speech features are
computed from the histogram of the lip region. To compute
the visual speech feature, lip region is assumed to be in the
lowerhalfofthefacepart.Wehaveused70
× 110 pixel
sized region, in the lower part of the face as lip region. To
find out video feature vector, first we subtract RGB values
of consecutive frames, so as to get motion vector video
from the original video. Lip region is then extracted from
this video and is converted to gray scale image by adding
up the RGB values. A non-linear scale histogram of the
pixel values of each frame, in 16 bins is found out and is
used as feature vector. The sixteen bins are on a nonlinear
scale. HMM models for these video features of each word
utterance are trained for video only speech rec ognition. The
visual evidence for the complementary information present
in acoustic and visual features are illustrated in Figures 15,
16,and17, 18. Illustrations for two situations where clean
speech and noisy videos are available and vice versa are given
in Figures 15, 16 and 17, 18, respectively.
2468101214
−0.5
0
0.5
Amplitude
×10
4
Time (samples)
(a)
Time (s)
Frequency
0.5 1 1.5 2 2.5
0
0.5
1
1.5
2
2.5
×10
4
(b)
Figure 15: Clean speech signal and its spectrogram.
Figure 16: Noisy video signal.
5.5.2. Experimental Results on Audio-V isual Speech Recogni-
tion on the GRID Corpus. As described earlier, the GRID
corpus sentence consists of 6 words. The organization of
these words as sentences is as follows
Word 1 : bin — lay — place — set;
Word2:blue—green—red—white;
Word3:at—by—in—with;
Word 4: a — b — c — d — e — f — g — h — i — j
—k—l—m—n—o—p—q—r—s—t—u
—v—x—y—z;
Word5:zero—one—two—three—four—five
—six—seven—eight—nine;
Word 6: again — now — please — soon.
In order to use the proposed MHT-SB function for a soft
combination of the decisions made from audio and video
EURASIP Journal on Advances in Signal Processing 11
2 4 6 8 10 12 14
−0.5
0
0.5
Amplitude
×10
4
Time (samples)
(a)
Time (s)
Frequency
0.5 1 1.5 2 2.5
0
0.5
1
1.5
2
2.5
×10
(b)
Figure 17: Noisy speech signal a nd its s pectrogram.
Figure 18: Clean video signal.
modalities, the reliability of acoustic and visual speech
features is found by carrying out recognition experiments
on the development data. This gives the reliability of
acoustic and visual speech data. The weighted likelihoods
corresponding to acoustic and visual speech features are
found using
SL
γ
= antilog
L
1000γ
. (18)
In (18), SL
γ
is the weighted log likelihood, γ is the weighting
factor, and L the original likelihood obtained from the
unimodal visual speech feature. The variable γ,represents
the weight being given to likelihood obtained from the video
modality, while making the combined decision. The values
of the log likelihood obtained from the recognizer is small.
For audio it is of the order of
−300 to −200, whereas
for video is of the order of
−3000 to −2000. Because of
Table 8: Percentage word recognition for clean speech.
Word 1 Word 2 Word 3
Reliability of video 52.33% 43.54% 44.04%
Reliability of audio 98.12% 95.74% 77.08%
Unimodal video features 50.33% 39.05% 40.55%
Unimodal audio features 96.99% 96.49% 79.89%
A-V feature fusion 82.98% 74.44% 57.62%
Coupled HMM 92.98% 94.44% 77.62%
Fusion using MHT-SBF 99.00% 96.63% 80.12%
Word 4 Word 5 Word 6
Reliability of video 11.31% 21.89% 39.93%
Reliability of audio 72.10% 95.94% 99.94%
Unimodal video features 10.92% 25.24% 43.50%
Unimodal audio features 72.83% 96.65% 99.89%
A-V Feature fusion 48.13% 71.19% 83.48%
Coupled HMM 66.98% 90.44% 92.62%
Fusion using MHT-SBF 74.34% 97.52% 99.89%
Table 9: Percentage word recognition for speech at SNR of 30 dB.
Word 1 Word 2 Word 3
Reliability of video 52.33% 43.54% 44.04%
Reliability of audio 81.43% 89.50% 63.45%
Unimodal video features 50.33% 39.05% 40.55%
Unimodal audio features 81.94% 91.47% 64.16%
A-V feature fusion 80.42% 72.30% 54.41%
Coupled HMM 73.98% 85.44% 60.62%
Fusion using MHT-SBF 83.95% 91.97% 64.96%
Word 4 Word 5 Word 6
Reliability of video 11.31% 21.89% 39.93%
Reliability of audio 59.61% 85.60% 88.64%
Unimodal video features 10.92% 25.24% 43.50%
Unimodal audio features 64.91% 86.36% 90.84%
A-V feature fusion 35.93% 58.49% 56.88%
Coupled HMM 61.98% 79.44% 87.62%
Fusion using MHT-SBF 65.97% 87.28% 92.67%
exponential function, for large values of weight, difference in
the probabilities of different words is larger for video than
audio. So large value of the weighting factor γ,represents
more weight being given to video than audio. Out of the total
data available 80% of the data is used as training data and
remaining 20% as test data.
Recognition is performed on every word of the sentence
separately as well as on the whole sentence as continuous
speech recognition. Experiments were carried out for four
sets of noise conditions at an SNR 40 dB (clean), 30 dB,
20 dB, and 10 dB. Isolated word recognition results for all
the noise conditions are given in Tables 8, 9, 10,and11.
Figure 19, illustrates the bar chart of percentage word (letter
set) recognition rates for various signal to noise ratios using
unimodal video features, unimodal audio features, audio-
visual feature fusion, coupled HMM, and the MHT-SB
fusion methods. Similar plots are illustrated in Figure 20,for
12 EURASIP Journal on Advances in Signal Processing
Table 10: Percentage word recognition for speech at SNR of 20 dB.
Word 1 Word 2 Word 3
Reliability of video 52.33% 43.54% 44.04%
Reliability of audio 54.72% 78.34% 58.17%
Unimodal video features 50.33% 39.05% 40.55%
Unimodal audio features 53.35% 78.92% 57.00%
A-V feature fusion 56.67% 64.77% 48.97%
Coupled HMM 60.98% 72.44% 52.62%
Fusion using MHT-SBF 64.47% 79.80% 58.35%
Word 4 Word 5 Word 6
Reliability of video 11.31% 21.89% 39.93%
Reliability of audio 35.91% 60.66% 68.92%
Unimodal video features 10.92% 25.24% 43.50%
Unimodal audio features 37.25% 67.90% 72.25%
A-V feature fusion 26.7% 45.38% 50.06%
Coupled HMM 39.98% 64.44% 70.62%
Fusion using MHT-SBF 42.67% 69.87% 75.91%
Table 11: Percentage word recognition for speech at SNR of 10 dB.
Word 1 Word 2 Word 3
Reliability of video 52.33% 43.54% 44.04%
Reliability of audio 48.78% 64.12% 48.72%
Unimodal video features 50.33% 39.05% 40.55%
Unimodal audio features 48.95% 57.06% 51.51%
A-V Feature fusion 62.91% 59.61% 44.45%
Coupled HMM 60.98% 56.44% 49.62%
Fusion using MHT-SBF 64.63% 60.38% 52.87%
Word 4 Word 5 Word 6
Reliability of video 11.31% 21.89% 39.93%
Reliability of audio 18.92% 43.17% 49.70%
Unimodal video features 10.92% 25.24% 43.50%
Unimodal audio Features 17.60% 47.84% 55.67%
A-V feature fusion 17.98% 36.39% 48.01%
Coupled HMM 19.98% 47.44% 55.62%
Fusion using MHT-SBF 21.86% 50.56% 59.45%
digit recognition under various SNR for all the methods used
in this work.
5.5.3. Experimental Results As a Funct ion of the Weighting
Factor. As described in the prev ious section, the variable γ,
represents the weight being given to likelihood obtained from
the video modality, while making the combined decision. In
order to analyze the importance of the weight applied to the
video modality experiments are performed again for various
values of γ.Figures21, 22, 23,and24,showgraphsofpercent
word recognition against the weighting factor γ, as described
in (18), for different noise conditions.
5.5.4. Discussion on Audio-Visual Speech Recognition System
Performance. Speech recognition problem is more challeng-
ing than speaker diarization problem because it is a multiple
hypothesis problem. Moreover video information for speech
10
20 30
40
0
10
20
30
40
50
60
70
80
90
100
SNR (dB)
Unimodal video
Unimodal audio
A-V feature fusion
Coupled HMM
MHT-SB fusion
Recognition (%)
Figure 19: Recognition results for the letter set “A–Z, except W”.
10
20 30
40
0
10
20
30
40
50
60
70
80
SNR (dB)
Unimodal video
Unimodal audio
A-V feature fusion
Coupled HMM
MHT-SB fusion
Recognition (%)
Figure 20: Rec ognition results for the digit set “zero-nine”.
recognition case is even less reliable as many type of sounds
can be generated from one typ e of lip shape and different
speakers have different speaking styles. For clean speech,
audio provides excellent recognition results but with increase
in noise content, audio performance falls drastically. In high
noise conditions even this less reliable video information can
be quiet helpful in improving recognition results as listed in
Tab l es 8, 9, 10,and11. This is also illustrated in Figures 19
and 20. The results indicate that the proposed soft fusion
method performs reasonably better than the audio only
recognition results and recognition results of concatenated
audio-visual features. The weight given to video information
EURASIP Journal on Advances in Signal Processing 13
12345678910
50
55
60
65
70
75
80
85
90
95
Scale (video content in information fusion)
Word recognition (%)
Unimodal audio (40 dB SNR)
MHT-SB (40 dB SNR)
Unimodal audio (30 dB SNR)
MHT-SB (30 dB SNR)
Unimodal audio (20 dB SNR)
MHT-SB (20 dB SNR)
Unimodal audio (10 dB SNR)
MHT-SB (10 dB SNR)
Figure 21: Recognition results for word 1= “bin—lay—place—
set” as a function of the weight γ.
12345678910
Scale (video content in information fusion)
Word recognition (%)
Unimodal audio (40 dB SNR)
MHT-SB (40 dB SNR)
Unimodal audio (30 dB SNR)
MHT-SB (30 dB SNR)
Unimodal audio (20 dB SNR)
MHT-SB (20 dB SNR)
Unimodal audio (10 dB SNR)
MHT-SB (10 dB SNR)
20
25
30
35
40
45
50
55
60
65
70
Figure 22: Recognition results for word 4 = “A–Z, except W ” a s a
function of the weight γ.
12345678910
50
55
60
65
70
75
80
85
90
95
Scale (video content in information fusion)
Word recognition ( %)
Unimodal audio (40 dB SNR)
MHT-SB (40 dB SNR)
Unimodal audio (30 dB SNR)
MHT-SB (30 dB SNR)
Unimodal audio (20 dB SNR)
MHT-SB (20 dB SNR)
Unimodal audio (10 dB SNR)
MHT-SB (10 dB SNR)
Figure 23: Recognition results for word 5 = “zero-nine” as a
function of the weight γ.
12345678910
60
65
70
75
80
85
90
95
Scale (video content in information fusion)
Word recognition (%)
Unimodal audio (40 dB SNR)
MHT-SB (40 dB SNR)
Unimodal audio (30 dB SNR)
MHT-SB (30 dB SNR)
Unimodal audio (20 dB SNR)
MHT-SB (20 dB SNR)
Unimodal audio (10 dB SNR)
MHT-SB (10 dB SNR)
Figure 24: Recognition results for word 6 = “again—now—please
— soon” as a function of the weight γ.
14 EURASIP Journal on Advances in Signal Processing
alters the recognition results, according to its reliability. For
the example of, word 1
= “bin—lay—place—set”,the
reliability of video information is good (52.33%). In this case,
when video information is given a higher weight recognition
results improve, especially for noisy conditions, as shown
in Figure 21. Similar results illustrating the effect of the
weighting factor γ, on word recognition can also be seen in
Figures 22, 23,and24. In general, the weight of the individual
modalities can be set based on the reliability obtained for
each modality.
6. Conclusions
A methodology to fuse information from multiple modalities
using soft belief functions has been proposed for multi-
modal speech processing. This method uses a confusion
matrix of probability mass functions and combines both
the belief and ignorance computed from acoustic and visual
speech. As the experimental results show there is a significant
improvement in the system performance due to the use of
multiple modalities and subsequent soft fusion. This method
also provides a framework for soft fusion when compared
to the conventional probabilistic fusion framework used
in multi-modal speech applications. The results listed in
this paper are for a small vocabulary. Hence future work
will focus on potential application areas based on small
vocabulary recognition, such as assistive driving and assistive
living.
Acknowledgment
The work described in this paper was supported by BITCOE
and IIT Kanpur under project nos. 20080252, 20080253 and
20080161.
References
[1] M. Gentilucci and L. Cattaneo, “Automatic audiovisual inte-
gration in speech perception,” Experimental Brain Research,
vol. 167, no. 1, pp. 66–75, 2005.
[2]L.I.Kuncheva,Combining Pattern Classifiers: Methods and
Algorithms, Wiley, New York, NY, USA, 2004.
[3] J P. Thiran, F. Marques, and H. Bourlard, Multi Modal Signal
Processing: Theory and Applications for Human-Computer
Interaction, Academic Press, New York, NY, USA, 2010.
[4] A. Adjoudani and C. Benoit, “On the integration of auditory
and visual parameters in an hmm-based ASR,” in Proceedings
of NATO ASI Conference on Speechreading by Man and
Machine: Models, Systems and Applications,D.StorkandM.
Hennecke, Eds., pp. 461–472, 2001.
[5] C. Bregler and Y. Konig, “‘eigenlips’ for robust speech
recognition,” in Proceedings of the International Conference on
Acoustics, Speech and Signal Processing (ICASSP ’94), pp. 669–
672, 1994.
[6] C. Neti, G. Potamianos, J. Luettin et al., “Audio visual speech
recognition, final workshop 2000 report,” Tech. Rep., Center
for Language and Speech Processing, 2000.
[7] J S. Lee and C. H. Park, “Adaptive decision fusion for audio-
visual speech recognition,” in Speech Recognition, Technologies
and Applications, pp. 275–296, I-Tech, Vienna, Austria, 2008.
[8]A.V.Nefian,L.Liang,X.Pi,L.Xiaoxiang,C.Mao,andK.
Murphy, “A coupled HMM for audio-visual speech recogni-
tion,” in Proceedings of the IEEE International Conference on
Acoustic, Speech and Signal Processing (ICASSP ’02), pp. 2013–
2016, May 2002.
[9] G. Shafer, A Mathematical Theor y of Evidence,Princeton
University Press, Princeton. NJ, USA, 1976.
[10] G. Friedland, H. Hung, and C. Yeo, “Multi-modal speaker
diarization of real-world m eetings using compressed-domain
video features,” in Proceedings of the IEEE International
Conference on Acoustics, Speech, and Signal Processing (ICASSP
’09), pp. 4069–4072, April 2009.
[11] J. M. Pardo, X. Anguera, and C. Wooters, “Speaker diariza-
tion for multiple-distant-microphone meetings using several
sources of information,” IEEE Transactions on Computers,vol.
56, no. 9, pp. 1212–1224, 2007.
[12]I.McCowan,J.Carletta,W.Kraaijetal.,“TheAMImeeting
corpus,” in Proceedings of the 5th International Conference on
Methods and Techniques in Behavioral Research, September
2005.
[13] M.Cooke,J.Barker,S.Cunningham,andX.Shao,“Anaudio-
visual corpus for speech perception and automatic speech
recognition,” JournaloftheAcousticalSocietyofAmerica,vol.
120, no. 5, pp. 2421–2424, 2006.
[14]J.Ajmera,G.Lathoud,andI.McCowan,“Clusteringand
segmenting speakers and their locations in meetings,” in
Proceedings of IEEE International Conference on Acoustics,
Speech, and Signal Processing, pp. 605–608, May 2004.
[15] M. Visser, M. Poel, and A. Nijholt, “Classifying visemes for
automatic lipreading,” in Proceedings of the 2nd International
Wor kshop on Text, Speech and Dialogue,V.Matouseketal.,Ed.,
vol. 1692 of L ecture Notes in Computer Science, p. 843, Plzen,
Czech Republic, 1999.
[16] X. Wang, Y. Hao, D. Fu, and C. Yuan, “Audio-visual automatic
speech recognition for connected digits,” in Proceedings of
the 2nd International Symposium on Intelligent Information
Technology Application (IITA ’08), pp. 328–332, December
2008.
[17]P.Wiggers,J.C.Wojdel,andL.J.M.Rothkrantz,“Medium
vocabulary continuous audio-visual speech recognition,” in
Proceedings of the International Conference on Spoken Language
Processing (ICSLP ’02), 2002.
[18] T. J. Hazen, K. Saenko, C. H. La, and J. R. Glass, “A segment-
based audio-visual speech recognizer: data collection, devel-
opment, and initial experiments,” in Proceedings of the 6th
International Conference on Multimodal Interfaces (ICMI ’04),
pp. 235–242, October 2004.
[19] L. Liang, X. Liu, Y. Zhao, X. Pi, and A. V. Nefian, “Speaker
independent audio-visual continuous speech recognition,” in
Proceedings of the IEEE International Conference on Multimedia
and Expo, vol. 2, pp. 25–28, 2002.
[20] A. V. Nefian, L. Liang, X. Pi, X. Liu, and K. Murphy,
“Dynamic Bayesian networks for audio-visual speech recogni-
tion,” EURASIP Journal on Applied Signal Processing, vol. 2002,
no. 11, pp. 1274–1288, 2002.
[21] G. P otamianos, C. Neti, G. Gravier, A. Garg, and A. W. Senior,
“R ecent advances in the automatic recognition of audiovisual
speech,” Proceedings of the I EEE, vol. 91, no. 9, pp. 1306–1325,
2003.