Báo cáo hóa học: " Research Article Resource Allocation for Overlapping MBS Zones" potx
Bạn đang xem bản rút gọn của tài liệu. Xem và tải ngay bản đầy đủ của tài liệu tại đây (1006.67 KB, 10 trang )
Hindawi Publishing Corporation
EURASIP Journal on Wireless Communications and Networking
Volume 2011, Article ID 205612, 10 pages
doi:10.1155/2011/205612
Research Ar ticle
Resource Allocation for Overlapping MBS Zones
Ray-Guang C heng and Kuo-Jui Huang
Department of Electronic Engineering, National Taiwan University of Science and Technology, Taipei 10607, Taiwan
Correspondence should be addressed to Ray-Guang Cheng,
Received 27 October 2010; Accepted 12 February 2011
Academic Editor: George Tombras
Copyright © 2011 R G. Cheng and K J. Huang. This is an open access article distributed under the Creative Commons
Attribution License, which permits unrestricted use, distribution, and reproduction in any medium, provided the original work is
properly cited.
Multicast and broadcast service (MBS) is one of the important services for next-generation wireless systems. In WiMAX, the
radio resource unit (i.e., time, frequency, code, etc.) for MBS is centralized allocated by an anchor access service network gateway
(Anchor ASN-GW). In MBS, a BS can dynamically join or leave an MBS Zone due to the moving of MSs. The Anchor ASN-
GW must allocate nonoverlapping radio resource units to BSs for delivering different MBS contents in overlapping MBS Zones.
This paper presents radio resource allocation and reallocation algorithms to minimize the number of required resource units for
overlapping MBS Zones. For a given number of MBS Zones, a resource estimation model is also presented to estimate the average
number of radio resource units to be reserved by the ASN-GW. Simulation results showed that the proposed algorithms can reduce
the number of reallocations, and, thus, the signaling messages exchanged in the air interface and the core network are minimized.
The results also showed that the proposed model can be used as a good reference for the network operator to estimate the average
number of required radio resource units for a given number of MBS Zones.
1. Introduction
Multicast and broadcast service (MBS), or multimedia
broadcast/multicast services (MBMS), is one of the impor-
tant services to be supported by the next generation cellular
systems. MBS is a point-to-multipoint service, where data
packets are transmitted simultaneously from a single source
to multiple destinations [1]. MBS provides an efficient usage
of radio/spectrum resources via transmitting the same data
through a common broadcast or multicast channel. Potential
MBS services include streaming services, file download ser-
vices, and carousel services (combination of streaming and
file download services aspects with repetition and update to
reflect changing circumstances) [2].
Normally, the MBS content is transmitted over a geo-
graphical area identified as a zone. A cluster of base stations
(BSs) that transmit the same content in a zone is referred to
as an MBS Zone. In an MBS Zone, the contents are identified
by the same identifiers (IDs) and security association (SA)
[3]. Hence, a mobile station (MS) in either connected state
or idle state can continue to receive the content within the
MBS Zone without reestablishing an MBS connection [1].
For MBS Zone containing multiple BSs, it can be operated
in either macro-diversity or non-macro-diversity operating
mode. In macro-diversity operating mode, all BSs belonging
to the same MBS Zone should be synchronized at the symbol
level (i.e., with timing errors within the cyclic prefix length)
to transmit identical MBS contents using the same modula-
tion and coding [4]. In non-macro-diversity operating mode,
synchronized transmission is not required, but the same
MBS content is coordinated to be transmitted in the same
frame.
Each BS could be a member of more than one MBS Zone.
Two MBS Zones are overlapped if there is at least one BS
belonging to both zones [5]. In MBS, a BS can dynamically
join or leave an MBS Zone due to the moving of MSs. A BS
may decide to join a nearby MBS Zone if a user requests
for a new MBS service that is not existed in this cell but is
available at this MBS Zone. In contrast, a BS which serves no
MS may not have to deliver MBS content. As a result, the BS
may decide to leave an MBS Zone and release the occupied
radio resource.
2 EURASIP Journal on Wireless Communications and Networking
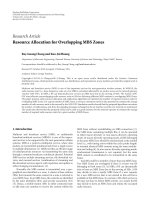
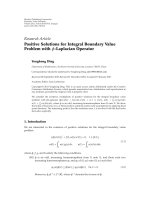
Figure 1 shows an example of three overlapped MBS
Zones. For each MBS Zone, an access service network gate-
way (ASN-GW) is responsible for controlling and allocating
radio resource (i.e., which is defined in terms of time and
subchannels) for its subordinate BSs. For the network
with multiple MBS Zones, the allocation is done by an
Anchor ASN-GW [6]. In Anchor ASN-GW, a coordinating
scheduling function is used to coordinate the transmission
of MBS content across the entire set of the BSs that belong
to the same MBS Zone. It has to reserve nonoverlapping
radio resource units such that BSs belonging to multiple
MBS Zones may transmit individual MBS content without
confliction. There are two main constraints for allocating
radio resources for MBS. First, the same radio resource
unit may not be allocated to BSs to deliver more than
one MBS content simultaneously. Second, the number of
radio resource units required by the MBS Zones should be
minimized.
The conflict-free radio resource allocation problem can
be generally modeled as a vertex coloring problem [5].
Coloring is an NP-complete problem for arbitrary random
generated graphs [7]. Several approaches have been proposed
to reduce the complexity via adding certain constraints. Woo
et al. [8] proposed a method to divide a bus network into
a number of subnetworks such that nonconflicting requests
can be processed concurrently. A vertex coloring algorithm
is then used to enable parallel communications. Walczak
and Wojciechowski [9] proposed a scheduling method in
multihop packet radio networks. They used a DSATUR
graph coloring algorithm to determine a virtual path and
find the conflict-free optimal scheduling. Zheng and Hoang
[7] modeled the overlapping WLANs as a planar graph and
used the Distance-1 vertex coloring technique to find the
minimum number of reuse groups. In these approaches, the
authors mainly focus on graphs with limited colors (e.g.,
two colors are considered in [8], and at most four colors
are involved in [7]). In addition, the topologies considered
in these approaches are rarely changed.
Similarly, the radio resource allocation in overlapping
MBS Zones can also be modeled as a vertex coloring prob-
lem. However, each BS may have to transmit multiple MBS
contents in a single frame, and thus results in a rather
complex topology. The topology may also be dynamically
changed due to the moving of MSs. Hence, existing meth-
ods cannot be directly applied here. This paper presents
radio resource allocation and reallocation algorithms for
overlapping MBS Zones. In initialization, the Anchor ASN-
GW uses the radio resource allocation algorithm to allocate
radio resource unit for a given topology. A radio resource
reallocation algorithm is then used to minimize the reallo-
cated resource units due to the change of topology. The key
point in this paper is the proposed reallocation algorithm
utilizing colors assigned in the previous round to reduce
the amount of color reassignment. The reduction in the
number of reallocated resource units not only reduces the
computational complexity but also minimizes the signaling
overhead exchanged in the air interface and the core network.
The rest of the paper is organized as follows. In Section 2,
a system model is presented, and the proposed radio resource
ASN-GW 2
MBS Zone 1
MBS Zone 2
MBS Zone 3
BS
ASN-GW 4
ASN-GW 5
ASN-GW 1
Anchor
ASN-GW
ASN-GW 3
Figure 1: MBS Zones and their associated Anchor ASN-GW.
allocation and reallocation algorithms are elaborated. In Sec-
tion 3, a resource estimation model is proposed to estimate
the average number of radio resource units to be reserved
for a given number of MBS Zones. Simulation results were
shown in Section 4. The number of reallocated resource
units and the computational complexity of the proposed
radio resource allocation algorithms were investigated. The
accuracy of the proposed resource estimation model was also
verified. Section 5 summarizes the paper.
2. System Model
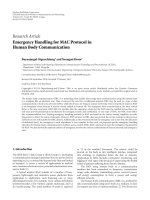
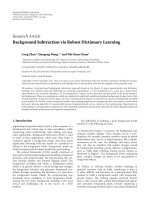
Figure 2 shows the system model used in this paper [10]. In
this model, the topology of MBS Zones is represented by an
undirected labeled graph, where each vertex represents an
MBS Zone and the edge connecting two vertices indicates
the overlapping of two MBS Zones [5]. The conflict-free
radio resource allocation for overlapping MBS Zones can
then be modeled as a vertex coloring problem, where each
color represents a radio resource unit. The graph should be
colored in a way that no two adjacent vertices share the same
color.
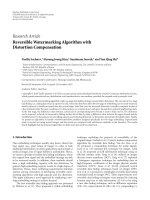
Note that different topologies may map to the same non-
isomorphic graph as shown in Figure 3.InFigure3,four
network topologies map to the same nonisomorphic graph.
Therefore, the resource allocation for these topologies is
identical. In other words, the resource allocation in overlap-
ping MBS Zones is to deal with the coloring problem for
Nonisomorphic graph.
In this paper, an N
× N adjacency matrix X (X
N×N
)is
used herein to represent the interconnectivity for a given
topology containing N MBS Zones. Let x
i,j
be the ith row
and the jth column element of X.Thenweset
x
i,j
=
⎧
⎨
⎩
1, if MBS Zone i and MBS Zone j is overlapped,
0, otherwise.
(1)
EURASIP Journal on Wireless Communications and Networking 3
Note that the adjacency matrix X is symmetric; that is,
x
j,i
= x
i,j
. The purpose of the radio resource allocation and
reallocation algorithms is to find the resource unit vector
(coloring vector)
c
X
for X such that the used resource units
are minimized.
The proposed radio resource allocation algorithm allo-
cates radio resource units to each MBS Zone according
to their degree. Therefore, conventional greedy coloring
algorithms (e.g., Welsh-Powell algorithm [11]) can be easily
adopted to determine the resource unit vector for a given
MBS Zone topology. However, the radio resource reallo-
cation algorithm further considers the correlation between
the old and the new MBS Zone topologies to minimize
the number of reallocated resource units. Hence, it will
only re-allocate the radio resource to those MBS Zones
with modified edges. In the following, a matrix operation is
proposed for Anchor ASN-GW to implement the allocation
algorithm.
The steps implementing the radio resource allocation/
reallocation algorithms are summarized as follows.
2.1. Radio Resource Allocation Algorithm
Step 1. For a given N
× N adjacency matrix X (X
N×N
), set
x
i,i
= 0, for i ∈{1, N}.
Step 2. Find a degree vector
d
X
= [d
1
d
2
d
3
···d
N
]of
matrix X,whichisdefinedas
d
i
=
N
j=1
x
i,j
. (2)
Step 3. Assign one resource unit to each MBS Zone.
Substep 1. Initially, every vertex is uncolored. Let C
0
=−1 ·
X.
Substep 2. Assign resource unit 1 to MBS Zone n (i.e., set
c
n,n
= 1) if MBS Zone n has the maximum degree (i.e., d
n
=
arg max
i
d
i
,1≤ i ≤ N, d
i
∈
d
X
). Construct C
1
by replacing
the following elements in C
0
:
c
i,n
= c
n,n
,ifc
i,n
=−1, i ∈{1, N},
c
n,j
= c
n,n
,ifc
n,j
=−1, j ∈{1, N}.
(3)
Substep 3. Assign a used resource unit to MBS Zone m (set
c
m,m
= 1 if resource unit 1 is assigned) if the unassigned MBS
Zone m has the maximum degree (i.e., d
m
= arg max
i
d
i
,1≤
i ≤ N, i
/
=n, d
i
∈
d
X
) and does not yet have a neighbor
with the used color. Construct C
2
by replacing the following
elements in C
1
:
c
i,m
= c
m,m
,ifc
i,m
=−1, i ∈{1, N},
c
m,j
= c
m,m
,ifc
m,j
=−1, j ∈{1,N}.
(4)
Substep 4. Repeat Substep 3 using extra resource unit until
each vertex is assigned a resource unit (i.e., c
i,i
/
=0, i ∈
{
1, N}). C
N
is obtained. Note that color p can be assigned
to MBS Zone q (i.e., set c
q,q
= p) if and only if
c
q,q
/
=c
i,q
,ifc
i,q
/
=0or − 1, i ∈{1, N},
c
q,q
/
=c
q, j
,ifc
q, j
/
=0or − 1, for j ∈{1, N}.
(5)
Construct C
k
by replacing the following elements in C
k−1
:
c
i,q
= c
q,q
,ifc
i,q
=−1, i ∈{1, N},
c
q, j
= c
q,q
,ifc
q, j
=−1, j ∈{1, N}.
(6)
Step 4. The resource unit vector set is
c
X
= diag (C
N
).
2.2. Radio Resource Reallocation Algorithm
Step 1. Given the original adjacency matrix X.Setthe
resource unit reduction flag F
C
= 0. Determine the
adjacency matrix Y and its degree vector
d
Y
for the updated
MBS Zones. Let y
i,j
be the ith row and the jth column
element of Y,where
y
i,j
=
⎧
⎨
⎩
1, if MBS Zone i and MBS Zone j is overlapped,
0, otherwise,
d
i
=
N
j=1
y
i,j
.
(7)
Step 2. Determine C
N
= C
N
+ k · (X − Y ), where C
N
is
the color matrix of the previous MBS Zones, C
N
is the color
matrix of the current MBS Zones, and k is a given constant
that is no less than N.
Step 3. Focus on only the MBS Zones that have updated their
topology, which are indicated by the non-zero elements in
d
X−Y
(i.e., the degree vector of matrix X−Y).Note that newly
added edges are indicated by elements with negative value in
d
X−Y
, while newly deleted edges are indicated by elements
with positive value in
d
X−Y
. Start from the MBS Zone m that
has the maximum value in
d
Y
,thatis,d
m
= arg max
i
d
i
,1≤
i ≤ N, d
i
∈
d
Y
.
For elements in the mth row/column in C
N
that is
negative (i.e., c
m,i
< 0orc
j,m
< 0, 1 ≤ i, j ≤ N,which
represents newly added edges), use the color number used
by zone m (i.e., c
m,m
) to replace this element; that is,
c
m,i
= c
m,m
,ifc
m,i
< 0, i, m ∈{1, N},
c
j,m
= c
m,m
,ifc
j,m
< 0, j, m ∈{1,N}.
(8)
The reallocation may result in a conflicted decision at MBS
Zone n if the two zones are overlapped and use the same
resource unit; that is, c
n,n
= c
m,m
and c
n,m
/
=0.
4 EURASIP Journal on Wireless Communications and Networking
MBS Zone
1
MBS Zone
2
MBS Zone
3
MBS Zone 3
MBS Zone 4
MBS Zone 5
BS
MBS Zone 1
MBS Zone 2
MBS Zone
5
MBS Zone
4
Figure 2: System model.
1
3
2
1
3
2
1
3
2
2
2
1
1
3
3
Figure 3: Different topologies maps to the same nonisomorphic
graph.
If conflicted decision is found, we may either
(i) reset the resource unit of MBS Zone n (i.e., set
c
n,n
= 0 to zero) and then perform the radio resource
allocation algorithm for those c
n,n
= 0, or
(ii) assign a nonconflicted resource unit (try to find
a used resource unit first and may use a new resource
unit if no used resource units can be selected) to MBS
Zone n (i.e., set it to a resource unit number).
For elements in the mth row/column in C
N
that is greater
than N (i.e., c
m,i
>N,1≤ i ≤ N, which represents newly
deleted edges), set its value to zero (i.e., c
i,m
= 0orc
m,j
= 0),
and set F
C
= 1 (it indicates that some edges may be removed
later).
Step 4. Repeat the process performed in Step 3 based on non-
increasing order of degree of the MBS Zone until all elements
in C
N
are positive and none of them is greater than N.Then
utilize Step 2 of the radio resource allocation algorithm to
deal with MBS Zones that do not assign resource units (i.e.,
c
k,k
= 0forsomek ∈{1,N}).
Step 5. Execute this step only if F
C
= 1. For those MBS
Zones that remove their edges, try to reuse a nonconflict
resource unit used by another MBS Zone that does not
remove its edge. Repeat this process until those MBS Zones
are all examined.
Step 6. The reallocated resource unit vector is
c
Y
= diag (C
N
).
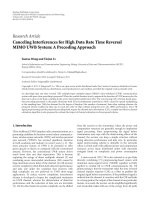
An example illustrating the proposed radio resource
reallocation algorithm with N
= 5andk = 5is
shown in Figure 4. Initially, the resource unit vector is
c
X
={23122}. Follow the steps of the resource
reallocation algorithm, the updated resource unit vector
can be found as
c
Y
={23123}. Hence, only one
resource unit is reallocated. In contrast, the updated resource
unit vector can also be found using the resource allocation
algorithm, which gives
c
Y
={21123},andthe
reallocated resource unit increases to two.
Note that each distinct number in the resource unit
vector represents a unique resource unit. For N MBS Zones,
the maximum number of required radio resource units is N.
Hence, the number of reallocated resource units, R, due to
the change of topology can be calculated by
R
= N −
N
i=1
δ
c
i,i
−c
i,i
,whereδ
(
x
)
=
⎧
⎨
⎩
1, if x = 0,
0, if x
/
=0.
(9)
3. Resource Estimation Mo del
In this section, a resource estimation model is proposed
to estimate the average number of radio resource units
to be reserved for a given number of MBS Zones. It
was found in Section 2 that two different topologies with
identical nonisomorphic graph require the same number of
radio resource units; that is, the number of required radio
resource units for a given number of MBS Zones depends
EURASIP Journal on Wireless Communications and Networking 5
Old MBS Zone
topology:
MBS 1 MBS 2
MBS 5 MBS 4
MBS 3
54
12
3
New MBS Zone
topology:
Step 1:
The original
adjacency
matrix: X
=
⎡
⎢
⎢
⎢
⎢
⎢
⎣
01100
10100
11011
00100
00100
⎤
⎥
⎥
⎥
⎥
⎥
⎦
The color matrix
of the previous
MBS Zones: C
5
=
⎡
⎢
⎢
⎢
⎢
⎢
⎣
22100
23100
11111
00120
00102
⎤
⎥
⎥
⎥
⎥
⎥
⎦
c
x
= diag(C
5
) =
23122
The adjacency
matrix: Y
=
⎡
⎢
⎢
⎢
⎢
⎢
⎣
01100
10000
10011
00101
00110
⎤
⎥
⎥
⎥
⎥
⎥
⎦
Degree vector:
d
Y
=
21322
,
(a)
Step 2:
The color matrix of the current
MBS Zones: C
5
= C
5
+(X −Y) ×5 =
⎡
⎢
⎢
⎢
⎢
⎢
⎣
21100
13100
11111
00120
00102
⎤
⎥
⎥
⎥
⎥
⎥
⎦
+
⎛
⎜
⎜
⎜
⎜
⎜
⎝
⎡
⎢
⎢
⎢
⎢
⎢
⎣
01100
10100
11011
00100
00100
⎤
⎥
⎥
⎥
⎥
⎥
⎦
−
⎡
⎢
⎢
⎢
⎢
⎢
⎣
01100
10000
10011
00101
00110
⎤
⎥
⎥
⎥
⎥
⎥
⎦
⎞
⎟
⎟
⎟
⎟
⎟
⎠
×
5 =
⎡
⎢
⎢
⎢
⎢
⎢
⎣
221 0 0
236 0 0
161 1 0
001 2
−5
000
−52
⎤
⎥
⎥
⎥
⎥
⎥
⎦
(b)
Step 3:
C
5
=
⎡
⎢
⎢
⎢
⎢
⎢
⎣
221 0 0
230 00
1 0 11 1
001 2
−5
001
−5 2
⎤
⎥
⎥
⎥
⎥
⎥
⎦
−→
C
5
=
⎡
⎢
⎢
⎢
⎢
⎢
⎣
221 0 0
230 0 0
101 1 1
001 2
−5
001
−5 2
⎤
⎥
⎥
⎥
⎥
⎥
⎦
−→
C
5
=
⎡
⎢
⎢
⎢
⎢
⎢
⎣
22100
23000
10111
00122
00122
⎤
⎥
⎥
⎥
⎥
⎥
⎦
,
d
Y
=
21322
(c)
Steps4,5:
C
5
=
22100
23000
10111
00122
00123
(d)
21:6petS
5
4
3
c
Y
= diag(C
5
).
∴
c
x
=
23123
(e)
Figure 4: The procedure of the radio resource reallocation algorithm.
6 EURASIP Journal on Wireless Communications and Networking
on the number of nonisomorphic graphs. The number of
nonisomorphic graphs for a given number of vertices can be
found by calculating the cycle index (Z) of the permutation
group using P
´
olya enumeration theorem (PET) [12]. In PET,
a generating function g
p
(x)foragraphwithp vertices is
defined as [13]
g
p
(
x
)
=
m
q=0
g
p,q
x
q
, (10)
where m
=
p
2
and g
p,q
are the number of nonisomorphic
graphs with p vertices and q edges, respectively. g
p
(x)canbe
rewritten as a function of the cycle index Z,thatis,
g
p
(
x
)
= Z
S
(2)
p
,1+x
. (11)
For example, a cycle index formula for pair groups (S
(2)
)with
4 vertices is given by [13]
Z
S
(2)
4
=
1
24
s
6
1
+
3
8
s
2
1
s
2
2
+
1
3
s
2
3
+
1
4
s
2
s
4
, (12)
where
s
1
= x +1,s
2
= x
2
+1, , s
m
= x
m
+1. (13)
In this case, the generating function g
p
(x) of the nonisomor-
phic graphs can be derived based on PET and is given by
g
4
(
x
)
=
1
24
(
x +1
)
6
+
3
8
(
x +1
)
2
x
2
+1
2
+
1
3
x
3
+1
2
+
1
4
x
2
+1
x
4
+1
.
(14)
Equation (14) can be reduced as
g
4
(
x
)
= 1+x +2x
2
+3x
3
+2x
4
+ x
5
+ x
6
. (15)
According to the definition of the polynomial given in
(10), the possible number of nonisomorphic graphs for
agraphof4verticeswithdifferent edges can be obtained
from (15); that is, it has one nonisomorphic graph with zero
edge, one nonisomorphic graph with one edge, two noniso-
morphic graphs with two edges, three nonisomorphic graphs
with three edges, two nonisomorphic graphs with four
edges, one nonisomorphic graph with five edges, and one
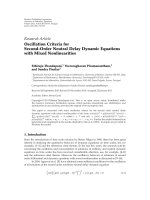
nonisomorphic graph with six edges, as shown in Figure 5.
From Figure 5, it was found that there are six nonisomorphic
graphs that require two colors. In other words, six kinds of
MBS Zone topologies require two radio resource units.
The number of nonisomorphic graphs with different
edges for a given number of MBS Zones can be determined
from the generating function g
p
(x)givenin(10). Table 1
summarizes the number of nonisomorphic graphs with
different edges for a given number of MBS Zones. The
number of radio resource units required for each noniso-
morphic graph can then be determined by using the resource
allocation algorithm proposed in Section 2. The results are
summarized in Figure 6.InFigure6, the notation of m
× n
Table 1: The number of nonisomorphic graphs for a given number
of MBS Zones with different edges.
No. of MBS Zones
No.ofedges12345 6 7
0 11111 1 1
1111111
212222
313455
426910
5161521
6162141
7 4 24 65
8 2 24 97
9 1 21 131
10 1 15 148
11 9 148
12 5 131
13 2 97
14 1 65
15 1 41
16 21
17 10
18 5
represents that there are n different nonisomorphic graphs
and each of them requires m radio resource units.
Assume that each nonisomorphic graph for a graph with
p vertices occurred with an equal probability. Define P
M,N
as
the probability of a nonisomorphic graph using M resource
units in N MBS Zones (i.e., M
≤ N). Hence, P
M,N
can be
calculated by
P
M,N
=
M resource units required by N MBS Zones
Total number of nonisomorphic graphs in N MBS Zones
.
(16)
The denominator part of (16) can be found by setting x
= 1
and p
= N in the generating function g
p
(x)in(10). In the
above example, g
4
(1) = 11. The numerator part of (16)can
be calculated based on Figure 6.Finally,P
M,N
is derived for
N
= 1to7,andtheresultsaresummarizedinTable2.
For example,
P
1,4
=
1
11
= 0.091,
P
2,4
=
6
11
= 0.545,
P
3,6
=
84
156
= 0.5385.
(17)
Let U(N) be the average number of radio resource units
required by N MBS Zones. U(N)canbeobtainedby
U
(
N
)
=
N
M=1
P
M,N
×M. (18)
EURASIP Journal on Wireless Communications and Networking 7
Figure 5: The eleven nonisomorphic graphs for a graph with 4 vertices.
2
×
13
2
×
13
3
×
21
3
×
49
3
×
78
3
×
64
3
×
29
3
×
10
3
×
110
4
×
28
4
×
43
4
×
62
4
×
63
4
×
46
4
×
26
3
×
115
3
×
103
2
×
19
2
×
14
3
×
14
3
×
18
3
×
19
3
×
14
Number
of MBS
Zones
Number
of edges
1
0
1
1
×
1
1
×
1
1
×
11
×
11
×
11
×
1
2
×
1
2
×
1
2
×
1
2
×
2
2
×
3
2
×
6
2
×
8
2
×
7
2
×
4
2
×
4
2
×
1
2
×
1
2
×
12
×
1
2
×
1
2
2
2
×
1
3
3
3
×
13
×
1
3
×
1
3
×
1
4
×
1
4
×
1
5
5
5
×
1
5
×
1
5
×
1
5
×
1
5
×
4
5
×
6
5
×
3
5
×
6
5
×
9
5
×
11
5
×
11
5
×
1
6
6
6
×
1
6
×
1
6
×
1
6
×
1
6
×
1
6
×
1
6
×
1
7
×
1
5
×
1
5
×
1
5
×
1
5
×
1
4
×
1
4
×
1
4
×
2
4
×
4
4
×
6
4
×
14
4
4
×
1
4
×
1
4
×
8
4
×
1
4
×
1
4
×
2
4
×
6
4
×
15
4
×
3
4
×
3
4
×
6
4
×
8
3
×
3
3
×
3
3
×
2
3
×
6
3
×
1
3
×
1
3
×
1
3
×
2
3
×
5
3
×
1
3
×
1
3
×
3
3
×
2
3
×
1
3
×
2
3
×
8
3
×
7
7
7
2
×
1
2
×
2
2
×
2
2
×
22
×
3
2
×
4
2
×
4
2
×
6
2
×
8
8
9
10
11
12
13
14
15
16
17
18
19
20
21
2
×
22
×
2
1
×
1
2
×
1
2
×
2
Figure 6: The number of nonisomorphic graphs (n) and the required radio resource units per nonisomorphic graph (m) for overlapping
MBS zones, m
×n.
With (18), the network may adjust the number of reserved
radioresourceunitsbasedonagivennumberofMBSZones.
4. Simulation Results
Simulations were conducted on top of a C-based simulation
platform to verify the effectiveness of the proposed method.
In the simulation, N MBS Zones were investigated. Each
sample was obtained by averaging 10000 outcomes, and
each outcome was collected based on the result of an initial
topology and a new topology. The initial topology was
randomly generated such that every two MBS Zones may
be connected with a probability 0.5. The initial topology is
then modified to be a new topology in order to evaluate
the effectiveness of the radio resource reallocation algorithm.
Three topology modification scenarios were considered in
evaluating the effectiveness of the proposed radio resource
allocation algorithm. In Scenario I, the new topology is
randomly generated, and, thus, there is no correlation
between the two topologies. In Scenario II, the new topology
is modified by adding/removing an edge to/from the initial
topology. In Scenario III, two-edge modifications are pre-
formed for the initial topology. In the simulation, the radio
resource of the initial topology is always allocated by using
8 EURASIP Journal on Wireless Communications and Networking
Table 2: The probability of a nonisomorphic graph using M
resource units in N MBS Zones, P
M,N
.
N
M 123 4 5 6 7
1 1 0.5 0.25 0.091 0.0294 0.0064 0.000958
2N/A 0.5 0.5 0.545 0.382 0.218 0.0814
3N/A N/A 0.25 0.273 0.441 0.539 0.569
4 N/A N/A N/A 0.091 0.118 0.198 0.2912
5 N/A N/A N/A N/A 0.0294 0.032 0.0508
6 N/A N/A N/A N/A N/A 0.0064 0.00575
7 N/A N/A N/A N/A N/A N/A 0.000958
1
2
3
4
5
7
6
Mean of reallocated
resource unit (E[R])
34567
MBS Zones (N)
Three scenarios
Random
No Reallocation
One
Edge No Reallocation
Two
Edges No Reallocation
Random
Reallocation
One
Edge Reallocation
Two
Edges Reallocation
Figure 7: Performance of the radio resource reallocation algorithm.
the proposed radio resource allocation algorithm. However,
the radio resource of the new topology may be allocated by
using the proposed radio resource allocation or reallocation
algorithm. The performance of the reallocation algorithm
is measured in terms of the number of reallocated resource
units R, which can be calculated from (9). In the simulation,
the number of radio resource units found in the allocation
and reallocation algorithms is the same as the optimal value
that can be found by a greedy coloring algorithm.
Figure 7 shows the performance of the radio resource
reallocation algorithm for the three topology modification
scenarios. In this figure, dotted lines were used to indicate
results if reallocation algorithm is adopted. In contrast, the
solid lines were used to indicate results without adopting
reallocation algorithm. It was found that the average number
of reallocated units is proportionally increased with N if
reallocation algorithm is not used. It is because a higher N
generally requires more radio resource units. In contrast, the
average number of reallocated units found by the reallocation
algorithm always results in less reallocated resource units in
all of the three scenarios.
In Scenario I, the performance of the reallocation algo-
rithm is not significant due to the lack of correlation between
the initial and new topologies. However, the reallocation
0
0.1
0.2
0.3
0.4
0.5
Probability
01234567
Number of reallocated resource unit (R)
Random graph
N
= 3 Reallocation
N
= 4 Reallocation
N
= 5 Reallocation
N
= 6 Reallocation
N
= 7 Reallocation
Figure 8: Probability density function of R: random graph scenario.
0
0.1
0.2
0.3
0.4
0.5
0.6
0.7
0.8
Probability
01234567
Number of reallocated resource unit (R)
Modify one edge
N
= 3 Reallocation
N
= 4 Reallocation
N
= 5 Reallocation
N
= 6 Reallocation
N
= 7 Reallocation
Figure 9: Probability density function of R: one-edge modification.
algorithm still has a better result. It is because reallocated
algorithm always reuses the resources allocated to the initial
topology. Therefore, less modification is needed. Significant
improvement can be found in Scenario II and Scenario III.
In these cases, the number of reallocated resource units does
not change with the increasing of N. It is mainly due to the
high correlation between the two topologies.
Figures 8 to 10 show the probability density functions for
the number of reallocated resource units for the three topol-
ogy modification scenarios. Figure 8 shows the probability
density function of the reallocated resource units, R,required
by a randomly generated new topology for different values
of N. It can be found that the possible value of R is in the
range from 0 to (N
− 1) because the reallocation algorithm
can always reuse one of the radio resources assigned to the
initial topology.
Figure 9 demonstrates the results of a new topology with
one-edge modification. The maximum number of reallo-
cated resource units is one because only one edge is modified.
In the application, the topology of MBS Zones is changed
if any one of its edges is modified. Hence, we may use
the correlation between the two topologies to minimize the
number of reallocated resource units and, thus, reduce the
signaling overhead. In this figure, it can also be found that
EURASIP Journal on Wireless Communications and Networking 9
0
0.1
0.2
0.3
0.4
0.5
0.6
Probability
01234567
Number of reallocated resource unit (R)
Modify two edges
N
= 3 Reallocation
N
= 4 Reallocation
N
= 5 Reallocation
N
= 6 Reallocation
N
= 7 Reallocation
Figure 10: Probability density function of R: two-edge modifica-
tions.
0
5
10
15
20
25
Average number of changed
elements
34567
MBS Zones (N)
Computational complexity
Allocation algorithm
Reallocation algorithm
Figure 11: Computational complexity of the proposed algorithms.
the probability of reallocated one resource unit increases if N
decreases. It is because the impact of topology modification
is significant for smaller N. Note that no resource unit
reallocation is needed in more than 50% of the one-edge
topology modification cases.
Similar result for the two-edge modification was shown
in Figure 10. In this case, the number of reallocated resource
units may not exceed two. The probability of re-allocating
two resource units is still less than 0.15 for all values of
N. Even in this case, more than 40% of the two-edge
modifications do not incur any resource reallocation.
The computational complexity of the proposed resource
allocation and reallocation algorithm was illustrated in
Figure 11. The computational complexity is measured in
terms of the number of changed elements in the adjacency
matrix for the initial and the new topology. Due to the
symmetric property of the adjacency matrix, only the
elements in the upper triangular of the adjacency matrix are
counted. The worst case performance was investigated (i.e.,
the new topology is randomly generated), and the results
show that the reallocation algorithm may reduce about 50%
of the complexity than that of the allocation algorithm.
The accuracy of the proposed resource estimation model
was then investigated. In the first simulation, the initial
1.5
2
2.5
3
3.5
Mean of resource unit
34567
MBS Zones (N)
Mean of resource unit versus MBS Zones
Analysis
Simulation
Figure 12: Average number of the required radio resource units in
different MBS Zones.
0
10
20
30
40
50
60
70
Number of graphs (%)
1234
Used resource unit (M)
Nonisomorphic graph distribution with N
= 4
No
edge
Edge
2 2
Edge
4 2
Edge
5
Analysis
Edge
1
Edge
3 1
Edge
3 2
Edge
6
Edge
2 1
Edge
3 3
Edge
4 3
Simulation
Figure 13: Eleven nonisomorphic graphs for a graph with four
vertices.
topology of N MBS Zones was randomly generated. Each
MBS Zone was assumed to connect to another MBS Zone
with probability 0.5. A random graph scenario was simulated
for N from3to7.Figure12 showed the average numbers
of radio resource units required for different numbers of
MBSZones.Itwasfoundthatthereisnobigdifference
between the analytical and simulation results. Hence, the
proposed estimation model may be used as a good reference
for reserving the radio resource from the mean-value point
of view. The detailed statistics were further explored, and
the results were shown in Figure 13.InFigure13,the
number of resource required for each nonisomorphic graph
for a network with four MBS Zones (i.e., N
= p = 4)
was investigated. The results of eleven nonisomorphic
graphs were presented. In this figure, Edge
2 1 refers to
the nonisomorphic graph with two edges and needs one
color. The simulation and analysis results included all
nonisomorphic graphs requiring the same resource unit.
10 EURASIP Journal on Wireless Communications and Networking
It was found that, although the analysis coincides with the
simulation results from the mean-value point of view, the
simulation and analysis do not follow the same distribution.
It implies that the uniformly distribution assumption for
the nonisomorphic graph is oversimplified. The simulation
results further showed that each nonisomorphic graph will
not generate with an equal probability.
5. Conclusion
This paper presents methods to allocate and re-allocate
radio resource units for overlapping MBS Zones. We use an
adjacency matrix to represent the topology of overlapping
MBS Zones. A radio resource allocation algorithm is first
proposed to allocate radio resource units to an arbitrary
topology containing N MBS Zones. A radio resource reallo-
cation is then proposed to re-allocate resource in response
to the changing of MBS Zone topology. The reallocation
algorithm utilizes the correlation between the old and the
new topologies to minimize the number of reallocated
resource units. It reduces the computational complexity as
well as the signaling overhead in the air interface and the core
network. This paper further presents an estimation model to
estimate the mean of resource unit in overlapping MBS Zone.
The estimation is obtained based on a simple assumption
that each nonisomorphic graph is generated with an equal
probability.
Simulations were conducted to evaluate the effectiveness
of the proposed algorithms. It was found that the proposed
resource reallocation algorithm may greatly reduce the
number of reallocated resource units for various topology
modification scenarios. The performance of the reallocation
algorithm is significant if only one or two edges of a given
topology are modified. It can also be found that more than
40% of the two-edge modifications do not incur any resource
reallocation. The worst case study of the computation com-
plexity further shows that the proposed resource reallocation
algorithm may reduce about 50% of the complexity than
that of the allocation algorithm. The results also showed that
the proposed model can be used as a good reference for the
network operator to estimate the average number of reserved
radio resource units during MBS initialization.
Acknowledgments
This work was supported in part by the National Science
Council, Taiwan, under Contract NSC 98-2219-E-011-005,
99-2219-E-011-005 and by the Information and Com-
munications Research Laboratories, Industrial Technology
Research Institute.
References
[1] T.Jiang,W.Xiang,H.H.Chen,andQ.Ni,“Multicastbroad-
cast services support in OFDMA-based WiMAX systems,”
IEEE Communications Magazine, vol. 45, no. 8, pp. 78–86,
2007.
[2] M. Knappmeyer and R. Toenjes, “Adaptive data scheduling for
mobile broadcast carousel services,” in Proceedings of the IEEE
65th Vehicular Technology Conference (VTC ’07), pp. 1011–
1015, April 2007.
[3] “IEEE standardfor LAN/MAN; part 16: air interface for fixed
and mobile broadband wireless access systems;amendment 2:
physical and medium access control layers for combined fixed
and mobile operation in licensedbands and corrigendum 1,”
IEEE Std. 802.16e-2005, February 2006.
[4] J. Mandin and Y. Leiba, “MBS (Multicast and Broadcast Ser-
vice) enhanced for macro-diversity reception,” IEEEC802.16e-
04/275r1, August 2004.
[5] Alvarion and Starent Networks, “MCBCS synchronous trans-
mission support over WiMAX network,” WiMAX Forum
Contribution 01328
r000, September 2008.
[6] “MCBCS
DSx Stage2 Working Baseline,” WiMAX Forum
Network Working Group Contribution 01358
r003, Novem-
ber, 2008.
[7] L. Zheng and D. B. Hoang, “Applying graph coloring in
resource coordination for a high-density wireless environ-
ment,” in Proceedings of the IEEE 8th International Conference
on Computer and Information Technology (CIT ’08), pp. 664–
669, July 2008.
[8]T.K.Woo,S.Y.W.Su,andR.Newman-Wolfe,“Resource
allocation in a dynamically partitionable bus network using
a graph coloring algorithm,” IEEE Transactions on Communi-
cations, vol. 39, no. 12, pp. 1794–1801, 1991.
[9] Z. Walczak and J. M. Wojciechowski, “Transmission schedul-
ing in packet radio networks using graph coloring algorithm,”
in Proceedings of the 2nd International Conference on Wireless
and Mobile Communications (ICWMC ’06), p. 46, July 2006.
[10] R. G. Cheng, K. J. Huang, and J. S. Yang, “Radio resource
allocation for overlapping MBS zones,” in Proceedings of the
IEEE Mobile WiMAX Symposium (MWS ’09), pp. 75–80, July
2009.
[11] D. J. A. Welsh and M. B. Powell, “An upper bound for the
chromatic number of a graph and its application totimetabling
problems,” The Computer Journal, vol. 10, no. 1, pp. 85–86,
1967.
[12] F. Harary, Graph Theory, Addison-Wesley, Reading, Mass,
USA, 1994.
[13] F. Harary and E. M. Palmer, Graphical Enumeration,Academic
Press, New York, NY, USA, 1973, Appendix III.