Báo cáo hóa học: " Research Article QoS-Guaranteed Power Control Mechanism Based on the Frame Utilization for Femtocells Pavel Mach and Zdenek Becvar" pot
Bạn đang xem bản rút gọn của tài liệu. Xem và tải ngay bản đầy đủ của tài liệu tại đây (1.75 MB, 16 trang )
Hindawi Publishing Corporation
EURASIP Journal on Wireless Communications and Networking
Volume 2011, Article ID 259253, 16 pages
doi:10.1155/2011/259253
Research Article
QoS-Guaranteed Power Control Mechanism Based on
the Frame Utilization for Femtocells
Pavel Mach and Zdenek Becvar
Department of Te lecommunication Engineering, Faculty of Electrical Engineering, Czech Technical University in Prague,
Technicka 2, 166 27 Prague, Czech Republic
Correspondence should be addressed to Pavel Mach,
Received 3 September 2010; Revised 17 January 2011; Accepted 18 February 2011
Academic Editor: Sangarapillai Lambotharan
Copyright © 2011 P. Mach and Z. Becvar. This is an open access article distributed under the Creative Commons Attribution
License, which permits unrestricted use, distribution, and reproduction in any medium, provided the original work is properly
cited.
The paper focuses on a power control mechanism and proposes a novel approach for dynamic adaptation of femtocells’
transmitting power. The basic idea is to adapt the tr ansmitting power of femtocells according to current trafficloadandsignal
quality between user equipments and the femtocell in order to fully utilize radio resources allocated to the femtocell. The advantage
of the proposed scheme is in provisioning of high quality of service level to the femtocell users, while interference to users attached
to macrobase station is minimized. The paper proposes the power adaptation algorithm and evaluates its performance in terms of
mobility events, achieved throughput, and FAPs transmitting power. Performed simulations show that the proposed scheme can
significantly reduce the number of mobility events caused by passerby users and thus to minimize signaling overhead generated in
the network. In a ddition, our proposal enhances overall throughput for most of the investigated scenarios in comparison to other
power control schemes.
1. Introduction
In the recent years, the demands for high data rates have
been driven by introduction of new wideband services for
mobile users. The contemporary studies demonstrate that
more than 50% of voice calls and more than 70% of data
traffic originates from indoors [1]. The main problem of
current w ireless networks working in the higher-frequency
bands (above 1 GHz) such as 3G or 4G networks is a poor
indoor coverage. Hence, to support high-quality multimedia
services in that kind of scenarios is a challenge. The
promising way for guaranteeing high data transmission for
indoor users is represented by femtocell access points (FAPs).
The FAPs are portable low cost base station deployed, for
example, in the household or office. The connection of the
FAPs with a cellular network is ensured over a broadband
connection such as DSL, cable modem, fiber optic, or
wireless link.
The FAPs can operate in three different access control
modes: closed access, open access, and hybrid access [2, 3].
A closed access mode corresponds to the case when only
small group of users are allowed to connect to the FAPs. The
users, who are permitted to access the FAPs, are determined
according to a closed subscriber group (CSG) list. This
option is suitable for FAPs owners who do not wish to share
their backhaul link for which they have to pay. On the other
hand, an open access mode is allowing all passersby users
to access the FAPs. The FAPs operating in open access can
help to alleviate traffic load of macrobase stations (MBS) by
serving some of its users. The last access mode, that is, hybrid
access mode, is a sort of compromise between the closed and
open access. A certain part of the FAPs bandwidth is always
dedicated for users belonging to the CSG, while the rest of
the bandwidth can be utilized by all passing users.
Various options of frequency allocation are considered
for the FAPs and MBS [4]. First, separate frequency for the
MBS and FAPs can be utilized. Consequently, no interference
between MBS and FAPs occurs. On the other hand, this
option is not always possible, as free radio spectrum may
not be available for the FAPs. More than that, this approach
significantly reduces the spectrum efficiency. The second
option of the frequency allocation is to use the same
2 EURASIP Journal on Wireless Communications and Networking
frequency for both MBS and FAPs. The benefit of this
approach is high spectral efficiency, since all FAPs fully reuse
frequency spectrum of the MBS. The evident drawback is
the increase of cochannel interference between the MBS and
FAPs. The last option of the frequency allocation partially
shares specific amount of the bandwidth between the MBS
and FAPs. The rest of the bandwidth is solely dedicated to the
MBS. Thus, users attached to the MBS close to the FAPs can
use different frequency spectrum than the interfering FAPs.
Many technical studies have been already performed
to analyze the advantages of femtocells implemented in
the network (see, e.g., [5, 6]). Te chnical challenges, which
must be solved to fully utilize femtocells potential, are
described in [7]. One of the most important problems
regarding femtocells is how to avoid the harmful interference
either to the MBS or to the neighbor FAPs if the same
spectrum is utilized by the MBS and FAPs. The effective way
of interference avoidanc e is an appropriate power control
mechanism allowing adaptation of FAPs transmitting power.
To that end, the aim of this paper is to propose a
novel power control mechanism. The idea is to decrease
transmitting power of the FAPs to fully utilize its frame
while requirements of all users attached to the FAPs are
ensured; that is, QoS (quality of service) requirements of
the users are met. The advantage of this approach is that
at light and medium traffic load, the power of FAPs can be
significantly reduced. Consequently, the probability of signal
leakage out of the residential house is decreased as well. This
fact ensures either mitigation of harmful interference to the
adjacent FAPs or to MBS’s users (in case of closed access)
or a reduction of undesired mobility events (in case of open
access).
The pr inciple of the proposed scheme and performed
simulations are described for LTE-A system according to
release 10 [8]. However, the general pr inciple may be used
in other contemporary technologies such as WiMAX or
former LTE versions. In LTE-A technology, the data can be
transmitted either in TDD or FDD manner. Without loss of
generality, the rest of the paper assumes only FDD frame,
since TDD frame has only different structure. In addition,
the paper assumes only FAPs with open access. Nonetheless,
the whole idea can be applied to FAPs with closed access as
well.
The rest of the paper is organized as follows. Sec-
tion 2 discusses the related works concerning the power
control in femtocell environment. The next section provides
description of the proposed power control technique. It
is logically divided into five subsections. The assessment
of parameters influencing frame utilization is delivered in
the first subsection. The second subsection analyses the
dependence of frame utilization on FAPs transmitting power.
A relationship b etween the probability of generated mobility
event and FAPs transmitting power is contemplated in the
third subsection. The fourth subsection is dedicated to
the description of the proposed power control algorithm.
The requirements of the proposed mechanism on existing
networks are contemplated in the last subsection. The system
model and simulation results are presented in the two
following sections. The last section gives our conclusions.
2. Related Works
The power control mechanism may be implemented either
in an uplink or in a downlink direction. In the former case,
a transmission power of user equipment (UE) is adapted.
In the latter case, an adaptation of FAPs transmission
power is accomplished. The power control in uplink is
addressed, for example, in [9–11]. Regarding the power
control in downlink, which is the focus of the paper, several
mechanisms have been already proposed. Generally, two
different approaches are followed regarding the downlink
power control in femtocell’s environment. According to the
first approach, the main aim is to completely cover a specific
area of certain radius (e.g., to ensure the whole house
coverage). The advantage is that users are always able to
connect to the FAPs when inside the building. Nevertheless,
the signal leakage out of the building boundaries may be
significant. The primary goal of the second approach is to
set the transmitting power of FAPs to minimize interference
to passerby users or neighboring FAPs. The disadvantage of
this approach is that the coverage of whole building is not
always assured, especially if the FAPs are positioned close to
the building boundary.
In [12, 13], authors suggest autoconfiguration schemes
(representatives of the first approach) and self-optimization
schemes (representatives of the second approach), respec-
tively. While the autoconfiguration schemes provide an
initial power setting of the FAPs, the self-optimization
schemes try to optimize the FAPs transmitting power during
a normal operation. Authors distinguish three autoconfig-
uration schemes: (i) fixed power, (ii) distance based, and
(iii) measurement based. When fixed power configuration
scheme is utilized, the transmitting power is set to fixed value
(authors consider
−10 dBm). Disadvantage of this method
is that the FAPs coverage strongly depends on the distance
from the MBS. This drawback is eliminated by the distance
or measurement-based approaches. In these cases, the FAPs
power is configured so that the received signal from the
strongest macrocell and the FAPs are the same at a defined
target cell r adius. Usually, the target cell radius corresponds
to the maximum distance from the FAPs where a UE attaches
to the FAPs rather than to the MBS. The performance
of autoconfiguration schemes is analyzed in terms of the
number of mobility events (i.e., number of the handovers
or their initiations) for the different FAPs positions within
a building. Although the distance and measurement-based
methods outperform simple fixed power autoconfiguration
scheme, the number of registered mobility events is still
high and unsatisfactory (especially for the scenario if the
FAPs are positioned close to the house boundary). Further
improvement is achieved by the introduction of the self-
optimization schemes.
Three self-optimization schemes are proposed in [12,
13]. Generally, all self-optimization schemes aim to mini-
mize the number of mobility events based on their mea-
surement. Consequently, the FAPs must be able to collect
statistical information regarding the mobility events. The
first scheme forces the adaptation of FAPs power only
according to the mobility events generated by passing users.
EURASIP Journal on Wireless Communications and Networking 3
The advantage is that the number of outdoor mobility
events is significantly minimized. Nevertheless, the number
of indoor mobility events may be high. This disadvantage is
eliminated by the second proposed self-optimization scheme
when the FAPs tries to minimize all mobility events. The last
scheme exhaustively searches over all possible power settings
and the power of FAPs, during which the smallest number
of mobility events occurred, is regarded as the optimum.
However, as this approach is not really practical, it serves
only as a benchmark. The numerical results demonstrate
that self-optimization schemes noticeably outperform all
autoconfiguration methods. As already stated, the main
disadvantage of all self-optimization schemes proposed in
[12, 13 ] is that UEs inside the house are not always able to
attach to the FAPs as the full house coverage is not ensured.
In [14], the authors additionally contemplate another
autoconfiguration scheme taking activity/inactivity of users
into consideration. If no users of the FAPs are currently
active (no voice or data are transmitted), the transmitting
power of FAPs are decreased by 10 dB. At the same time, the
FAPs user’s idle mode cell reselection threshold is decreased
by 10 dB to guarantee that the UEs remain connected
to the FAPs. However, even with this improvement, the
autoconfiguration scheme is outperformed by the above-
mentioned self-optimization schemes.
Two more power schemes, which represent the second
approach, are introduced in [15, 16]. In [15], the authors
propose an adaptive coverage adjustment (ACA) algorithm.
The aim of the paper is similar to the self-optimization
schemes proposed in [12, 13], that is, to minimize mobility
events and to reduce signal leakage. If the UE currently
attached to the MBS is in close vicinity of a FAPs, the
FAPs itself iteratively decreases its transmit power as long as
the passing UE is in FAPs range. After specific time period
when the UE moves away from the FAPs coverage, the FAPs
increases power to the initial value. Nevertheless, this scheme
is not able to fully mitigate the redundant handovers, since
the decrease of power is done after reception of handover
request at the side of FAPs. In [16], self-optimization scheme
allowing the FAPs to adaptively adjust transmitting power is
presented. The proposed scheme is composed of two steps. In
the first step, the self-configuration of the FAPs transmitting
power is accomplished. In the second step, the adaptation of
current transmitting power according to radio environments
obtained by measurements is performed. The aim of the
authors is like as described in [12, 13], that is, to minimize
interference caused by the FAPs to passersby users while to
achieve sufficient indoor coverage. However, the authors do
not use the number of generated mobility events but consider
leakage of the FAPs signal for its power adaptation.
Other two studies proposed to control FAPs transmission
power in dependence on current traffic loa d of the FAPs.
In [17], the authors contemplate the possibility to adapt
transmitting power of FAPs based on traffic density. The
proposed scheme suggests observing the length of queue
at the FAPs. If the queue is filled at a certain level given
by proposed parameters, the FAPs transmits either at full
level (at high trafficdensity)orathalfofitsfullpower(at
low traffic density). From the results, it can be observed
that transmission power can be decreased. Nevertheless, the
paper does not show how the proposed scheme performs
in comparison to existing power control schemes in terms
of interference reduction or throughput. The second study
described in [18] proposes a similar idea as defined in [17].
The aim is to adapt the transmitting power of femtocells
according to current traffic load and signal quality between
mobile stations and femtocell in order to fully utilize data
frame. The study provides only simple analytical evaluations
in order to demonstrate the effect of proposed pr inciple on
FAPs transmitting power.
The work in this paper is based on the idea introduced in
[18]. In comparison to [18], the paper proposes a whole new
algorithm enabling FAPs to adapt their transmitting power
and contemplates its applicability to existing LTE networks.
In addition, extensive simulations emulating real scenarios
with FAPs are undergone. T he aim of the proposed scheme
is to find the optimal tradeoff between both of the above-
mentioned approaches by elimination of their weaknesses.
On one hand, our objective is to minimize the number of
undesired mobility events in a similar way as the proposals
based on the second-approach aims. However, at the same
time, the goal is to keep the same QoS level to the FAPs users
as in case of the first approach.
3. Proposed Power Control Mechanism
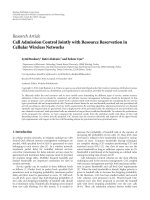
The general principle of the proposed scheme is depicted in
Figure 1. The left part of the figure shows the case when
the transmitting power of FAPs are adjusted to achieve
CINR
Target
(carrier to interference and noise ratio) at radius
r
1
, which could correspond, for example, to the house
boundaries. If the channel quality, characterized by the
CINR
1
, at the side of both UEs is distinguishable higher than
CINR
Target
and the radio resources of the FAPs are not fully
utilized, the FAPs transmitting power is decreased, while no
negative impact on QoS is observed. The power is adjusted
to such value when the received signal from the FAPs at the
side of both UEs is still acceptable (in Figure 1(b) depicted
as CINR
2
) and that all data can be still transmitted. The
proposed scheme adjusts transmitting power of reference
signals (RSs), w hose purpose is to estimate channel quality,
and data. In our proposal, we assume that the data in
DL direction are transmitted w ith the same power as RSs.
Thus, an opportunistic decrease of transmitting power of
RSs helps to minimize the number of mobility events, since
the handover is initiated according to received quality of RSs
[19].
Actual frame utilization must be known at the side of
FAPs to estimate current appropriate t ransmitting power of
FAPs (P
t
). According to [8], the LTE-A frame is composed
of 20 slots with 0.5 ms duration in a time domain. Every
two slots create one subframe, and ten subframes form one
LTE-A frame. Furthermore, one slot includes seven OFDM
symbols (or six OFDM symbols if extended cyclic prefix is
considered). Depending on channel bandwidth, the frame
structure could be decomposed in a frequency domain into
certain number of subcarriers, and every twelve subcarriers
4 EURASIP Journal on Wireless Communications and Networking
FAP
FAP
UE1
UE1
UE2
UE2
CINR
target
CINR
2
≥
Utilization of FAP frame
Utilization of FAP frame
(radius r
1
)
(radius r
2
)
CINR
targ
et
CINR
t
a
r
get
CINR
2
≥
C
I
N
R
t
ar
g
e
t
CINR
target
CINR
target
CINR
1
≫
CINR
1
≫
Power adaptation
(a) Without proposed power adaptation
(b) With proposed power adaptation
Figure 1: Basic principle of the proposed scheme.
form one resource block. The resource block consists of the
so-called resource elements representing one subcarrier in
the frequency domain and one OFDM symbol in the time
domain.
For the purpose of our proposed power control scheme,
it is necessary to analyze aspects influencing current frame
utilization and relationship between FAPs transmitting
power and its frame utilization. These issues are addressed
in the next two subsections.
3.1. Assessment of Parameters Influencing Frame Utilization.
The first aspect having an effect on the frame utilization
is the amount of resource elements dedicated for data
transmission and signalization. In compliance with the
previous subsection, the overall number of resource elements
in the frame can be expressed as
n
REpF
= n
SC
× n
SMB
,(1)
where n
SC
stands for the number of subcarriers in the
frequency domain (depends on selected channel bandwidth)
and n
SMB
represents the amount of OFDM symbols per
frame in the time domain. The current frame utilization can
be formulated as
ϑ
=
n
OH
+ n
D
n
REpF
,(2)
where n
OH
and n
D
represent the number of resource elements
appointed to control information and data, respectively.
Thus, as long as n
OH
+ n
D
<n
REpF
, the frame is not
fully used and some resources are still free. The number
of resource elements carrying overhead depends on system
configuration and usually varies between 15% and 30% of
n
REpF
(see [20]).
The second aspect having an impact on current frame
utilization corresponds to the amount of traffictransmitted
Table 1: Transmission efficiency depending on CINR [21].
CINR (dB) MCS Transmission efficiency Γ
−1 < CINR ≤ 1.5 1/3 QPSK 0.66
1.5 < CINR
≤ 3.8 1/2 QPSK 1
3.8 < CINR
≤ 5.2 2/3 QPSK 1.33
5.2 < CINR
≤ 5.9 3/4 QPSK 1.5
5.9 < CINR
≤ 7.0 4/5 QPSK 1.6
7.0 < CINR
≤ 10 1/2 16QAM 2
10 < CINR
≤ 11.4 2/3 16QAM 2.66
11.4 < CINR
≤ 12.3 3/4 16QAM 3
12.3 < CINR
≤ 15.6 4/5 16QAM 3.2
15.6 < CINR
≤ 17 2/3 64QAM 4
17 < CINR
≤ 18 3/4 64QAM 4.5
18 < CINR 4/5 64QAM 4.8
between the FAPs and its users in downlink direction during
frame k. This parameter could be expressed as
Θ
k
=
n
j=0
TL
k
j
,(3)
where n is the number of users attached to the FAPs and
TL
k
j
is the amount of data send to user j during frame k.
In general, the number of resource elements used for data
transmission is proportional to the amount of generated data
in the downlink direction.
The last aspect influencing current frame utilization is
represented by a transmission efficiency Γ.TheΓ parameter
determines the amount of bits sent via one resource element,
that is, the number of bits sent over one subcarrier in
the frequency domain and one OFDM symbol in the
time domain. The parameter Γ is dependent on chosen
modulation and coding scheme (MCS) assigned according
to the received CINR. In the paper, the MCS is selec ted in the
line with [21] as indicated in Table 1.
EURASIP Journal on Wireless Communications and Networking 5
The parameter Γ is proportional to the FAPs transmitted
power, since CINR can be calculated as
CINR
= P
t
− PL − NI,(4)
where P
t
is the transmitting power of FAPs, PL corresponds
to the signal attenuation between a transmitter and a receiver,
and NI stands for the noise plus interference.
3.2. Impact of FAPs Transmitting Power on Frame Utilization.
If the transmitting power P
t
either increases or decreases,
CINR received at the side of UEs is changed as well (see (4)).
An increase (decrease) of P
t
leads to proportional increase
(decrease) of CINR experienced by the UEs (for better
understanding of the principle, PL and NI are considered to
be unchanged between two reporting intervals). This could
be interpreted as
CINR
(P
t,new
)
> CINR
(P
t,old
)
if P
t,new
>P
t,old
,
CINR
(P
t,new
)
< CINR
(P
t,old
)
if P
t,new
<P
t,old
.
(5)
As a result, the MCS can be switched to the one
with higher (lower) transmission efficiency Γ, since the
channel quality is improved (worsen) as indicated in Table 1.
Subsequently, the number of resource elements used for data
transmission can be expressed as
n
k
D
=
n
j=0
TL
k
j
Γ
k
j
,(6)
where Γ
k
j
is the transmission efficiency of user j in frame
k. It is clear that higher (lower) transmission efficiency
reduces (raises) the amount of resource elements used for
data transmission as indicated in
n
k
D
(Γ
k
j,new
)
<n
k
D
(Γ
k
j,old
)
if Γ
k
j,new
> Γ
k
j,old
,
n
k
D
(Γ
k
j,new
)
>n
k
D
(Γ
k
j,old
)
if Γ
k
j,new
< Γ
k
j,old
.
(7)
Finally, if the number of resource elements assigned
for data transmission n
k
D
is reduced (raised), the frame
utilization is also decreased (increased) as could be seen from
(2) and expressed as
ϑ
(n
k
D,new
)
<ϑ
(n
k
D,old
)
if n
k
D,new
<n
k
D,old
,
ϑ
(n
k
D,new
)
>ϑ
(n
k
D,old
)
if n
k
D,new
>n
k
D,old
.
(8)
Thus, the proposed power mechanism tries to achieve
certain target frame utilization ϑ
target
by changing of FAPs
transmitting power in dependence on current trafficloadand
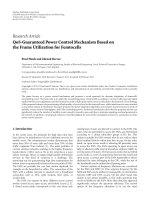
channel quality between the FAPs and UEs. Figure 2 shows
the example how the frame utilization is influenced by FAPs
transmitting power. The frame utilization is calculated for
one active UE positioned 2 m from the FAPs without any
obstacles between the transmitter and receiver. Furthermore,
two bandwidth sizes allocated to the FAPs are considered,
while three different traffic loads are generated in DL
direction. It is illustrated that with increasing of FAPs
transmitting power the frame utilization is decreasing. In
general, the higher frame utilization is observed if the offered
traffic load is higher and narrower channel bandwidth is used
for the same transmitting powers. From Figure 2,optimal
levels of power allocated to the FAPs could be further derived
when the frame utilization is either equal to 1 or lesser.
The reason for constant frame utilization for FAPs power
levels between
−2 and 21 dBm is that the highest MCS is
used. Thus, the amount of radio resources allocated for data
transmission is still the same.
3.3. Impact of FAPs Transmitting Power on Mobility Events. In
general, one mobility event is generated if the UE initiates
handover procedure. In this paper, mobility event occurs
if the UE moves from the MBS to FAPs or vice versa and
when the UE crosses between two adjacent FAPs. Thus, UE
moving close to the FAPs positioned in the building may
perform handover to the FAPs and within moment switches
back to the MBS; that is, two mobility events are generated.
Consequently, the objective of the power control is to avoid
handovers from the MBS to FAPs in the first place. The
handover is always performed if
s
t
(
t
)
>s
s
(
t
)
+ Δ
HM
, t ∈t, t + HDT,(9)
where s
s
(t)ands
s
(t) are pilot’s signal levels received from
a target station (station to which the UE is supposed to be
connected after handover), and a serving station (station to
which the UE is attached before handover), respectively, and
Δ
HM
represents hysteresis margin for avoiding redundant
handovers. Furthermore, in order to prevent any other
unnecessary handovers, its initiation is postponed by han-
dover delay timer (HDT).
To identify the relation between transmitting power and
amount of initiated h andovers, we can express signals s
s
(t)
and s
s
(t) as follows:
s
s
(
t
)
= P
t,s
− PL
s
(
t
)
− u
s
(
t
)
,
s
t
(
t
)
= P
t,t
− PL
t
(
t
)
− u
t
(
t
)
,
(10)
where P
t,s
/P
t,t
represents pilot’s transmitting power of
BS/FAPs, PL
s
(t)/PL
t
(t) corresponds to the path loss between
MBS/FAPs and UE, and u
s
(t)/u
t
(t) stands for shadowing
function. By combination of (9)and(10), handover from
the MBS to FAPs are initiated if
P
t,t
− PL
t
(
t
)
− u
t
(
t
)
>P
t,s
− PL
s
(
t
)
− u
s
(
t
)
+ Δ
HM
, t ∈t, t + HDT.
(11)
If we consider handover from the MBS to FAPs, that
is, P
t,s
is the transmitting power of the MBS and P
t,t
corresponds to transmitting power of FAPs, it is apparent
that a probability of handover decreases with lowering of
FAPs transmitting power. Since the goal of the proposed
power control is to fully utilize the frame by decreasing of
FAPs transmitting power, the overall number of performed
handovers may be potentially minimized as proved by
simulation results in Section 5.
6 EURASIP Journal on Wireless Communications and Networking
Table 2: Notations.
Symbol Semantics
P
t
Transmitting power of the FAPs
ΔP Power adaptation step
P
min
Minimal transmitting power of the FAPs
P
max
Maximal transmitting power of the FAPs
CINR
min
Minimal CINR when the UE is still able to connect
to the FAPs
CINR
max
CINR when the data between the FAPs and the UE
are sent with the highest MCS
ϑ Current frame utilization
ϑ
target
Target frame utilization
X
m
The set of UEs’ average CINR of the FAPs m,
X
m
= [χ
m
1
, χ
m
2
, , χ
m
n
]
Γ
m
The set of UEs’ transmission efficiencies of the
FAPs m, Γ
m
= [γ
m
1
, γ
m
2
, , γ
m
n
]
Δt Power adaptation interval
FM Fade margin to cope with fading effects
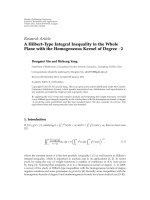
3.4. Power Adaptation Algorithm. Table 2 summarizes a
notation used in the description of the proposed algorithm.
The dynamic adaptation of transmitting power is done
every adaptation interval Δt. Firstly, the current frame
utilization in the downlink direction is estimated. Whether
the transmitting power of FAPs are increased, decreased, or
remains the same depends on several parameters: current
frame utilization ϑ, average CINR between individual FAPs
and its UEs, and current transmitting power of the FAPs P
t
.
Depending on trafficloadΘ
k
in frame k representing UEs
activity and the current frame utilization ϑ, three cases may
occur: Case I (Θ
k
= 0andϑ<ϑ
target
), Case II (Θ
k
> 0
and ϑ<ϑ
target
), and Case III (Θ
k
> 0, ϑ
target
≤ ϑ<1or
ϑ
= 1, while not al l data are sent from the FAPs to UEs due
to congestion). The target frame utilization ϑ
target
represents
a value, which the algorithm aims to reach. In general, the
ϑ
target
can take the values between 0 and 1. The paper assumes
the value of ϑ
target
is equal to 1 as the objective is to f ully
utilize the frame (the finding of optimum value for ϑ
target
from the packet delay point of view is an item for future
study).
The Case I occurs when all UEs connected to the FAPs
are in inactive state (Θ
k
= 0). In order to minimize potential
interference to passerby users, the transmitting power of the
FAPs are automatically set to its minimal value P
min
.To
prevent the handover of UEs in idle state to other station
with higher transmitting power (either to MBS or to adjacent
FAPs), the handover threshold is decreased accordingly.
The Case II corresponds to the situation when ϑ<ϑ
target
while some of the UEs are active (Θ
k
> 0). As Figure 3
indicates, the transmitting power of FAPs can be either
increased or decreased. The power has to b e increased if at
least one UE attached to the FAPs are receiving weak signal
(i.e., there exists χ
m
∈ X
m
< CINR
min
+FM)toavoid
possible termination of data transmission by this UE. The
fading margin FM guarantees that the UE is not disconnected
due to fading effects. In addition, the power of FAPs are
incremented by power adaptation step only if the new value
would not exceed P
max
.
On the other hand, the power is decreased if all UEs con-
nected to the FAPs are receiving signal with satisfying quality
(i.e., for all χ
m
∈ X
m
≥ CINR
min
+ ΔP + FM). The decrease
of transmitting power is profitable, since the interference is
minimized. Nevertheless, two more requirements need to be
satisfied to lower FAPs transmitting power. The first one is
fulfilled if the new transmitting power would be still above
the minimal allowed value P
min
. The purpose of the second
one is to avoid continuous adjustment of transmitting power
when frame utilization is equal approximately to ϑ
target
.If
this problem would be neglected, the transmitting power
could oscillate between two values as indicated in Figure 4(a).
The oscillation is caused by the fact that as soon as ϑ>
ϑ
target
, the algorithm increases FAPs transmitting power (see
description of Case III below). Nonetheless, in the next
adaptation cycle, the FAPs transmitting power would be
again decreased (i.e., Case II would be applied). To this end,
the algorithm is enhanced by the following mechanism. If the
frame utilization in previous adaptation cycle is above ϑ
target
while in the current cycle it is not (i.e., ϑ
t−Δt
>ϑ
target
and ϑ
t
<
ϑ
target
), the indicator is set to “1” (see Figures 3 and 4(b)). The
algorithm reaches the equilibrium, since the transmitting
power of FAPs are optimal as the frame utilization is closest
to the ϑ
target
as possible. The equilibrium state lasts as long
as ϑ remains the same. In other words, the MCS used by
all UEs is unchanged (i.e., for all γ
m
∈ Γ
m
, γ
m
t
=Δt
= γ
m
t
),
and the amount of data generated in downlink is still the
same (Θ
k−1
= Θ
k
). Otherwise, the indicator value is reset to
“0”, and new transmitting power achieving the equilibr ium is
found.
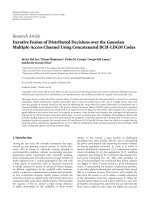
The last case (Case III) represents the situation when
the FAPs current frame utilization is above target frame
utilization (i.e., ϑ
target
≤ ϑ<1) or when ϑ = 1 and the FAPs
are at the same time overloaded. The transmitting power
of FAPs are either set directly to P
max
or increased by ΔP
(see Figure 5). The FAPs power is set to its maximal level
only when it is overloaded. The reason for immediate rise of
the FAPs power to P
max
is to ensure that data transmissions
are not necessarily delayed by proposed mechanism as in
the case of gradual increase of the FAPs power would be.
Nevertheless, the power is set to P
max
only if at least one of
the UEs attached to the FAPs experiences channel quality
in downlink below CINR
max
. If this is not the case (for all
χ
m
∈ X
m
≥ CINR
max
),theincreaseofpowerwouldbe
pointless, as already all UEs connected to the FAPs use the
best MCS. Hence, the frame utilization would not be lowered
despite the increased transmitting power.
The FAPs power is incremented only by ΔP when ϑ
target
≤
ϑ<1. In this situation, the generated data can be still
transmitted and adjusting of the FAPs power by ΔP is
sufficient. Before increase of the FAPs transmitting power
is accomplished, two conditions must be satisfied. The first
condition is the same in the previous case; that is, there exists
χ
m
∈ X
m
< CINR
max
. The second condition is that the FAPs
transmitting power incremented by a power adaptation step
does not exceed maximal allowed value P
max
.
EURASIP Journal on Wireless Communications and Networking 7
−20
−10 0 10 20
0
0.2
0.4
0.6
0.8
1
FAP transmitting power (dBm)
Frame utilization (−)
Offered load = 2 Mb/s
Offered load = 4 Mb/s
Offered load = 6 Mb/s
(a) BW = 3MHz
−20 −10 0 10 20
0
0.2
0.4
0.6
0.8
1
FAP transmitting power (dBm)
Frame utilization (−)
Offered load = 2 Mb/s
Offered load
= 4 Mb/s
Offered load = 6 Mb/s
(b) BW = 10 MHz
Figure 2: Dependence of frame utilization on transmitting power of FAPs.
Estimation of ϑ
Wait Δt
ϑ
t
<ϑ
target
ϑ
t−Δt
>ϑ
target
Indicator = 1
Indicator
= 0
Indicator
= 0
See “Case I”
or “Case III”
ϑ<ϑ
target
and
and
Θ
t
> 0
∃χ
m
∈ X
m
< CINR
min
+FM
P
t
= P
t
+ ΔP
∀χ
m
∈ X
m
≥ CINR
min
+ ΔP +FM
P
t
= P
t
− ΔP
or
P
t
+ ΔP ≤ P
max
P
t
− ΔP ≥ P
min
No
No
No
No
No
No
No
No
Yes
Yes
Yes
Yes
Yes
Yes
Yes
Yes
∃γ
m
∈ Γ
m
, γ
m
t−Δt
/= γ
m
t
Θ
k−1
/= Θ
k
Figure 3: The principle of power adaptation algorithm for Case II.
Target frame
utilization ϑ
target
ϑ
(a)
Target frame
utilization ϑ
target
ϑ
Setting indicator to 1
Setting indicator to 0
Algorithm in
equilibrium state
t
Δt
(b)
Figure 4: Avoidance of FAPs transmitting power oscilation.
8 EURASIP Journal on Wireless Communications and Networking
Estimation of ϑ
Wait Δt
See “Case I”
or “Case II”
FAP overloaded
and
ϑ = 1
∃χ
m
∈ X
m
< CINR
max
P
t
= P
max
∃χ
m
∈ X
m
< CINR
max
P
t
+ ΔP ≤ P
max
P
t
= P
t
+ ΔP
No
No
No
No
No
Yes
Yes
Yes
Yes
Yes
ϑ
≥ ϑ
target
and
Θ
k
> 0
Figure 5: The principle of power adaptation algorithm for Case III.
Macro
BS
Macro
BS
Sidewalk
Sidewalk
Main road
1000 m
1m
2m
200 m
6m
···
···
Figure 6: Simulation scenario
So far, we have assumed the power adaptation is done
in such manner that all UEs attached to the FAPs would
experience satisfying signal quality regardless of their activ-
ity/inactivity. Nevertheless, if for example, only one UE in
close distance to FAPs are active while the rest of attached
UEs are inactive, it is profitable to adapt transmitting power
to guarantee good channel quality only between the active
UE and the FAPs. In case when inactive UE changes its status
to active, the FAPs can automatically increase transmitting
power to cover this newly active UE. The merits of both
proposed algorithm options are analyzed in Section 5.
The important aspect of the proposed power control
algorithm is to achieve fast power adaptation. In order
to speed up the whole adaptation process, the proposed
algorithm needs to be optimized. The speed of adaptation
process have a great impact on the number of mobility
events, that is, on the amount of generated overhead due to
the handover process. In par ticular, it is necessary to quickly
decrease the transmitting power if the FAPs increases power
to the maximum value as described earlier. Generally, two
parameters influencing speed of adaptation process can be
taken into consideration: adaptation interval Δt and power
adaptation step ΔP. As the length of the frame in LTE-A is
set to 10 ms, it is convenient to set adaptation interval to
constantvalueof10msaswell(LTE-Aallowstoschedule
reporting period to 2 ms at most). By this way, the FAPs are
able to adjust the power after each transmitted frame. Thus,
the purpose of optimization process is to find such value
of ΔP ensuring the minimal number of mobility events. In
other words, if we denote f (ΔP) as an objective function
of the number of generated mobility events, the whole
optimization process can be formulated as
ΔP
= arg min
ΔP
f
(
ΔP
)
. (12)
TheoptimalvalueofΔP is found experimentally by
means of performed simulations addressed in Section 5.In
the proposed algorithm, it is assumed that the adaptation
step has constant size. However, the adaptive size of ΔP can
be utilized for our purposes. Similarly, as in case of ϑ
target
, this
issue is an item for further future research.
3.5. Requirements Imposed by Proposed Mechanism. The
advantage of our proposed power control mechanism is that
it needs no additional hardware modifications to the MBS,
FAPs, or UE. The only requirement is that the FAPs are
capable to adjust its tr ansmitting power by optimized adap-
tation step ΔP. Nevertheless, this functionality is required
by all existing power schemes. Regarding software changes,
the FAPs firmware needs to be updated to support proposed
power adaptation algorithm. The algorithm computational
complexity is low, since no difficult calculations are done;
only several simple conditions are evaluated during every
power adaptation cycle Δt. As a consequence, the FAPs have
to collect information regarding the channel quality of all
its users in DL every adaptation cycle Δt as well. Since in
LTE, a periodic CINR measurement and its reporting can
EURASIP Journal on Wireless Communications and Networking 9
Utility
Living room
Room
Kitchen
Toilet
Corridor
14 m
4m
7m
2.5m
Waypoint
Point of decision
FAP’s p osition
Figure 7: Indoor mobility model [13].
be scheduled from 2 ms to 160 ms [19], we consider values
of Δt varying between 10 ms to 80 ms. Thus, the proposal
does not unnecessarily increase repor ting overhead or FAPs
processing load.
In order to implement the proposed algorithm to femto-
cell environments, two requirements need to be fulfilled: (i)
the FAPs has to be aware of UEs’ individual CINR and (ii)
the FAPs has to able to e valuate current frame utilization in
downlink direction. As mentioned earlier, the measurement
of channel quality and its reporting to the FAPs are inherent
procedure necessary for all wireless mobile technologies.
Consequently, the FAPs can adjust the transmitting power
as described in previous subsection. In addition, the other
advantage of the proposed mechanism is that it does not
increase the signaling overhead due to reporting of CINR as
the reporting has to be done independently on the proposed
power scheme. The second requirement is also satisfied, since
the FAPs are continuously aware of downlink trafficand
allocates radio resources to UEs. Thus, the FAPs are able
to easily determine current frame utilization essential for
proposed power adaptation scheme.
4. System Model
All simulations are performed in MATLAB environment.
The parameters’ setting is given in Table 3. The simulations
are done for FDD LTE-A system. The amount of overhead in
the frame is derived from [8, 20] for configuration with one
transmitting antenna and varies between 25.8% and 27.6%
depending on the selected bandwidth.
The system model contains one hundred terr aced houses
with structure according to [12]. Every second house is
equipped with one FAPs. A disposition of individual houses
and MBSs is illustrated in Figure 6. The considered scenario
is selected intentionally, for it is very challenging as the
households are in close proximity of a sidewalk and windows
face the sidewalk. Hence, significant amount of undesired
mobility events may occur. The outdoor users are moving
only within sidewalk’s boundary in the direction from the
south to the north. An initial position of each user is selected
Table 3: System settings.
Parameter Value
Frequency band f (GHz) 2.0
MBS channel bandwidth BW (MHz) 10
FAPs channel bandwidth BW (MHz) 3; 5; 10
Frame duration (ms) 10
Number of OFDM symbols per slot (
−)7
Max. FAPs transmit power P
max
(dBm) 21
Min. FAPs transmit power P
min
(dBm) −20
MBS transmit power (dBm) 43
Noise (dBm)
BW
·4·pW/GHz
[22]
CINR
min
(dB) −1
CINR
max
(dB) 18
Target frame utilization ϑ
target
(−)1
No. of FAPs 50
Loss of internal wall/external
wall/window (dB)
5/10/3
Fade margin (dB) 4
Hysteresis margin (dB) 4
HDT (ms) 500
Length of simulation (s) 20000
at the south boundary of the sidewalk. The distance from
the house is selected randomly in range from 1 m to 3 m of
the house. Subsequently, the user starts moving in northern
direction with speed of 1 m/s along the straight trajectory. As
soon as the UE reaches norther nmost point of the sidewalk,
it is discarded from the system. The intensity of UEs arrival to
the system follows Poisson distribution and is approximately
70 passing users per one hour.
Every FAPs serves up to four UEs, which is the maximal
number of active UEs supposed to be served simultaneously
by one F AP s [7]. The movement of UEs within house is
managed differently when compared to outdoor users. The
UE is moving with speed of 1 m/s along indicated trajectories
10 EURASIP Journal on Wireless Communications and Networking
as shown in Figure 7. At e ach point of decision, the UE
randomly selects the next moving direction with equal
probability to all possible destinations. For instance, if the
user can move to three different waypoints, the probability
for each w aypoint is 1/3. The UE spends a certain amount
of time at a waypoint. After that, it moves to the next
selected waypoint. The time spent by a user at the wayp oint
is described by normal distribution and differs for each room
(parameters μ and σ of the distribution are derived from
[13]).
Figure 7 further shows the position of FAPs considered in
the performed simulation. Several FAPs positions are chosen
along the arrow in Figure 7 within the simulation. The
position of FAPs directly next to the window represents the
worst case scenario (highest number of undesired mobility
event is generated), the position approximately in the middle
of the household corresponds to the best scenario as the
signal from the FAPs are highly a ttenuated by the walls.
Since the performance of proposed mechanism strongly
depends on the amount of generated traffic by indoor users,
two traffic model types based on [23] are defined. First traffic
model type is an FTP model representing data transmission
scenario. More than that, two types of the FTP model are
considered (denoted in simulation as an FTP I and an
FTP II). While the FTP I generates roughly 380 kb/s at an
average per the simulation (corresponding to the light traffic
case), the FTP II generates roughly 4.4 Mb/s at an average
(corresponding to the heavy traffic case). The second type
of model is a VoIP model representing voice transmission.
Two path loss models are assumed. To simulate path loss in
indoor environment, ITU-RP.1238 model is implemented.
The path loss model for outdoor environment is based on
Okumura Hata empirical model. Both path loss models are
chosen, since these are widely used in evaluation of femtocell
concept [19]. More detailed parameters of both models can
be found also in [24].
The performance of the proposed mechanism is demon-
strated through the number of mobility events generated per
whole simulation depending on the position of the FAPs
within the household. The mobility event is triggered if
pilot signal received from new cell is higher by 4 dB than
from serving cell for a time of 500 ms (the values are taken
from [12]). The simulation monitors both outdoor and
indoor mobility events. Moreover, the throughput and level
of transmitting power for selected scenarios is analyzed.
5. Simulation Results
Figure 8 compares the performance of several scenarios
in terms of the number of mobility events. The scenario
denoted in al l following figures as “ACS-MB” represents
auto-configuration scheme based on measurement of the
mobility events proposed in [12]. This scenario serves as a
benchmark, since the observed number of mobility events
are normalized to its maximal value at FAPs distance of
0.5 m from the house boundar ies. The scenario labeled as
“eACS-MB” enhances simple ACS-MB as explained in [12].
However, in case of FAPs inactivity, the power is decreased to
01234567
0
0.1
0.2
0.3
0.4
0.5
0.6
0.7
0.8
0.9
1
FAP distance from the house boundary (m)
Normalized number of mobility events (−)
ACS-MB
eACS-MB
SOS
PS I, ΔP
= 0.1dB
PS II, ΔP
= 0.1dB
PS II, ΔP
= 0.5dB
PS II, ΔP
= 1dB
PS II, ΔP
= 2dB
Figure 8: Normalized number of mobility events depending on
FAPs position, FTP I, BW
= 3MHz.
P
min
(not by 10 dB as described in [12]) for fairly comparison
with our proposed scheme. Note that eACS-MB represents
the best performing power control scheme based on the first
approach. The next considered scenario labeled as “SOS”
corresponds to self-optimization scheme proposed in [12]
minimizing the number of mobility events at the cost of
worse FAPs indoor coverage (based on the second approach).
Figure 8 illustrates the number of all generated mobility
events, that is, both indoor and outdoor mobility events. The
performance of proposed scheme is expressed by scenario
depicted as “PS I” and “PS II”. In the former case, the
algorithm guarantees that all UEs in the house receive signal
from the FAPs with satisfying quality regardless on their
activity/inactivity. The latter case represents the situation
when the FAPs adjust their transmitting power to serve only
currently active users.
The worst performance is observed by ACS-MB, where
significant number of the mobility events is generated. Espe-
cially if the FAPs are close to the house border, the passersby
UEs are forced to perform the handover from the MBS or
adjacent FAPs very often. Although the situation is improved
by eACS-MB, which reduces the number of mobility events
approximately to 50%, the results are still unsatisfactory.
The overall number of mobility events decreases as the FAPs
are placed closer to the house centre. The sharp drop of
the mobility events between 3.5 m and 4 m is due to two
reasons. The first reason is that the FAPs are removed from
living room to the next room (see Figure 7). Thus, the
FAPs power leakage out of house is reduced by attenuation
of internal wall. The second reason is that the FAPs are
transmitting at such power level to cover whole house, and
the most problematic locality in our scenario is to cover a
toilet positioned furthest from the FAPs. Thus, when the
EURASIP Journal on Wireless Communications and Networking 11
0
12
3
45
6
7
0
0.1
0.2
0.3
0.4
0.5
0.6
0.7
0.8
0.9
1
FAP distance from the house boundary (m)
Normalized number of mobility events (−)
ACS-MB
eACS-MB
SOS
PS, BW
= 3/5/10 MHz
(a) VoIP
0
12
3
45
6
7
0
0.1
0.2
0.3
0.4
0.5
0.6
0.7
0.8
0.9
1
FAP distance from the house boundary (m)
Normalized number of mobility events (−)
ACS-MB
eACS-MB
SOS
PS, BW = 3 MHz
PS, BW = 5 MHz
PS, BW = 10 MHz
(b) FTP I + VoIP
0
12
3456
7
0
0.1
0.2
0.3
0.4
0.5
0.6
0.7
0.8
0.9
1
FAP distance from the house boundary (m)
Normalized number of mobility events (−)
ACS-MB
eACS-MB
SOS
PS, Δt
= 10 ms, BW = 3 MHz
PS, Δt = 20 ms, BW = 3 MHz
PS, Δt = 40 ms, BW = 3 MHz
PS, Δt = 80 ms, BW = 3 MHz
PS, Δt = 10 ms, BW = 5 MHz
PS, Δt = 20 ms, BW = 5 MHz
PS, Δt
= 40 ms, BW = 5 MHz
PS, Δt = 80 ms, BW = 5MHz
PS, Δt
= 10 ms, BW = 10 MHz
PS, Δt
= 20 ms, BW = 10 MHz
PS, Δt = 40 ms, BW = 10 MHz
PS, Δt
= 80 ms, BW = 10 MHz
(c) FTP II + VoIP
Figure 9: Impact of traffic type and bandwidth size on the number of generated mobility events.
FAPs are moved from living room to the next room, the
power of the FAPs are reduced approximately by 5 dB.
The situation is substantially improved by SOS. The
number of mobility events is reduced approximately ten
times (when compare to ACS-MB) and five times (in
comparison to eACS-MB) for FAPs distances between 0.5 m
to 3.5 m from the house boundary. T he mobility events are
practically e liminated for FAPs distance higher than 3.5 m.
Nonetheless, drawback of this mechanism is that UEs within
the house boundary are not always connected directly to the
FAPs, since the signals from other stations (especially from
the MBS) are stronger. In the performed simulation, the UE
is served by the FAPs on average only by 47% of simulation
time if FAPs position is close to the house boundary (see
12 EURASIP Journal on Wireless Communications and Networking
Normalized throughput (−)
0123
45
67
0
0.1
0.2
0.3
0.4
0.5
0.6
0.7
0.8
0.9
1
FAP distance from the house boundary (m)
(a) VoIP, 10 MHz
Normalized throughput (−)
0123
45
67
0
0.1
0.2
0.3
0.4
0.5
0.6
0.7
0.8
0.9
1
FAP distance from the house boundary (m)
(b) FTP I + VoIP, 10 MHz
Normalized throughput (−)
0123
45
67
0
0.1
0.2
0.3
0.4
0.5
0.6
0.7
0.8
0.9
1
FAP distance from the house boundary (m)
ACS-MB (indoor)
eACS-MB (indoor)
SOS (indoor)
PS (indoor)
ACS-MB (overall)
eACS-MB (overall)
SOS (overall)
PS (overall)
(c) FTP II + VoIP, 3 MHz
Normalized throughput (−)
0123
45
67
0
0.1
0.2
0.3
0.4
0.5
0.6
0.7
0.8
0.9
1
FAP distance from the house boundary (m)
ACS-MB (indoor)
eACS-MB (indoor)
SOS (indoor)
PS (indoor)
ACS-MB (overall)
eACS-MB (overall)
SOS (overall)
PS (overall)
(d) FTP II + VoIP, 10 MHz
Figure 10: Comparison of achieved throughput for individual schemes.
Table 4). Even though the results are improved for farther
FAPs locations, the PS and both ACS methods always assure
100% FAPs coverage within the household. Thus, the main
purpose of the FAPs, that is, to cover w hole house, is not
fully accomplished as in case of ACS-MB and PS schemes.
More than that, the indoor mobility increases the overall
number of mobility events occurred during simulation (this
is notable in Figure 8 for the FAPs position between 1.5 m
and 3.5 m).
The performance of the proposed mechanism is depen-
dent on the selection of the appropriate adaptation step ΔP.
If the adaptation step is set to the default value of 0.1 dB and
PS I is considered, the number of mobility events is decreased
roughly to 50% when compared to ACS-MB. The obtained
results are only slightly better than in case of e ACS-MB.
Further minor improvement is achieved by utilizing of PS II.
In order to improve the results obtained by PS, the optimal
value for adaptation power step ΔP is necessary to be found
as described in Section 3.3. The performance of PS II is also
illustrated in Figure 8 for different values of ΔP. The results
indicate that the number of mobility events is noticeably
decreased if appropriate value for ΔP corresponding to 2 dB
is selected (no improvement for ΔP values higher than 2 dB
was observed in simulations). The important outcome is that
due to optimization process, the results are even better than
in case of SOS for FAPs position greater than 2 m from the
house’s edge.
The other parameters that can potentially influence the
efficiency of the proposal are (i) the amount of generated
traffic (in Figure 8, FTP I was used), (ii) FAPs bandwidth
EURASIP Journal on Wireless Communications and Networking 13
Table 4: Percentual coverage of UEs by the FAPs.
FAPs position (m) 0.5 1.0 1.5 2.0 2.5 3.0 3.5 4.0 4.5 5.0 5.5 6.0 6.5 7.0
FAPs coverage (%)
SOS 47 50 52 53 63 71 86 100 100 100 100 100 100 100
PS, ACS 100 100 100 100 100 100 100 100 100 100 100 100 100 100
01234567
−20
−15
−10
−5
0
5
10
15
20
25
30
FAP distance from the house boundary (m)
Mean transmit power (dBm)
ACS-MB
eACS-MB, FTP II + VoIP
SOS
PS, BW
= 3/5/10, VoIP
PS, BW
= 3,FTPI+VoIP
PS, BW
= 10,FTPI+VoIP
PS, BW
= 3, FTP II + VoIP
PS, BW
= 10, FTP II + VoIP
Figure 11: Mean transmit power of FAPs.
(in Figure 8,BW= 3 MHz was utilized), and (iii) the length
of adaptation interval Δt in Figure 8, Δt
= 10 ms was con-
sidered). Note that the number of mobility events observed
in case of ACS and SOS is independent on these parameters
and eACS performance is influenced only by traffictype
(inactivity and activity periods). Consequently, the impact of
the above-mentioned parameters is investigated only on PS.
In addition, from now on, only PS II utilizing optimal ΔP will
be considered. Figure 9(a) takes into account simple VoIP
model without any data transmission. This case corresponds
to the scenario wh en users utilize the FAPs only to handle
voice calls. The proposed mechanism always outperforms all
schemes independently on the selected channel bandwidth.
Figure 9(b) further indicates that if the FAPs transmits voice
together with data (FTP I + VoIP), the results are rather
in favor of PS than of SOS if the FAPs are positioned in
sufficient distance from the house boundary (at least 1.5 m
for BW
= 5/10 MHz and at least 2 m for BW = 3 MHz). The
performance of eACS-MB has been significantly degr aded
(in comparison with VoIP model) due to higher UEs activity.
If the FTP II together with VoIP is used instead of FTP
I, the performance of PS and eACS-MB is distinguishable
worse (see Figure 9(c)). Nevertheless, the number of mobility
events for PS is significantly lowered for wider channel
bandwidth despite high t raffic load generated by FTP II
and VoIP models. In fact, the PS is still able to outperform
SOS scheme if at least bandwidth of 10 MHz is allocated
to the FAPs and when reasonable FAPs position inside the
household is selected (at least 2 m from the house boundary).
Figure 9(c) further il lustrates the influence of varying Δt on
PS scheme (note that in case of VoIP and FTP I + VoIP traffic
models, no negative effec t on PS’s performance was found).
It is demonstrated that for longer adaptation intervals the
number of mobility events is increased. Nevertheless, in
case of 10 MHz channel bandwidth, the negative effect is
insignificant as the PS stil l performs better for FAPs located
at least 2.5 m from house edge.
Figure 10 depicts the performance of individual schemes
in terms of achieved throughput for selected trafficmodels
and channel bandwidth allocated to the FAPs. For better
comparison of schemes and scenarios, the throughput is
normalized to the maximal value obtained during the
evaluation. Furthermore, performance is analyzed only for
10 MHz bandwidth in c ase of low trafficload(VoIP,FTP
I + VoIP), since the results for other bandwidths are
similar. The scenarios labeled as “indoor” corresponds to
the average throughput reached by FAPs. The aim is to
achieve the same indoor throughput as in case of ACS-MB
scheme for individual schemes. The reason is that ACS-MB
is transmitting with highest power and provides the best
house coverage. On the other hand, the scenarios marked
as “overall” represent the throughput obtained by the FAPs
and MBS together. Consequently, these scenarios show the
negative effect of FAPs on passersby users attached to the
MBS, since higher FAPs transmitting power lowers the CINR
experienced by passerby UEs.
If the PS scheme is used, the FAPs are always able to serve
the same amount of data as in case of ACS-MB or eACS-MB.
This is not valid for SOS method, as indoor users are not
attached to the FAPs all the time. Consequently, the MBS has
to serve these users which degrade the overall throughput.
This is notable especially for heavy trafficloadwhenFTP
II together with VoIP is used for indoor users. Figure 10
further indicates that simple ACS-MB significantly degrades
performance of outdoor users. Nevertheless, if the FAPs are
close to the middle of house (FAPs distance from the house
boundary is at least 6 m in our scenario), the results are
comparable to SOS scheme as the FAPs transmitting power is
the same for both methods. Significantly better results than
those reached by ACS-MB are observed for eACS-MB when
the results are even better than for SOS scheme. Nonetheless,
this is true only for VoIP and FTP I + VoIP models. If FTP
II + VoIP model is implemented, eACS-MB surpass ACS-MS
only slightly, while SOS offers better result for FAPs position
up to 5 m from the house boundaries.
Figure 10 also demonstrates that the PS scheme outper-
forms all conventional schemes in term of overall throughput
forVoIPandFTPI+VoIPtrafficloads.Incaseofheavy
traffic load, our proposed scheme has always better results
but for SOS scheme. Nonetheless, PS is still better than
14 EURASIP Journal on Wireless Communications and Networking
−20 −15 −10 −5 0 5 10152025
0
0.1
0.2
0.3
0.4
0.5
0.6
0.7
0.8
0.9
1
FAP transmitting power (dBm)
CDF
ACS-MB
eACS-MB, FTP II + VoIP
SOS
PS, BW
= 3/5/10, VoIP
PS, BW
= 3,FTPI+VoIP
PS, BW
= 10, FTP I + VoIP
PS, BW
= 3, FTP II + VoIP
PS, BW = 10, FTP II + VoIP
(a)
−20 −15 −10 −5 0 5 10152025
0
0.1
0.2
0.3
0.4
0.5
0.6
0.7
0.8
0.9
1
FAP transmitting power (dBm)
CDF
ACS-MB
eACS-MB, FTP II + VoIP
SOS
PS, BW
= 3/5/10, VoIP
PS, BW
= 3,FTPI+VoIP
PS, BW = 10,FTPI+VoIP
PS, BW
= 3, FTP II + VoIP
PS, BW
= 10, FTP II + VoIP
(b)
Figure 12: Distribution of FAPs transmitting power, distance of FAPs from house boundary 0.5 m (a) and 7 m (b).
SOS scheme if the FAPs distance from house boundaries is
at least 4 m (for bandwidth equal to 3 MHz) or 1 m (for
bandwidth equal to 10 MHz), respectively. Although the
SOS outperforms our schemes for FAPs position closer to
the sidewalk, the performance of SOS scheme in general
terms is not satisfactory. The main reason is that the FAPs
transmitting power is adapted in dep endence on the number
of mobility e vents. Thus, the CINR experienced by passerby
UEs is very low as the signal strength received from msB is
only marginally higher than signal received from the FAPs;
that is, low efficient MCS has to b e utilized.
Figure 11 depicts the mean value of FAPs transmit-
ting power for selec ted scenarios considered in Figure 9.
The highest transmitting power is reached for ACS-MB
scheme, which is varying between 19 dBm and 6 dBm over
the distance between the FAPs and the house edge. The
mean transmitted power of the proposed power control
mechanism varies between 0 dBm to
−18 dBm depending
on current traffic model type, channel bandwidth, and FAPs
position. All power control methods except of the SOS
show gradual decrease of transmitting power if the FAPs
location is moving from the house boundary to the centre.
The mean transmitting power of FAPs increases for SOS,
since this scheme attempts to maximize indoor coverage.
Consequently, as the FAPs position is successively farther
from the house boundary the transmitting power can be
continuously increased, while the interference to outdoor
users is not. It is clear that in case of SOS scheme, the
mean transmitting power is always higher then PS for FAPs
distance between 2.5 m and 7 m. In addition, also eACS-MB
method achieves lower mean transmission power for FAPs
location between 5 m and 7 m. Figure 11 further indicates
that the proposed scheme has also a p otential to save power
energy.
Figure 12 illustrates a CDF of FAPs transmitting power
for two FAPs position. In general, the results are comparable
to the outcomes described in previous figure. More than that,
it is clear that the transmitting power in case of the proposed
scheme is much more varying than in case of ACS-MB and
SOS schemes. This is due to the fact that the proposed
scheme adjusts dynamically transmitting power according
current conditions.
Figure 13 shows an example of distribution of the frame
utilization during the whole simulation time for heavy traffic
load. Furthermore, only two scenarios differing in FAPs
bandwidth are taken into account, for each investigated
scheme. In general, the lowest frame utilization is obtained
for ACS and eACS. This is due to the fact that in case of
both schemes, the FAPs are transmitting with highest power
(at least if one of the indoor UE is active). Figure 13 further
illustrates that the PS scheme frame utilization is the hig hest,
which is the consequence of proposed principle to maximize
FAPs frame utilization. A difference between PS scheme
and other schemes is more significant especially for broader
channel bandwidth.
6. Conclusion
The paper proposes the power control mechanism, which
dynamically adapts the transmitting power of FAPs depend-
ing on the current traffic load and signal quality received at
the side of UEs. The results demonstrate that the optimized
PS mechanism significantly outperforms both evaluated ACS
schemes. Despite of this, the PS is able to guarantee the same
EURASIP Journal on Wireless Communications and Networking 15
0 0.2 0.4 0.6 0.8 1
0
0.1
0.2
0.3
0.4
0.5
0.6
0.7
0.8
0.9
1
Frame utilization (
−)
CDF
ACS-MB
eACS-MB
SOS
PS
(a)
0 0.2 0.4 0.6 0.8 1
0
0.1
0.2
0.3
0.4
0.5
0.6
0.7
0.8
0.9
1
Frame utilization (
−)
CDF
ACS-MB
eACS-MB
SOS
PS
(b)
Figure 13: Distribution of frame utilization for FAPs distance of 0.5 m from house boundary, FTP II + VoIP model, BW = 3MHz(a)and
BW
= 10 MHz (b).
QoS to FAPs users as in case of ACS-MB or eACS-MB. When
compared to the SOS trying to mitigate mobility events
while maximizing indoor coverage, the results achieved
by our power control method are always better as long
as the generated traffic is at l ight or medium levels and
sufficient amount of radio resources is allocated to the FAPs.
Nonetheless, with optimized power adaptation step equal
to 2 dB, the PS outperforms SOS also at heavy tr afficload
if sufficient amount of radio resources is allocated to the
FAPs while they still enable the coverage of all users in the
house. The further benefit of the proposed power control
scheme can be seen in its potential to minimize overall power
consumption by the FAPs.
In the future, our intention is to investigate the impact
of adaptive power control step ΔP and to analyze the effect
of different target frame utilization ϑ
target
on the system
performance.
Acknowledgments
This work has been performed in the framework of the
FP7 Project FREEDOM IST-248891 STP, which is funded
by the European Community. The authors would like to
acknowledge the contributions of their colleagues from
FREEDOM Consortium ( />References
[1] Presentations by ABI Research, Picochip, Airvana, IP.access,
Gartner, Telefonica Espana, 2nd International Conference
on Home Access Points and Femtocells, December 2007,
/>pre-
sentations.htm.
[2] A. Golaup, M. Mustapha, and L. B. Patanapongpibul, “Fem-
tocell access control strategy in UMTS and LTE,” IEEE
Communications Magazine, vol. 47, no. 9, pp. 117–123, 2009.
[3] D. Lopez-Pereze, A. Valcarce, A. Ladanyi, G. de la Roche,
and J. Zhang, “Intracell handover for interference and han-
dover mitigation in OFDMA two-tier macrocell-femtocell
networks,” EURASIP Journal on Wireless Communications and
Networking, vol. 2010, Article ID 142629, 2010.
[4] J. D. Hobby and H. Claussen, “Deployment options for fem-
tocells and their impact on existing macrocellular networks,”
Bell Labs Technical Journal, vol. 13, no. 4, pp. 145–160, 2009.
[5] H. Claussen, “Performance of macro- and co-channel fem-
tocells in a hierarchical cell structure,” in Proceedings of the
18th Annual IEEE International Symposium on Personal, Indoor
and Mobile Radio Communications (PIMRC ’07), pp. 1–5,
September 2007.
[6] Z. Bharucha, H. Haas, A. Saul, and G. Auer, “Through-
put enhancement through femto-cell deployment,” European
Transactions on Telecommunications, vol. 41, pp. 311–319,
2009.
[7] V. Chandrasekhar, J. G. Andrews, and A. Gatherer, “Femtocell
networks: a survey,” IEEE Communications Magazine, vol. 46,
no. 9, pp. 59–67, 2008.
[8] 3rd Generation Partnership Project, “Technical specification
group radio access network; evolved universal terrestrial radio
access (E-UTRA); physical channels and modulation,” Tech.
Rep. 3GPP TS 36.300 v 10.0.0, June 2010, Release 10.
[9]H.S.Jo,J.G.Yook,C.Mun,andJ.Moon,“Aself-
organized uplink power control for cross-tier interference
management in Femtocell networks,” in Proceedings of the
IEEE Military Communications Conference (MILCOM ’08),pp.
1–6, November 2008.
[10] V. Chandrasekhar, J. G. Andrews, T. Muharemovic, Z. Shen,
and A. Gatherer, “Power control in two-tier femtocell net-
works,” IEEE Transactions on Wireless Communications, vol. 8,
no. 8, pp. 4316–4328, 2009.
16 EURASIP Journal on Wireless Communications and Networking
[11] V. Chandrasekhar, J. G. Andrews, Z. Shen, T. Muharemovic,
and A. Gatherer, “Distributed power control in femtocell-
underlay cellular networks,” in Proceedings of the IEEE Global
Telecommunications Conference (GLOBECOM ’09), pp. 1–6,
November-December 2009.
[12] H. Claussen, L. T. W. Ho, and L. G. Samuel, “Self-optimization
of coverage for femtocell deployments,” in Proceedings of the
7th Annual Wireless Telecommunications Symposium (WTS
’08), pp. 278–285, April 2008.
[13]H.Claussen,F.Pivit,andL.T.W.Ho,“Self-optimizationof
femtocell coverage to minimize the increase in core network
mobility signalling,” Bell Labs Technical Journal,vol.14,no.2,
pp. 155–184, 2009.
[14] H. Claussen, L. T. W. Ho, and L. G. Samuel, “An overview of
the femtocell concept,” Bell Labs Technical Journal, vol. 13, no.
1, pp. 221–246, 2008.
[15] S.Y.Choi,T J.Lee,M.Y.Chung,andH.Choo,“Adaptive
coverage adjustment for femtocell management in a residen-
tial scenario,” in Proceedings of the 12th Asia-Pacific Network
Operations and Management Symposium (APNOMS ’09), vol.
5787, pp. 221–230, 2009.
[16]H S.Jo,C.Mun,J.Moon,andJ G.Yook,“Self-optimized
coverage coordination in femtocell networks,” IEEE Transac-
tions on Wireless Communications, vol. 9, no. 10, pp. 2977–
2982, 2010.
[17] S. Yun and D H. Cho, “Traffic density based power control
scheme for femto AP,” in Proceedings of the IEEE International
Symposium on Personal, Indoor and Mobile Radio Communica-
tions (PIMRC ’10), pp. 1378–1383, September 2010.
[18] P. Mach and Z. Becvar, “Dynamic power control procedure
forfemtocellsbasedonframeutilization,”inProceedings of the
International Conference on Wireless and Mobile Communica-
tion (ICWMC ’10), pp. 498–503, September 2010.
[19] S. Sesia, I. Toufik, and M. Baker, LTE—The UMTS Long Term
Evolution—From Theory to Practice, 2009.
[20] T. Abe, “3GPP Self-evaluation Methodology and results—
assumptions,” 3GPP LTE-Advanced Evaluation Workshop,
December 2009, />2009-12-17
ITU-R IMT-Adv eval/docs/pdf/REV-
090007%20SelfEvalulation%20assumption.pdf.
[21] Y. Chen, X. Wen, X. Lin, and W. Zheng, “Research on
the modulation and coding scheme in LTE TDD wireless
network,” in Proceedings of the International Conference on
Industrial Mechatronics and Automation (ICIMA ’09), pp. 468–
471, May 2009.
[22] C. Hoymann, “Analysis and performance evaluation of the
OFDM-based metropolitan area network IEEE 802.16,” Com-
puter Networks, vol. 49, no. 3, pp. 341–363, 2005.
[23] IEEE 802.16m, Evaluation Methodology Document, IEEE
802.16m paper No. 08/004r2, 2008.
[24] Femto Forum, “Interference Management in UMTS Fem-
tocells,” white paper, February 2010, to-
forum.org .