Báo cáo hóa học: " Lateral homogeneity of the electronic properties in pristine and ion-irradiated graphene probed by scanning capacitance spectroscopy" pot
Bạn đang xem bản rút gọn của tài liệu. Xem và tải ngay bản đầy đủ của tài liệu tại đây (556.61 KB, 8 trang )
NANO REVIEW Open Access
Lateral homogeneity of the electronic properties
in pristine and ion-irradiated graphene probed by
scanning capacitance spectroscopy
Filippo Giannazzo
1*
, Sushant Sonde
1,2
, Emanuele Rimini
1,3
, Vito Raineri
1
Abstract
In this article, a scanning probe method based on nanoscale capacitance measurements was used to investigate
the lateral homogeneity of the electron mean free path both in pristine and ion-irradiated graphene. The local
variations in the electronic transport properties were explained taking into account the scattering of electrons by
charged impurities and point defects (vacancies). Electron mean free path is mainly limited by charged impurities
in unirradiated graphene, whereas an important role is played by lattice vacan cies after irradiation. The local
density of the charged impurities and vacancies were determined for different irradiated ion fluences.
Introduction
Graphene, a two-dimensional (2D) sheet of carbon atoms
in a h oneycomb la ttice, attracted th e in terest of t h e nanoe -
lectronics scientific community for its remarkable carrier
transport properties [1,2]. Ideally, in a free-sta nding gra-
phene s heet without lattice defects and adsorbed impurities,
charge carriers can exhibit a giant i ntrinsic mobility [2] and
can travel for micrometers without scattering at room tem-
perature. As a matter of fact, very high values of mobility
(>2 × 10
5
cm
2
V
-1
s
-1
) and electron mean free path have
been observed only in vacuum and at low temperature (5
K) in “suspended” graphene sheets obtained by mechanical
exfoliation of highly oriented pyrolytic graphite (HOPG)
[3]. The mobility values measured at room temperature
commonly reported in the literature range from approxi-
mately 2 to 2 × 10
4
cm
2
V
-1
s
-1
, depending on the graphene
synthesis methods [1,4], on the kind of substrate on which
it is deposited [5], and on the processing conditions used to
fabricate the test patterns for electrical characterization.
This large variability is a clear indication that the intrinsi-
cally outstanding transport properties of graphene are
severely limited by extrinsic factors, like the presence of
charged impurities, lattice defects and, more generally, by
lattice disorder (including lo cal str ain). Single layers of gra-
phene (SLG) obtained by mechanical exfoliation of HOPG
[1] typically exhibit a very high crystalline order, whereas a
high-defect density is present both in epitaxial graphene
growth by thermal decomposition of SiC [6] and in
graphene obtained by chemical reduction of graphene
oxide [7].
Recently, the intentional production of defects in
selected areas of a graphene sheet has also been proposed
as a method to locally modula te the transport properties.
Several methods, like plasma treatments [8], and electron
[9] or ion irradiation [10], have been used for this aim.
Recently, it has been reported that graphene hydrogena-
tion by exposure to atomic hydrogen resulted in the con-
version of graphene, a zero bandgap semiconductor, to
graphane, a two-dimensional insulator [11]. Among all
these methods, ion irradiation allows a better control
through a precise definition on the ion energy and flu-
ence. Spectroscopic character ization metho ds, like micro
Raman spectroscopy (μR), are the commonly used tech-
niques to evaluate the density of defects in a graphene
sheet. The characteristic D line at 1360 cm
-1
in the
Raman spectra is a fingerprint of defects/disorder in the
crystalline lattice of graphitic materials. However, the lat-
eral resolution of μR is limited by the laser spot size
(typically in the order of 0.5-1 μm). In this article, we pre-
sent a scanning probe method based on nanoscale capa-
citance measurements to determine locally (on 10-100
nm scale) the electron mean free path in pristine and in
ion-irradiated graphene with different ion fluences. The
impurity and vacancy densities on the probed area were
* Correspondence:
1
CNR-IMM, Strada VIII, 5, Zona Industriale, 95121, Catania, Italy
Full list of author information is available at the end of the article
Giannazzo et al. Nanoscale Research Letters 2011, 6:109
/>© 2011 Giannazzo et al; licensee Springer. This is an Open Access article distributed und er the terms of the Creative Commons
Attribution License (http://cre ativecommons.org/licenses/by/2.0), which permits unrestrict ed use, distribution, and reproduction in
any medium, provided the original work is properly cited.
extracted by fitting the experimental results with models
of electron scattering by Coulomb impurities and lattice
defects.
Experimental details
Graphene samples obtained by mechanical exfoliation of
HOPG were deposited on a n
+
-Si substrate covered with
100 nm SiO
2
[12]. Optical microscopy, tapping mode
atomic force microscopy (AFM) and μRspectroscopy
were used to identify SLG [13]. Some of the as-depos-
ited (pristine) samples were then irradiated with C
+
ions
at 500 keV. Irradiations of the samples with C
+
ions
were carried out under high vacuum conditions (10
-6
Torr) to minimize surface contaminations. At 500 keV
energy, the projected range of the C
+
ions is approxi-
mately 1 μm, quite deep into the n
+
-Si substrate. This
minimizes the damage b oth in the 100 nm SiO
2
layer
and at the interface between SiO
2
and n
+
Si. Infact, a
quality of SiO
2
and SiO
2
/Si interface comparable to that
of non-irradiated samples is crucial for the capacitance
measure ments discussed later. Different C
+
ion fluences,
ranging from 1 × 10
13
to 1 × 10
14
ions/cm
2
,wereused
for irradiation [14].
The lateral homogeneity of the electronic transport
properties both in pristine and i on-irra diated graphene
was investigated by local capacitance measurements on
the graphene/SiO
2
/n
+
Si stack, using scanning capaci-
tance spectroscopy (SCS) [12,15].
Scanning capacitance spectroscopy (SCS) was per-
formed at room temperature using a DI3100 AFM by
Veeco equipped with Nanoscope V electronics and with
the scanning capacitance microscopy (SCM) head. SCS is
an extension of the conventional SCM [16-19]. In SCS,
the conductive AFM tip is placed on a discrete array
of positions, lifting the tip by 20 nm at every interval.
This “step and measure” approach eliminates the lateral
(shear) force usually present when tip is scanned on a
surface. Moreover, the vertical contact force can be suita-
bly minim ized to get a good electrical contact to the gra-
phene layers while avoidin g damage at the same t ime. A
modulating bias ΔV = V
g
/2(1 + sin(ωt)), with amplitude
V
g
in the range from -1.2 to 1.2 V and frequency ω = 100
kHz, was applied between the Si n
+
backgate and the
nanometric contact on graphene represented by a Pt-
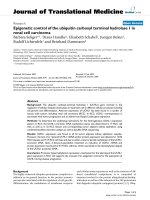
coa ted Si tip (see schematic in Figure 1). T he ultra-high-
sensitiv e (10
-21
F/Hz
1/2
) capac itance sensor connected to
the conduc tive AFM tip measures , through a lock-in sys-
tem, t he capacitance variation ΔC induced by the modu-
lating bias.
Results and discussion
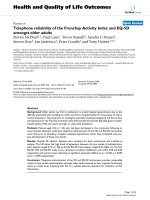
In Figure 2, capacitance-voltage curves measured on
fixed positions on bare SiO
2
and on graphene-coated
SiO
2
are reported for a sample not subjected to ion irra-
diation. The tip positions are indicated in the AFM
image in the inset of Figure 2a. When the tip is in con-
tact on bare SiO
2
, a typical capacitance-voltage curve for
a metal-oxide-semiconductor (MOS) capacitor from
accumulation (at negative sample bias) t o depletion (at
positive sample bias) is measured (see Figu re 2a). The
area of the MOS capacitor is represented by the tip con-
tact area A
tip
, as illustrated in the insert of Figure 2c.
When tip is in contact on graphene, the measured capa-
citance is minimum around zero bias and increases both
for negative and positive bias (see Figure 2b). At V
g
=0,
the Fermi level in graphene is almost coincident with
the Dirac point. A positive modulating bias between the
substrate and the tip locally induces a shift of the gra-
phene quasi-Fermi energy E
F
in the conduction band,
and, hence, an accumulation of electrons at the
SCM SCM
Electronic
Module
i
SiO
2
SLG
Electronic
Module
i
SiO
2
SLG
~
n
+
S
i
~
n
+
S
i
V'V'
Figure 1 Schematic representation of the scanning capacitance spectroscopy setup.
Giannazzo et al. Nanoscale Research Letters 2011, 6:109
/>Page 2 of 8
nanometric tip/graphene contact. On the contrary, a
negative bias induces a shift of E
F
in the valence band,
and, hence, an accumulation of holes at the tip/gra-
phene contact. The carrier density n induced by the
gate bias V
g
can be expressed as n = C
ox
’V
g
/q,whereq
is the electron charge, and C
ox
’ is the oxide capacitance
per unit area (C
ox
’ = ε
ox
ε
0
/t
ox
,beingε
0
the vacuum per-
mittivity, ε
ox
=3.9andt
ox
are the relative permittivity
and the thickness of the SiO
2
film, respectively). The
value of E
F
can be related to the applied bias as E
F
=
ħ v
F
k
F
,beingk
F
=(πn)
1/2
, ħ the reduced Planck’scon-
stant, and v
F
=1×10
6
m/s, the electron Fermi velocity
in graphene. The in duced charge n spreads over an
area, A
eff
, which can be thought as the tip-graphene-
insulator-semiconductor capacitor effective area
(as schematically illustrated in the insert of Figure 2c).
TheeffectiveareaA
eff
can be evaluated from the ratio
of the capacitance measured with the probe on gra-
phene-coated regions (|ΔC
gr
|) and on bare SiO
2
regions
(|ΔC
ox
|) [15], i.e., A
eff
= A
tip
|ΔC
gr
|/|ΔC
ox
|, where the tip
contact area A
tip
can be independently determined by
scanning electron microscopy (A
tip
=80nm
2
in the pre-
sent case). The evaluated A
eff
is reported as a function
of the gate bias in Figure 2c. Except for V
g
=0,A
eff
increases linearly with |V
g
| both f or negative and posi-
tive V
g
values.
It has been recently demonstrated that the effective
area A
eff
obtained by local capacitance measurements is
related to the local electron mean free path l in gra-
phene by A
eff
= πl
2
[20]. In Figure 3, l is reported versus
the evaluated Fermi energy. It can be noted that l
is almost independent of E
F
close to the Dirac point.
0.05
0.10
S
(
a.u.
)
graphenegraphene
-
0.05
0.00
SiO
2
'
C
MO
S
1 Pm1 Pm1 Pm1 Pm
SiO
2
1 Pm1 Pm1 Pm1 Pm
SiO
2
(a)
0.05
10
-1
10
0
graphene
C
tot
(a.u.)
1.0
n
m
2
)
10
-2
'
C
A
eff
A
eff
Graphene
A
tip
GrapheneGraphene
Graphene
A
eff
A
eff
A
eff
A
eff
(b)
00
0.5
e
ff
(x10
4
n
SiO
2
(
c
)
-1.0 -0.5 0.0 0.5 1.0
0
.
0
V
g
(V)
A
e
()
Figure 2 Evaluation of the effective area from local capacitance measurements. Local capacitance-voltage curves measured on fixed
positions on bare SiO
2
(a) and on graphene-coated SiO
2
(b) for a sample not subjected to ion irradiation. AFM morphology of a graphene flake
on SiO
2
, with indicated the probed positions by the SCS tip. (inset of a). Effective area evaluated from the C-V curves in (a) and (b). Schematic
representation of A
tip
and A
eff
(inset of c).
Giannazzo et al. Nanoscale Research Letters 2011, 6:109
/>Page 3 of 8
The behavior close to the Dirac point is consistent with
the common adopted picture of the 2D EG split in a
landscape of adjacent “electron-hole puddles” [21]. Close
to the Dirac point, the effect of a gate bias is limited to
a redistribution of carriers between the electrons and
holes puddles without significantly changing the t otal
carrier density. Figure 3 shows also that, for |E
F
|>25
meV, l increases linearly with E
F
both in the hole and
electron branches. This linear dependence gives indica-
tion on the main scattering mechanisms limiting l in
our graphene samples.
Recently, expressions of the energy dependence of l
have been determined for the different scattering
mechanisms in the framework of a semiclassical model
based on the Boltzmann transport theory [22]. The elec-
tron mean free path limited by scattering with graphene
acoustic phonons (l
phon
) can be expressed as [22]
lE
vv
DkT
E
phon F
sF
A
F
323
2
1
(1)
where r is the graphene density (r = 7.6 × 10
-7
kg/m
2
)
[2], D
A
is the acoustic deformation potential (D
A
=18
eV) [2], v
s
is the sound velocity in graphene [2], k
B
is
the Boltzmann constant, and T is the absolute
temperature.
The electron mean free path limited by Coulomb scat-
tering with charged impurities (l
ci
) can be expressed as
[22]
lE
v
ZqN
q
v
E
ci F
F
ci
F
F
16
1
0
22
24
2
0
2
.
(2)
where ε = 2.4 is the average between ε
ox
and the
vacuum relative dielectric constant, Z is the net charge
of the impurity (it will be assumed Z =1),andN
ci
is
the density of impurities.
Finally, the electron mean free path for scattering by
vacancies (l
vac
) can be expressed as [22]
lE
E
Nv
E
v
R
vac F
F
vac F
F
F
2
0
2
ln
(3)
where N
vac
is the density of vacancies in graphene and
R
0
is the vacancy radius, that we assumed to be coinci-
dent with the C-C distance in the graphene plane
(approximately 0.14 nm).
The experimentally determined linear dependence of l
on E
F
, far from the Dirac point, suggests that scattering
with charged impurities and/or point defects, e.g., vacan-
cies, can be assumed as the main mechanisms limiting
electron mean free path.
In this pristine graphene sample, the density of defects is
negligible, as confirmed by the absence of the characteris-
tic D peak in micro-Raman spectra. Hence, charged impu-
rities, either adsorbed on graphene surf ace, or located at
the interface with SiO
2
substrate, can be assumed as the
main scattering source liming l.Thedensityofcharged
impurities in the probed position can be estimated by fit-
ting the experimental curves in Figure 3 with Equation 2.
The best fit (red line) is obtained with N
ci
=49×10
10
cm
-2
both for the holes and the electron b ranch.
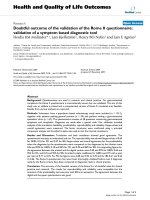
In Figure 4a, l versus E
F
measured on an array of 5 ×
5 tip positions on pristine graphene is reported. By fit-
ting each curve of the array with Equation 2, the local
density N
ci
for each probed position can be extracted.
The histogram of the charged impurity density on the
analyzed area is reported in Figure 5a. It exhibits a
Gaussian distribution peaked at 〈N
ci
〉 =50×10
10
cm
-2
and with FWHM of 4 × 10
10
cm
-2
.
50
30
40
50
(
nm)
-
50
-
25
0
25
50
10
20
l
(
50
25
0
25
50
E
F
(meV)
Figure 3 Local electron mean free path versus the Fermi energy in a selected position on pristine graphene.
Giannazzo et al. Nanoscale Research Letters 2011, 6:109
/>Page 4 of 8
In Figure 4b,c, the measured l versus E
F
is reported
for two arrays of tip positions on graphene samples irra-
diated with two different ion fluences, i.e., F =1×10
13
cm
-2
and F =1×10
14
cm
-2
.Comparingthesetof
curves in Figure 4a, i.e., for pristine sample, with those
on Figure 4b,c, it is evident that the lateral inhomogene-
ity in the l values increases with the irradiated fluence.
However, it is wo rth noting that two groups of l-E
F
curves can be distinguished for irradiated samples:
(i) a first group, with l values comparable to those in
the pristine sample, (ii) a second group with reduced
mean free path. We assumed that C irradiation causes
the formation of point defects (vacancies), whereas the
density of charged impurities adsorbed on the graphene
surface or at the interface with the substrate remains
almost unchanged. Hence, the first group o f curves in
Figure 4b,c can be associated to the probed positions on
the graphene surface without or with a very low density
40
Unirradiated
CI
40
Unirradiated
CI
40
Unirradiated
CICI
20
40
l
(
nm
)
Unirradiated
20
40
l
(
nm
)
Unirradiated
20
40
l
(
nm
)
Unirradiated
0
40
)=1x10
13
cm
-2
CI
(a)
0
40
)=1x10
13
cm
-2
CI0
40
)=1x10
13
cm
-2
CICI
(a)
20
40
m
)
CI+VA
C
20
40
m
)
CI+VA
C
20
40
m
)
CI+VA
C
0
l (n
m
)
=1x10
14
cm
-2
CI
(b)
0
l (n
m
)
=1x10
14
cm
-2
CI
0
l (n
m
)
=1x10
14
cm
-2
CI
(b)
20
40
)
=1x10
cm
CI+VAC
20
40
)
=1x10
cm
CI+VAC
20
40
)
=1x10
cm
CI+VAC
0
20
30
40
50
60
(c)
0
20
30
40
50
60
0
20
30
40
50
60
(c)
30
40
50
60
E
F
(meV)
30
40
50
60
E
F
(meV)
30
40
50
60
E
F
(meV)
Figure 4 Local electron mean free path versus the Fermi energy measured on array of several tip positions on pristine and irradiated
graphene at different fluences. On pristine graphene (a). On irradiated graphene with 500 keV C
+
ions at fluences 1 × 10
13
cm
-2
(b) and 1 ×
10
14
cm
-2
(c), respectively.
Giannazzo et al. Nanoscale Research Letters 2011, 6:109
/>Page 5 of 8
of point defects, whereas the second group associated to
the probed positions with point defects. For the first
group of curves, l can be fitted using Equation 2. The
histograms of the N
ci
values determined in the probed
positions is reported in Figure 4b,c, red bars, for the
lowest and high est doses, respectively. It is worth noting
that the N
ci
distributions in irradiated samples are very
similar to those of non-irradiated sample. For the sec-
ond group of curves in Figure 4b,c, l is limited both by
charged impurities and vacancies scattering, i.e.,
ll l
1
ci
1
vac
1
(4)
For simplicity, an average value of the charged impuri-
tiesdensitywillbeassumedinthosepositions(〈N
ci
〉 =
50 × 10
10
cm
-2
), and the local vacancy density was
determined from Equations 2-4 using N
vac
as the fitting
parameter. The distributions of the vacancy densities in
the probed positions are reported in Figure 5b,c, blue
bar, for the two fluences. It is worth noting, that, while
in graphene irradiated with the lowest fluence N
vac
is
higher than 2.5 × 10
10
cm
-2
(i.e. more than one vaca ncy
on the probed area at V
g
=1V)ononly16%ofthe
probed positions, in graphene irradiated with the highest
fluence N
vac
>2.5×10
10
cm
-2
on more than 75% of the
probed positions.
For each fluence, the weighted average of the vacancy
density on the probed area can be o btained by
NNf
ii
i
n
vac vac
,
1
,beingN
vac,i
the value s of the
vacancy densitie s in the histograms and f
i
the associated
frequencies. The obtained 〈N
vac
〉 exhibits a linear
50
Unirradiated
(a)
50
Unirradiated
(a)
00
50
)=1x10
13
cm
-2
(%)
i
Charged
impurities
(b)
50
)=1x10
13
cm
-2
(%)
i
Charged
impurities
(b)
0
q
uency
)=1x10
14
cm
-2
vacanc
i
es
Ch d
(c)
0
q
uency
)=1x10
14
cm
-2
vacanc
i
es
Ch d
(c)
Fre
q
0
50
vacancies
Ch
arge
d
impurities
Fre
q
0
50
vacancies
Ch
arge
d
impurities
0 1020 40506
0
0
N
CI
, N
vac
(10
10
cm
-2
)
0 1020 40506
0
0
N
CI
, N
vac
(10
10
cm
-2
)
CI
vac
CI
vac
Figure 5 Histograms of the locally measur ed densities of charged impurities and vacancies in pristine and ion irradiated graphene.
Charged impurities density in pristine graphene (a). Charged impurities and vacancy densities in irradiated graphene with 500 keV C
+
ions at
fluences 1 × 10
13
cm
-2
(b) and 1 × 10
14
cm
-2
(c), respectively.
Giannazzo et al. Nanoscale Research Letters 2011, 6:109
/>Page 6 of 8
increase as a function of fluence, as reported in Figure 6.
This trend can be fitted by the following relation:
NN N
vac vac gr
,0
(5)
where 〈N
vac,0
〉 is the extrapo lation of the average
vacancy density at F =0,s is the cross section for
direct C-C collisions, N
gr
is the C density in a graphene
sheet (N
gr
=4×10
15
cm
-2
), and ν is the vacancy genera-
tion efficiency. By linear fittin g the data in Figure 6,
〈N
vac,0
〉 =(1.59±0.04)×10
10
cm
-2
and νsN
gr
=(8.55±
0.06) × 10
-4
are obtained. For the calculated values of
the C-C scattering cross section s, ranging from 2 × 10
-
17
to 7 × 10
-17
cm
2
, a very low vacancy generation effi-
ciency (ranging approximately from 0.3 t o 1.1%) is
obtained for graphene irradiation with 500 keV C
+
ions.
It might be associated to a dynamical annealing, e.g.
vacancy-interstitial recombination, during irradiation.
Conclusions
In summary, the authors pr opose an innovative method
based on local capacitance measurements to probe the
local changes in graphene electron mean free path, due
to the p resence of charged impurities or poi nt defects, e.
g., vacancies. Irradiation with 500 keV C
+
ions at fluences
ranging from 1 × 10
13
to 1 × 10
14
cm
-2
was used to intro-
duce defects in SLG deposited on a SiO
2
/n
+
Si substrate.
The local charged impurity and vacancy density distribu-
tions were determined for the different irradiation flu-
ences, and a low efficiency of vacancy generation
(approximately from 0.3 to 1.1%) was demonstrated.
Abbreviations
2D: two-dimensional; HOPG: highly oriented pyrolytic graphite; SCM:
scanning capacitance microscopy; SCS: scanning capacitance spectroscopy;
SLG: single layers of graphene.
Acknowledgements
The authors want to acknowledge S. Di Franco and A. Marino from CNR-
IMM, Catania, for their expert assistance in sample preparation and ion
irradiation experiments. This study has been supported, in part, by the
European Science Foundati on (ESF) under the EUROCORE program
EuroGRAPHENE, within GRAPHIC-RF coordinated project.
Author details
1
CNR-IMM, Strada VIII, 5, Zona Industriale, 95121, Catania, Italy
2
Scuola
Superiore di Catania, Via San Nullo, 5/I, 95123, Catania, Italy
3
Department of
Physics and Astronomy, University of Catania, Via S. Sofia, 95123, Catania,
Italy
Authors’ contributions
FG and VR conceived the study. FG coordinated the experiment, participated
to the analysis of the data and wrote the article. SS carried out the sample
preparation, the measurements and participated to the analysis of the data.
ER worked on the evaluation of ion-graphene interaction cross sections. All
the authors read and approved the manuscript.
Competing interests
The authors declare that they have no competing interests.
Received: 30 September 2010 Accepted: 31 January 2011
Published: 31 January 2011
References
1. Novoselov KS, Geim AK, Morozov SV, Jiang D, Zhang Y, Dubonos SV,
Grigorieva IV, Firsov AA: Electric Field Effect in Atomically Thin Carbon
Films. Science 2004, 306:666-669.
2. Chen JH, Jang C, Xiao S, Ishigami M, Fuhrer MS: Intrinsic and extrinsic
performance limits of graphene devices on SiO
2,
. Nat Nanotechnol 2008,
3:206-209.
3. Bolotin KI, Sikes KJ, Jiang Z, Klima M, Fudenberg G, Hone J, Kim P,
Stormer HL: Ultrahigh electron mobility in suspended graphene. Solid
State Commun 2008, 146:351.
4. Gomez-Navarro C, Thomas Weitz R, Bittner AM, Scolari M, Mews A,
Burghard M, Kern K: Electronic Transport Properties of Individual
Chemically Reduced Graphene Oxide Sheets. Nanoletters 2007, 7:3499.
5. Sonde S, Giannazzo F, Vecchio C, Yakimova R, Rimini E, Raineri V: Role of
graphene/substrate interface on the local transport properties of the
two-dimensional electron gas. Appl Phys Lett 2010, 97:132101.
6. Berger C, Song Z, Li X, Wu X, Brown N, Naud C, Mayou D, Li T, Hass J,
Marchenkov AN, Conrad EH, First PN, de Heer WA: Electronic Confinement
and Coherence in Patterned Epitaxial Graphene. Science 2006, 312:1191.
7. Eda G, Fanchini G, Chhowalla M: Large-area ultrathin films of reduced
graphene oxide as a transparent and flexible electronic material. Nat
Nanotechnol 2008, 3:270.
8. Kim K, Park HJ, Woo BC, Kim KJ, Kim GT, Yun WS: Electric property evolution
of structurally defected multilayer graphene. Nano Lett 2008, 8:3092.
9. Teweldebrhan D, Balandin AA: Modification of graphene properties due
to electron-beam irradiation. Appl Phys Lett 2009, 94:013101.
10. Chen JH, Cullen WG, Jang C, Fuhrer MS, Williams ED: Defect Scattering in
Graphene. Phys Rev Lett 2009, 102:236805.
11. Elias DC, Nair RR, Mohiuddin TMG, Morozov SV, Blake P, Halsall MP,
Ferrari AC, Boukhvalov DW, Katsnelson MI, Geim AK, Novoselov KS: Control
of Graphene’s Properties by Reversible Hydrogenation: Evidence for
Graphane. Science 2009, 323:610.
12. Sonde S, Giannazzo F, Raineri V, Rimini E: Dielectric thickness dependence
of capacitive behavior in graphene deposited on silicon dioxide. J Vac
Sci Technol B 2009, 27:868-873.
13. Giannazzo F, Sonde S, Raineri V, Patanè G, Compagnini G, Aliotta F,
Ponterio R, Rimini E: Optical, morphological and spectroscopic
characterization of graphene on SiO
2
. Phys Status Solidi C 2010, 7:1251.
14. Compagnini G, Giannazzo F, Sonde S, Raineri V, Rimini E: Ion irradiation
and defect formation in single layer graphene. Carbon 2009, 47:3201.
15. GiannazzoF,SondeS,RaineriV,RiminiE:ScreeningLengthandQuantum
CapacitanceinGraphenebyScanningProbeMicroscopy.Nano Lett 2009, 9:23.
16. Giannazzo F, Goghero D, Raineri V, Mirabella S, Priolo F: Scanning
capacitance microscopy on ultranarrow doping profiles in Si. Appl Phys
Lett 2003, 83:2659-2661.
-
2
)
5
10
10
10
cm
-
0246810
0
5
<N
vac
> (
)
(
10
13
cm
-2
)
Figure 6 Average vacancy density as a function of t he
irradiated fluence.
Giannazzo et al. Nanoscale Research Letters 2011, 6:109
/>Page 7 of 8
17. Giannazzo F, Raineri V, Mirabella S, Impellizzeri G, Priolo F: Drift mobility in
quantum nanostructures by scanning probe microscopy. Appl Phys Lett
2006, 88:043117.
18. Ciampolini L, Giannazzo F, Ciappa M, Fichtner W, Raineri V: Simulation of
scanning capacitance microscopy measurements on micro-sectioned
and bevelled n
+
-p samples. Mater Sci Semicond Process 2001, 4:85.
19. Giannazzo F, Priolo F, Raineri V, Privitera V, Picariello A, Battaglia A, Moffat S:
Two dimensional effects on ultra low energy B implants in Si. J Vac Sci
Technol B 2002, 20:414-418.
20. Giannazzo F, Sonde S, Raineri V, Rimini E: Irradiation damage in graphene
on SiO
2
probed by local mobility measurements. Appl Phys Lett 2009,
95:263109.
21. Martin J, Akerman N, Ulbricht G, Lohamann T, Smet JH, Von Klitzing K,
Yacobi A: Observation of electron-hole puddles in graphene using a
scanning single-electron transistor. Nat Phys 2008, 4:144.
22. Stauber T, Peres NMR, Guinea F: Electronic transport in graphene: A
semiclassical approach including midgap states. Phys Rev B 2007,
76:205423.
doi:10.1186/1556-276X-6-109
Cite this article as: Giannazzo et al.: Lateral homogeneity of the
electronic properties in pristine and ion-irradiated graphene probed by
scanning capacitance spectroscopy. Nanoscale Research Letters 2011
6:109.
Submit your manuscript to a
journal and benefi t from:
7 Convenient online submission
7 Rigorous peer review
7 Immediate publication on acceptance
7 Open access: articles freely available online
7 High visibility within the fi eld
7 Retaining the copyright to your article
Submit your next manuscript at 7 springeropen.com
Giannazzo et al. Nanoscale Research Letters 2011, 6:109
/>Page 8 of 8