Báo cáo hóa học: " The role of the surfaces in the photon absorption in Ge nanoclusters embedded in silica" potx
Bạn đang xem bản rút gọn của tài liệu. Xem và tải ngay bản đầy đủ của tài liệu tại đây (522.66 KB, 7 trang )
NANO EXPRESS Open Access
The role of the surfaces in the photon absorption
in Ge nanoclusters embedded in silica
Salvatore Cosentino
1
, Salvatore Mirabella
1*
, Maria Miritello
1
, Giuseppe Nicotra
2
, Roberto Lo Savio
1
,
Francesca Simone
1
, Corrado Spinella
2
, Antonio Terrasi
1
Abstract
The usage of semiconductor nanostructures is highly promising for boosting the energy conversion efficiency in
photovoltaics technology, but still some of the underlying mechanisms are not well understood at the nanoscale
length. Ge quantum dots (QDs) should have a larger absorption and a more efficient quantum confinement effect
than Si ones, thus they are good candidate for third-generation solar cells. In this work, Ge QDs embedde d in silica
matrix have been synthesized through magnetron sputtering deposition and annealing up to 800°C. The thermal
evolution of the QD size (2 to 10 nm) has been followed by transmission electron microscopy and X-ray diffraction
techniques, evidencing an Ostwald ripening mechanism with a concomitant amorphous-crystalline transition. The
optical absorption of Ge nanoclusters has been measured by spectrophotometry analyses, evidencing an optical
bandgap of 1.6 eV, unexpectedly independent of the QDs size or of the solid phase (amorphous or crystalline). A
simple modeling, based on the Tauc law, shows that the photon absorption has a much larger extent in smaller
Ge QDs, being related to the surface extent rather than to the volume. These data are presented and discussed
also considering the outcomes for application of Ge nanostructures in photovoltaics.
PACS: 81.07.Ta; 78.67.Hc; 68.65 k
Introduction
Nanostructured materials represent a promising route of
development for photovoltaics (PV) because of the
unique optical and electronic properties caused by the
quantum confinement of electrons and holes, allowing
to increase the effici ency of the sunlight-electricity con-
version [1-8]. It has been argued that quantum dots
(QD s) permit to gather a great part of solar energy in a
variety of modes, among which multiple exciton genera-
tion [1,6], intermediate band formation [7], or modula-
tion of the solar absorption based on the size tuning
due to the quantum confinement effect (QCE) [8]. Actu-
ally, confined Si (2- to 5-nm QDs) shows a threshold for
light absorption (optical bandgap, E
g
opt
spanning over
2.0 to 2.8 eV [9,10], well larger than that of bulk Si (1.1
eV) [11]. Since the actual PV module production i s lar-
gely dominated by Si (mono, poly-cryst all ine, or amor-
phous), the enhancement of energy conversion efficiency
through Si-based or Si-compatible nanostructur es could
lead to a breakthrough in the PV market.
Recently, t he variation of the Si QD optical bandgap
was experimentally shown to rely not only on the size
tuni ng but also on the deposition technique (comparing
sputtering and chemical vapor deposition methods) and
on the amorphous-crystalline (a-c)phaseofthe
nanoclusters [10]. Moreover, theoretical calculations
confirmed that the amorphization of Si nanoclusters
reduces the fundamental ga p and increases the absorp-
tion strength [12,13]. Some trial PV devices have been
fabricated with Si QDs (size of 3 to 8 nm) embedded in
SiO
2
, exhibiting a conversion efficiency up to 10% [14].
In similar devices, a poor carrier transport has been evi-
denced as a limiting factor for cell performance and a
maximum open circuit voltage of 410 mV was mea-
sured, well below that of single-junction mono-crystal-
line Si solar cell [15]. Thus, at present, PV cells based
on Si QDs do not show encouraging characteristics. On
the other hand, passing from bulk to confined Si, E
g
opt
hops from 1.1 to about 2.0 eV, openi ng a not-negligibl e
break in the solar energy harvesting by Si. Thus, new
* Correspondence:
1
MATIS-IMM-CNR and Dipartimento di Fisica e Astronomia, Università di
Catania, Via Santa Sofia 64, 95123 Catania, Italy
Full list of author information is available at the end of the article
Cosentino et al. Nanoscale Research Letters 2011, 6:135
/>© 2011 Salvatore et al; licensee Springer. This is an Open Access article distributed under the terms of the Creative Commons
Attribution License (http://creati vecommons.org/lice nses/by/2.0), which permits unrestricted use, distri bution, and reproduction in
any medium, provided the original work is properly cited.
nanostructured materials, Si compatible, are required to
fill this gap.
Recently, Ge QDs are attracting a larger attention for
their potential applications in PV because of the lower
fabrication temperature and of the larger excitonic Bohr
radius (approximately 20 nm) with respect to Si
(approximately 5 nm) [11,16], this allowing in principle
an easier modulation of the electronic properties by the
QCE. Moreover, since the electronic bandgap of bulk
Ge (0.66 eV) is well lower than that of bulk Si (1.1 eV)
[11], the QCE in Ge QDs could allow the modulation of
E
g
opt
within the energy range (1.1 to 2.0 eV) where bulk
or conf ined Si fails. Up to now, Ge QDs embedded in
SiO
2
have been widely studied for optoelectronic appli-
cations [16-20], with a nearly size-independent photolu-
minescence which was not attributed to simple
confinement effect but probably to the QD/matrix inter-
face [16,19]. Only a few studies ha ve been performed on
nanoscaled Ge clusters for PV application, mainly
focused on their fabrication within SiO
2
matrix [21,22],
or on the combination with titania nanoparticles [23]. In
addition, the sunlight absorption in these nanostructures
has been poorly characterized, and a univocal conse nsus
on the underlying mechanism has not been reached.
The absorption spectrum (a)ofGeQDshasbeen
experimentally measured, and it was shown that the two
main peaks visible in a of bulk Ge (i.e., the E
1
and E
2
direct transitions at 2.1 and 4.3 eV, related to the band
structure of bulk Ge [24]) disappear by shrinking the
QD si ze below 3 nm, suggesting that the band stru cture
of bulk can be altered by the confinement [25]. Later
on, Tognini and co-workers evidenced a relevant blue-
shift of E
2
(due to the QCE) and a weakening of E
1
with
size reduction of Ge QDs embedded in Al
2
O
3
[26],
while Heath et al. concluded that E
1
and E
2
transitions
areapparentlyunaffectedbyconfinementinGeQDs
produced with ul trasonic methods [27]. For PV applica-
tion, t he E
g
opt
of embedded Ge QDs is a crucial para-
meter, but experimental measurements are still lacking.
Several theoretical studies predict that it increases up to
5 eV by reducing the QD size below 1 nm, while it is
fairly cons tant at a value of 1.5 eV for size larger than 6
nm [28,29].
In order to verify these calculation results and to test
the application of Ge QDs for PV, some open questions
are whether the size of such nanostructures is the only
parameter determining t he sunlight abs orption and to
which extent, and whether there is some effect related
to the structural phase (a or c) of Ge QD or to the QD-
matrix interfaces. In this paper, we report an experimen-
tal investigation on the photon absorption in Ge QDs (2
to 10 nm in size) embedded in silica, providing the ther-
mal e volution of the absorption spectra in connection
with the a-c transition and the QD ripening. An optical
bandgap of 1.6 eV has been found with clear evidence
that light absorption is mediated by electronic states
localized at the interface betw een Ge QDs and the host-
ing matrix.
Experimental
Ge QDs embedded in silica have been obtained by mag-
netronco-sputtering of SiO
2
and Ge targets (Ar atmo-
sphere,nominal deposition temperatur e 400°C), upon
fused silicasubstrates. Thermal annealing in the 600°C to
800°C range(1 h, N
2
ambient) promoted the phase
separation of SiGeOfilm into SiO
2
,GeO
2
,andGeclus-
ters (due toprecipitation of the exceding Ge). The thick-
ness of the SiGeO film (approximately 280 nm) was
measured by transmission electron microscopy (TEM),
and the elemental composition was determined by
Rutherford backscattering spectrometry (RBS, 2.0 MeV
He
+
beam). The spectra, simulated with SIMNRA soft-
ware [30], revealed that in the as-deposited sample, the
Si, Ge, and O contents are 24, 16, and 60 at.%, respec-
tively, homogeneous in depth. Because of the annealing,
the overall Ge amount contained in the SiGeO film
slightly decreases from 3.0 × 10
17
cm
-2
(in the as-depos-
ited sample) to 2.6 × 10
17
cm
-2
(800°C-annealed sample)
due to the Ge out-diffusion through the surface, as
already evidenced in the literature [20]. Normal trans-
mittance (T) and the 20° reflectance (R) spectra in the
200- to 2000-nm wavelength range were measured, by
using a Varian Cary 500 double beam scanning UV/
Visible/NIR spectrophotometer (Agilent Technologies,
Inc., Santa Clara, CA, USA) for extracting the absorp-
tion coefficient of the films, as described in Ref. [10].
Cross-section transmission electron microscopy in high
resolution (HR-TEM) or scanning mode (STEM) was
used to verify the formation of Ge clusters, to measure
their size distribution, and to evidence the crystalline
phase. The observations were carried out using a JEOL
2010F microscope (JEOL Ltd., Tokyo,Japan) operating at
200 kV equipped with a Schottky field-emission gun, a
Gatan imaging filter (GIF) for compositional mappings,
and a JEOL STEM unit, with an annular dark-field
detector operated in high angle (HAADF) mode for Z
contrast imaging. In addition, c-Ge clusters have been
characterized also with glancing-incidence X- ray diffrac-
tion (GI-XRD) analysis, using the K
a
radiation of Cu
( l = 0.154 nm), fixing the incidence angle at 0.5° and
performing the 2θ scan. Basing on the (111), (110), and
(220) Bragg diffraction peaks of t he GI-XRD spectra
(not shown), the average QD size was estimated by
applying the Scherrer formula [31].
Results and discussion
A high density of Ge precipitates within the SiO
2
matrix is
revealed by the STEM images (at the same magnification)
Cosentino et al. Nanoscale Research Letters 2011, 6:135
/>Page 2 of 7
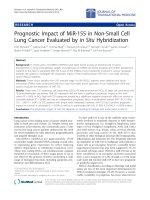
in Figure 1, just after the deposition (a) and after thermal
annealing at 750°C (b). The bright patches represent Ge
nanoclusters whose density and mean size noticeably
change after annealing (the mean diameter increasing
from 2.5 to 7.5 nm). Although Ge QDs are already present
in the as-deposited films, as recently found also by Zhang
et al. [22], the deposition temperature was not high
enough to induce the formation of crystalline QDs in our
case. SiGeO film deposited by sputtering can be described
as a mixture of Ge, GeO
2
, and SiO
2
units, according to a
random matrix model, similarly to what occurs for silicon-
rich oxide [32]. During annealing, Ge QDs undergo an
Ostwald ripening mechanism, similar to the Si QD case
[33], leading to a size increasing of precipitates with a con-
comitant a-c transition occurring in the 600°C to 8 00°C
range [20]. The inset in Figure 1b reports an HR-TEM
image of the annealed sample, evidencing a clear crystal-
line phase for Ge QD with the fringes due to crystalline
planes (indicated by red lines and separated by 0.33 nm, as
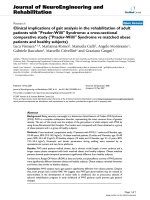
the (111) planes of c-Ge bulk). In Figure 2, the mean QD
diameter (2r) measured b y T EM (diamond) and by GI-
XRD (crossed squares, line is a guide for eyes) is reported
as a function of the annealing temperature. Even if GI-
XRD gives information only on c-QDs, the reasonable
agreement between the two techniques observed at 750°C
is supporting the idea that the size distribution of c-QDs
does n ot significantly d eviate from that of a-QDs. The
overall variation of r can be extracted by joining the two
techniques, showing a clear QD enlargement in the 400°C
to 800°C range compatible with an Ostwald r ipening
mechanism.
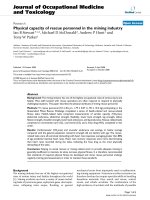
In Figure 3, the transmittance (T) spectra of some
SiGeO samples are plotted (sym bols) together with that
of the quartz substrate (T ~ 90%, the missing 10% being
due to reflection by the quartz surface, not reported
here).ThepresenceofGeQDsinduces,inthe200to
Figure 1 Cross sectional dark-field STEM images (same
magnification) of the sample. As deposited (a) or after annealing
at 750°C (b). The inset reports a HR-TEM of the annealed sample,
showing the presence of a clear crystalline structure.
Figure 2 Thermal evolution of the mean diameter (2r)ofGe
nanostructures. Measured by TEM (diamond) or GI-XRD (squares).
Line is a guide for eyes (color online).
Figure 3 Transmittance and reflectance spectra. Transmittance
spectra for the bare substrate (quartz, continuous line) and for the
as-deposited and annealed SiGeO samples (symbols). The
reflectance spectrum (R) for the SiGeO sample after annealing at
800°C is also reported (dotted line) (color online).
Cosentino et al. Nanoscale Research Letters 2011, 6:135
/>Page 3 of 7
1000 nm range, a strong decrea se of T which is modu-
lated with the annealing temperature. On the other
hand, the reflectance (R) spectrum d oes n ot depend on
the temperature (thus, only the 800°C-annealed sample
was reported) and R is quite low (approximately 10%)
and constant, except for the typical oscillations caused
by the beam interference at the air-SiGeO and SiGeO-
quartz interfaces. The decrease of T for wavelengths
smaller than approximately 1000 nm shows the absorp-
tion of light related to thepresenceofGeQDs
embedded in the film. On t he other hand, the blueshift
of T for higher annealing temperatures cannot be
straightforwardly related to the Ostwald ripening of Ge
QDs, sin ce a redshift should be expected ba sing on the
QCE (the larger QD, the lower the optical bandgap).
Thus, the optical transmittance of this SiGeO film is
clearly affected by the thermal treatments, but to find a
relationship with the structural changes, the absorption
spectra should be calculated.
To study the light absorptio n of these Ge nanostruc-
tures, transmittance and reflectance spectra have been
used to extract the absorption coefficient (a) as follows:
1
1
d
TR
T
ln
QS
S
where d, T
S
,andR
S
are , respectively, thickness, trans-
mittance and reflectance of the sample, while T
Q
is the
transmittance of the quartz substrate. The overall inde-
termination on a, also including errors in d, T,andR,
has been estimated t o be about 5% , while the dynamic
range for a in our measurements was approximately 1 ×
10
3
to 2 × 10
5
cm
-1
.
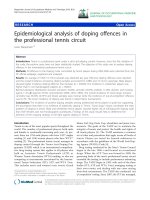
Selected a spectra are reported in Figure 4a for the as-
deposited sample (squares) or after annealing at 600°C
(circles) and 800°C (open triangles). The absorption spec-
trum of crystalline Ge (c-Ge, continuous line) is also
reported for c omparison [34]. The difference of about
one order of magnitude between bulk Ge and our sample
is not surprising since the main part of the SiGeO film is
a transparent matrix (S iO
2
and GeO
2
), while the Ge
involved in QD formation is a bout 10 at.%. Thus, the
reported a spectra can be a ssociated to the photon
absorption by Ge QDs. Annealing at 600°C does not sig-
nificantly modify the absorption of Ge QDs, while the
change of a at 800°C is inferred to the presence of crys-
talline QDs (evidenced by TEM already at 750°C). In fact,
at 800°C, two broad peaks (dashed vertical lines) at about
2.6 and 5 eV appear in the spectrum, recalling the E
1
and
E
2
direct transitions (at 2.1 and 4.3 eV) of the bulk c-Ge
spectrum, but at a slightl y larger energy. Such broad
peaks i n the 800°C-annealed sample can be related to
direct transitions within the c-Ge QDs having an energy
band structure modified by the confinement.
To investigate the role of the QD structural phase, we
induced the c- a transition of the Ge QDs in the sample
annealed at 800°C by means of an ion implantation pro-
cess followed by 550°C, 1-h annealing. The ion implan-
tation parameters (1.3 × 10
14
Ge/cm
2
, 600 keV, max Ge
concentration lower than 0.01 at.%) were chosen to
induce the c-a transition in a 500-nm-thick c-Ge film,
which is enough to ensure the full amorphization of our
Ge QDs [35]. Post-implant thermal trea tment is needed
to anneal the matrix damage without inducing re-crys-
tallization of Ge QDs. The absorption s pectrum (closed
triangles) of the amorphized Ge QDs is reported in
Figure 4a. The c-a transition of Ge QDs does not
Figure 4 Absorption spectra, Tauc plots, and relative linear fits.
(a) Absorption spectra of SiGeO samples annealed at various
temperatures (1 h, N
2
ambient), together with the spectrum of
crystalline Ge [34]. Ion implantation (1.3 × 10
14
Ge/cm
2
, 600 keV,
max Ge density lower than 0.01 at.%) was performed to induce the
amorphization of Ge QDs. (b) Tauc plots (symbols) and relative
linear fits (according to the reported law, lines) for the same
samples and for a thin (120 nm) amorphous Ge film (color online).
Cosentino et al. Nanoscale Research Letters 2011, 6:135
/>Page 4 of 7
modify the onset of light absorption neither the spec-
trum itself, except that for the disappearance of the
direct resonance peaks as expec ted because of the lo st
crystalline order wit hin the Ge QDs. It should be
remarked that the c-a transition in Si QDs embedded in
SiO
2
actually modifies the absorption by lowering the
optical bandgap of about 0.4 eV [10]. This effect h as
been predicted to occur in both Si and Ge QDs by theo-
retical calculations of the electronic bandgap [12,13].
Thus, the data presented in this work evidence a diver-
gence in the behavior of Ge QDs with respect to Si
ones. Moreover, in Ge QDs, the a spectra at 800°C
(both c-ora-Ge QDs) are halved with respect to as-
deposited sample, while the Ge content reduction due
to Ge out-diffusion was measured to be less than 20%.
Thus, annealing at high temperatures clearly induces a
not-negligible fall in the light absorption efficiency o f
Ge QDs, while QD structural phase does not affect the
onset of light absorption.
To account for these effects, the Tauc law, describing
a in amorphous semiconductors, has been used [36]:
B
E
hv
hv
g
opt
2
,
where hν, B,andE
opt
g
are the incoming photon
energy, the Tauc constant, and the optical bandgap,
respectively. The photon absorption leads to transitions
between the extended electronic states from the valence
band toward the conduction band, being E
opt
g
the
energy difference and B proportional to the convolution
of the density of electronic states (DOS) in the two
energy bands. The Tauc plots, (ahν)
1/12
versus hν,of
selected samples are reported with symbols in Figure 4b,
while lines are the linear fit used to determine B and
E
opt
g
. For reference, a thin (120 nm) amorphous Ge film
was deposited on quartz, and its Tauc plot (stars) is also
reported with its fit. Tauc p lots have a linear slope over
awiderangeofenergy,andtheverygoodagreement
between fits and experimental data justifies the Tauc
approach.
The optical bandg ap of a-Ge r esults 0.8 eV, in good
agreement with the literature [37], while the samples
containing Ge QDs always exhibit an E
opt
g
of approxi-
mately 1.6 eV (well larger than not-confined Ge), inde-
pendently of the annealing temperature and of the
structural phase (a or c). A similar E
opt
g
has been
reported in the literature only for one sample containing
Ge QDs in a TiO
2
matrix [23], without variation of
annealing temperature or structural phase. In order to
account for the E
opt
g
of QDs, quantum confinement
effect can be invoked since the size is well below the
excitonic Bohr radius. In Figure 2, the QD size enlarge-
ment was reported, but it is not accomplished by a
reduction of the E
opt
g
, a s expected if only the confine-
ment rule applies. Such a contrast indicates that the
confinement rule alone cannot account for the mechan-
ism of photon absorption in Ge QDs, or it is masked by
a stronger phenomenon.
The reduction of a with temper atur e (Figure 4a) can
be instead a scribed to a significant decreasing o f the
Tauc constant (B) as evident from the falling slopes of
fits in Figure 4b. In fact, the B values, normalized to
the as-deposited case, are reported as open triangles in
Figure 5, revealing that after 800°C annealing, the DOS
in Ge QDs involved in the light absorption (proportional
to B) is strongly reduced to about one third, indepen-
dently of the Ge QDs phase (c or a,openorclosedtri-
angles, respectively). If the DOS was related only to the
density of G e-Ge bonds, the B trend would decrease
as much as the Ge content in the film (D,circlesin
Figure 5, as measured by RBS and normalized to the as-
deposited case), but this is not the case. Instead, the
photon absorption co uld be related to Ge bonds near
the QD surfaces. If so, given a fixed amount of clustered
Ge, the B value would be larger the smaller is r.Since
the surface to volume ratio is proportional to 1/r and
thevolumeisproportionaltoD,thetotalareaofthe
surfaces of Ge QDs should decrease as D/ r,reportedin
Figure 5 as squares. The patent correlation between B
and D/r trends clearly suggests that the light absorption
in Ge QDs embedded in SiO
2
is strongly influenced by
the surface of Ge QDs. In addition, such an evidence
Figure 5 Tauc consta nt, Ge content, and the surfaces of Ge
QDs. Comparison between the Tauc constant (B, triangles) as
obtained from Tauc fits, the Ge content (D, circles) as measured by
RBS, and the surfaces of Ge QDs (D/r, squares). All the values have
been normalized to that of the as-deposited sample (color online).
Cosentino et al. Nanoscale Research Letters 2011, 6:135
/>Page 5 of 7
can account also for independence of E
opt
g
on the QDs
size or phase, since the photon absorption seems to be
mediated by surface electronic states, not related to the
volume of QDs.
These surface electronic states can be related to the
presence of Ge dangling bonds or Ge-O or Ge-Si bonds
located near the QD surface, or to the surface itself
which induces an atomic rearrangement with different
bond angle and bond length than in the bulk. To test
the presence of dangling bonds, we annealed some sam-
ples (as deposited, or annealed at 700°C or 800°C)
in forming gas ambient (Ar/H = 95:5 mixture, 1 h at
450°C) which is known to saturate dangling bonds in
disordered structures. The optical T and R of these sam-
ples w ere unaffected by the forming gas treatment, so
we can state that the observed behavior in the light
absorption is not influenced by dangling bonds. On the
other hand, a strong Fermi-level pinning near the top of
valence band in bulk Ge has been recently evidenced,
preventing the formation of a reliable n-channel MOS-
FETs device [38-40]. Such an effect was shown to be
caused by native defects at the Ge surface, which modify
the density of acceptor-lik e and donor-like states nearby
the surface with respect to those in the bulk, and thus
largely vary the electronic properties through a signifi-
cant upwards band bending close to the surface. Actu-
ally, surface states in se miconductors typically induce a
shift of the charge neutrality level (CNL) towards one of
the energy bands. In Si, or in GaP or in GaAs, the CNL
at the surface is located above the valence band by
about one third of the respective energy bandgap [41],
whileinGeitwasrecentlyshowntobeabovethe
valence band by only one eighth of the bandgap [38-40].
In additio n, Schottky barrier heights in met al/Ge con-
tacts are shown to be weakly dependent on the metal
work functions [38-40], denouncing a very large density
of interface states [39]. Thus, Ge surface largely d omi-
nates the electronic properties nearby the surface, much
more than in other semiconductors, through a strong
pinning of t he Fermi level and a significant band bend-
ing. Since such a band bending is expected to extend
largely for undoped Ge, quantum dots as large as 10 nm
can show an overwhelmin g surface effect on the energy
band structure. In this scenario, the expected quantum
confinement effect could be masked by the influence of
surface states and then the theoretical calculation should
reconsider these states for the optical bandgap
determination.
Conclusions
In conclusion, we have produced and characterized Ge
QDs (2 to 10 nm in size) embedded in silica by thermal
annealing of a SiGeO film produced by magnetron sput-
tering. The light absorption spectra of the investigated
Ge QDs have been measured, demonstrating that the
optical bandgap of these nanostructures, both in the
amorphous or crystalline phase, is pinned at about 1.6
eV, r egardless of the QD size and then of the confine-
ment extent. Moreover, we showed that for a given
amount of clustered Ge, the probability of photon
absorption is larger the smaller is the QD size. By mod-
eling the photon absorption mechanism, we evidenced
that it is related to the surfaces of Ge QDs rather than
to their volume , through the mediation of the electronic
states localized at the interface between Ge QDs and
the hosting matrix. This behavior has been discussed in
comparison with the Fermi-level pinning observed in
metal/Ge contacts. The reported surface effect on the
light absorption in Ge QDs should be kept into account
for both the electronic gap calculations and for any
applicat ion in photo voltaic devices. As far a s the optical
bandgap is concerned, Ge QDs, in conjunction with
confined and bulk Si, give the chance to efficiently mod-
ulate the onset of light absorption from 1.1 eV (bulk Si)
up to more than 2 eV (Si QDs).
Acknowledgements
The authors wish to thank I. Crupi and S. Gibilisco (MATIS-IMM-CNR) for the
fruitful discussions, and C. Percolla and S. Tatì (MATIS-IMM-CNR) for the
technical assistance.
Author details
1
MATIS-IMM-CNR and Dipartimento di Fisica e Astronomia, Università di
Catania, Via Santa Sofia 64, 95123 Catania, Italy
2
IMM-CNR, VIII Strada 5,
95121 Catania, Italy
Authors’ contributions
SC contributed to samples processing, characterization (UV/Visible/NIR and
GI-XRD), data analysis and interpretation, and drafted the manuscript. SM
conceived the study, contributed to sample characterization (RBS, GI-XRD),
data analysis and interpretation, and revisited the manuscript. MM and RLS
realized the SiGeO films. GN and CS provided TEM analysis. FS contributed
to optical analysis. AT conceived the study, contributed to data
interpretation, coordinated the work.
All authors read and approved the final manuscript.
Competing interests
The authors declare that they have no competing interests.
Received: 28 September 2010 Accepted: 11 February 2011
Published: 11 February 2011
References
1. Nozik AJ: Nanoscience and Nanostructures for Photovoltaics and Solar
Fuels. Nano Lett 2010, 10:2735-2741.
2. Green MA: Third Generation photovoltaics: solar cells for 2020 and
beyond. Physica E 2002, 14:65.
3. Nozik AJ: Quantum dot solar cells. Physica E 2002, 14:115.
4. Conibeer G: Third-generation photovoltaics. Materials Today 2007, 10:11.
5. Slaoui A, Collins RT: Advanced inorganic materials for photovoltaics. MRS
Bulletin 2007, 32:211.
6. Nozik J: Multiple exciton generation in semiconductor quantum dots.
Chem Phys Lett 2008, 457:3-11.
7. Martì A, Antolìn E, Stanley CR, Farmer CD, Lòpez N, Dìaz P, Cànovas E,
Linares PG, Luque A: Production of photocurrent due to intermediate-to-
conduction-band transition: a demonstration of a key operating
Cosentino et al. Nanoscale Research Letters 2011, 6:135
/>Page 6 of 7
principle of the intermediate band solar cell. Phys Rev Lett 2006,
97:247701.
8. Conibeer G, Green M, Corkish R, Cho Y, Cho EC, Jiang CW,
Fangsuwannarak T, Pink E, Huang Y, Puzzer T, Trupke T, Richards B,
Shalav A, Lin KL: Silicon nanostructures for third generation photovoltaic
solar cells. Thin Solid Films 2006, 511-512:654-662.
9. Hao XJ, Podhorodecki AP, Shen YS, Zatryb G, Misiewicz J, Green MA: Effect
of Si-rich oxide layer stoichiometry on the structural and optical
properties of Si QD/SiO
2
multilayer films. Nanotechnology 2009, 20:485703,
2009.
10. Mirabella S, Agosta R, Franzò G, Crupi I, Miritello M, Lo Savio R, Di
Stefano MA, Di Marco S, Simone F, Terrasi A: Light absorption in silicon
quantum dots embedded in silica. J Appl Phys 2009, 106:103505.
11. Cullis AG, Canham LT, Calcott PDJ: The structural and luminescence
properties of porous silicon. J Appl Phys 1997, 82:909.
12. Guerra R, Marri I, Magri R, Martin-Samos L, Pulci O, Degoli E, Ossicini S:
Silicon nanocrystallites in a SiO
2
matrix: Role of disorder and size. Phys
Rev B 2009, 79:155320.
13. Ossicini S, Amato M, Guerra R, Palummo M, Pulci O: Silicon and
Germanium Nanostructures for photovoltaic Applications: Ab initio
Results. Nanoscale Res Lett 2010, 5:1637-1649.
14. Park S, Cho E, Song D, Conibeer G, Green MA: n-Type silicon quantum
dots and p-type crystalline silicon heteroface solar cells. Sol Energy Mater
Sol Cells 2009, 93:684-690.
15. Di D, Perez-Wurfl I, Gentle A, Kim DH, Hao X, Shi L, Conibeer G, Green MA:
Impacts of Post-metallisation Processes on the Electrical and
Photovoltaic Properties of Si Quantum Dot Solar Cells. Nanoscale Res Lett
2010, 5:1762-1767.
16. Takeoka S, Fujii M, Hayashi S, Yamamoto K: Size-dependent near-infrared
photoluminescence from Ge nanocrystals embedded in SiO
2
matrices.
Phys Rev B 1998, 58:7921.
17. Fujii M, Hayashi S, Yamamoto K: Growth of Ge microcrystals in SiO
2
Thin
Films Matrices: A Raman and Electron Microscopic Study. Jpn J Appl Phys
1991, 30:687.
18. Maeda Y, Tsukamoto N, Yazawa Y, Kanemitsu Y, Masumoto Y: Visible
photoluminescence of Ge microcrystals embedded in SiO
2
glassy
matrices. Appl Phys Lett 1991, 59:3168.
19. Zacharias M, Fauchet PM: Blue luminescence in films containing Ge and
GeO
2
nanocrystals: The role of defects. Appl Phys Lett 1997, 71:380.
20. Skov Jensen J, Leervad Ledersen TP, Pereira R, Chevallier J, Lundsgaard
Hansen J, Bech Nielsen B, Nylandsted Larsen A: Ge nanocrystals in
magnetron sputtered SiO
2
. Appl Phys A 2006, 83:41.
21. Gao F, Green MA, Conibeer G, Cho EC, Huang YD, Perez-Wurfl I, Flynn C:
Fabrication of multilayered Ge nanocrystals by magnetron sputtering
and annealing. Nanotechnology 2008, 19:455611.
22. Zhang B, Shrestha S, Green MA, Conibeer G: Size controlled synthesis of
Ge nanocrystals in SiO
2
at temperatures below 400 °C using magnetron
sputtering. Appl Phys Lett 2010, 96:261901.
23. Chatterjee S: The optoelectronic properties of titania-germanium
nanocomposites. J Phys D: Appl Phys 2008, 41:055301.
24. Cohen ML, Bergstresser TK: Band Structures and Pseudopotential Form
Factors for Fourteen Semiconductors of the Diamond and Zinc-blende
Structures. Phys Rev 1966, 141:789.
25. Hayashi S, Fuji M, Yamamoto K: Quantum Size Effects in Ge Microcrystals
Embedded in SiO
2
Thin Films. Jpn J Appl Phys 1989, 28:L1464.
26. Tognini P, Andreani LC, Geddo M, Stella A, Cheyssac P, Kofman R,
Migliori A: Different quantum behavior of the E
1
and E
2
spectral
structures in Ge nanocrystals. Phys Rev B 1996, 53:6992.
27. Heath J, Shiang JJ, Alivisatos AP: Germanium quantum dots: Optical
properties and synthesis. J Chem Phys 1994, 101:1607.
28. Nesher G, Kronik L, Chelikowsky JR: Ab initio absorption spectra of Ge
nanocrystals. Phys Rev B 2005, 71:035344.
29. Reboredo FA, Zunger A: L-to-X crossover in the conduction-band
minimum of Ge quantum dots. Phys Rev B 2000, 62:R2275.
30. Mayer M: SIMNRA user’s guide, report IPP 9/113 Garching: Max-Planck-Institut
für Plasmaphysik; 1997.
31. Langgord JI, Wilson AJC: Scherrer after sixty years: a survey and some
new results in the determination of crystallite size. J Appl Crystallogr 1978,
11:102-113.
32. Franzò G, Miritello M, Boninelli S, Lo Savio R, Grimaldi MG, Priolo F,
Iacona F, Nicotra G, Spinella C, Coffa S: Microstructural evolution of SiO
x
films and ist effect on the luminescence of Si nanoclusters. J Appl Phys
2008, 104:094306.
33. Nesbit LA: Annealing characteristics of Si-rich SiO
2
films. Appl Phys Lett
1985, 46:38.
34. Philipp HP, Taft EA: Optical constants of germanium in the region 1 to10
eV. Phys Rev 1959, 113(4):1002-1005.
35. Djurabekova F, Backman M, Pakarinen OH, Nordlund K, Araujo LL,
Ridgway MC: Amorphization of Ge nanocrystals embedded in
amorphous silica under ion irradiation. Nucl Instr and Meth B 2009,
267:1235.
36. Knief S, von Niessen W: Disorder, defects, and optical absorption in a-Si
and a-Si:H. Phys Rev B 1999, 59:12940.
37. Tanaka K: Amorphous Ge under pressure. Phys Rev B 1991, 43:4302.
38. Dimoulas A, Tsipas P, Sotiropoulos A, Evangelou EK: Fermi-level pinning
and charge neutrality level in germanium. Appl Phys Lett 2006, 89:252110.
39. Nishimura T, Kita K, Toriumi A: Evidence for strong Fermi-level pinning
due to metal-induced gap states at metal/germanium interface. Appl
Phys Lett 2007, 91:231231.
40. Zhou Y, Han W, Wang Y, Xiu F, Zou J, Kawakami RK, Wang KL:
Investigating the origin of Fermi level pinning in Ge Schottky junctions
using epitaxially grown ultrathin MgO films. Appl Phys Lett 2010,
96:102103.
41. Cowley AM, Sze SM: Surface States and Barrier Height of Metal-
Semiconductor Systems. J Appl Phys 1965, 36:3212.
doi:10.1186/1556-276X-6-135
Cite this article as: Cosentino et al.: The role of the surfaces in the
photon absorption in Ge nanoclusters embedded in silica. Nanoscale
Research Letters 2011 6:135.
Submit your manuscript to a
journal and benefi t from:
7 Convenient online submission
7 Rigorous peer review
7 Immediate publication on acceptance
7 Open access: articles freely available online
7 High visibility within the fi eld
7 Retaining the copyright to your article
Submit your next manuscript at 7 springeropen.com
Cosentino et al. Nanoscale Research Letters 2011, 6:135
/>Page 7 of 7