Solar Collectors and Panels, Theory and Applicationsband (CTB) Part 7 doc
Bạn đang xem bản rút gọn của tài liệu. Xem và tải ngay bản đầy đủ của tài liệu tại đây (6.28 MB, 30 trang )
Solar Collectors and Panels, Theory and Applications
172
(a) (b)
(c) (d)
Fig. 2. a) The hyperbolic surface with the null screen, b) Flat printed null screen with grid lines
for qualitative testing, c) resultant image of the screen shown in (b) reflection on the test
surface and d) resultant image by a null screen with drop shaped spots for quantitative testing.
For a quantitative testing of the surface, a null screen with drop-shaped spots is used (Fig.
2d) to simplify the measurement of the positions of the spots on the CCD plane, which are
estimated by the centroids of the spots on the image of the null screen.
2.1.2 Spherical convex surface
The spherical convex surface used was a steel ball with a diameter of 40 mm; the proposed
cylindrical null screen was 60 mm in diameter. For a qualitative evaluation of the shape of
the surface, we designed a screen to produce a square array of 19x19 lines on the image
plane. Figure 3a shows the spherical surface, in Fig. 3b the flat printed null screen is shown,
and the image of the cylindrical screen after reflection on the spherical surface is shown in
Shape Measurement of Solar Collectors by Null Screens
173
Fig. 3c; the image is almost a perfect square grid but, in this case, the departures from a
square grid which can be seen are probably due to a defocus of the surface and some
printing errors, and not to deformations of the surface.
(a)
(b) (c)
Fig. 3. a) Spherical surface (steel ball), b) flat printed null screen with grid lines for
qualitative testing, and c) the resultant image of the screen after reflection on the test
surface.
2.2 Surface shape evaluation
The shape of the test surface can be obtained from measurements of the positions of the
centroids of the spot images on the CCD plane through the formula (Díaz-Uribe, 2000)
0
-
o
p
y
x
zz
p
n
n
z z dx dy
nn
⎛⎞
=+
⎜⎟
⎝⎠
∫
, (3)
where n
x
, n
y
, and n
z
are the Cartesian components of the normal vector N on the test surface,
and z
0
is the sagitta for one point of the surface. The value of z
0
is not obtained from the test,
but it is only a constant value that can be ignored.
The evaluation of the normals to the surface consists of finding the directions of the rays that
join the actual positions P
1
of the centroids of the spots on the CCD and the corresponding
Cartesian coordinates of the objects of the null screen P
3
. According to the reflection law, the
normal N to the surface can be evaluated as
Solar Collectors and Panels, Theory and Applications
174
rr
rr
ri
ri
−
=
−
N , (4)
Where
r
i
and r
r
are the directions of the incident and the reflected rays on the surface,
respectively; the reflected ray passes through the pinhole P and arrives at the CCD image
plane at P
1
(Fig. 4). For the incident ray r
i
we only know the point P
3
at the null screen, so we
have to approximate a second point to obtain the direction of the incident ray by intersecting
the reflected ray with a reference surface; the reference surface can be the ideal design
surface or a similar surface close to the real one.
Fig. 4. Approximated normals.
The next step is the numerical evaluation of Eq. (3). The simplest method used for the
evaluation of the numerical integration is the trapezoid rule (Malacara-Doblado & Ghozeil,
2007). An important problem in the test with a null screen is that the integration method
accumulates important numerical errors along the different selected integration paths. It is
well known (Moreno-Oliva et al., 2008a) that a bound to the so called truncation error can be
written as
Mab
h
ε )(
12
2
−≤ , (5)
here h is the maximum separation of two points along the integration path, (b-a) is the total
length of the path and M is the maximum value of the second derivative of the integrand
along the path. Díaz-Uribe et al. (2009) have shown that for spheres this error is negligible;
for other surfaces it can be very significant.
To reduce the numerical error, some authors have proposed the use of parabolic arcs instead
of trapeziums (Campos-García et al., 2004), or the fit of a third degree polynomial that
describes the shape of the test surface locally(Campos-García & Díaz-Uribe, 2008).
There are other integration methods going from local low order polynomial approximations
(Salas-Peimbert et al., 2005) to global high order polynomial fitting to the test surface
(Mahajan, 2007) in the latter case, the Least Squares method is commonly used but some
Shape Measurement of Solar Collectors by Null Screens
175
other fitting procedures, such as Genetic Algorithms (Cordero-Dávila, 2010) or Neural
Networks, have been also used.
By far the simplest integration method is the trapezoid rule method; however, since the
error increases as the second power of the spacing between the spots of the integration path,
to minimize the error, it is desirable to reduce the spacing between spots (see eq. (5)). This
implies more spots in the design of the null screen; there is, however, a physical limit on the
number of spots; if the spot density is too large,the spot images can overlap because of
defocus, aberrations or because of diffraction. A method to increase the number of points,
thus reducing the average separation between them, is to use the so called point shifting
method (Moreno-Oliva et al., 2008a; Moreno-Oliva et al., 2008b). The basic idea is to acquire
a total of m pictures, each with different null screen arrangement and containing n spots on
the image; the spots will be shifted from their positions in other pictures, making a total of
m
×
n evaluation points, with an average separation of
m
h
h
m
= . (6)
Then, the bound to the truncation error is reduced as the original bound for only one image
(n points), divided by m
m
ε
Mab
m
h
ε
m
≤−≤ )(
12
2
. (7)
In order to implement this method in the lab, small known movements are applied to the
cylindical screen along the axis of the surface under test. With this method it was possible to
reduce the accumulated numerical error by up to 80%, with respect to the error for a single
screen without scrolling. In Fig. 5a the image for the initial position of the screen is show;
and
figure 5b is the image for the final position of the screen. A total of ten images were
captured. Each image was independently captured and processed to obtain the centroids of
the spots, Fig. 5c shows the plot of the spot centroids for all the captured images.
Another method to implement the same idea is to design a screen such that its image in the
optical system is an array of dots or spots in a spiral arrangement (Moreno-Oliva et al., 2008b).
In this case the movement of the screen or surface is made by rotation around the axis of the
surface to obtain, a high density of points depending on how the screen or the surface is
rotated. Figure 6(a) shows the image of a screen with spots ordered in a spiral arrangement.
The plot of the positions of the centroids for the spots from twelve images captured on each
rotation step of the test surface is shown in Fig. 6(b). The screen is designed to increase the
density of points with respect to the original radial distribution of the image at the initial
position. In Fig. 6(b) a set of equally spaced spots along the radial direction is observed.
One of the main disadvantages of the previous methods, where a movement is applied to
the cylindrical screen, is the introduction of errors due to mechanical translation or rotation
devices. In a more recent work, the use of LCD flat panels was proposed, for the test of
convex surfaces (Moreno-Oliva et al., 2008c); the screens are arranged in a square array and
the surface under test is placed in the center. The screens display the required geometry in a
sequence so that each distribution of points produces an array of equally spaced spots in the
image plane, and the sequence causes these points to move. By taking a picture for each step
and merging the centroids of the spot images is possible have a greater density of
equidistant spots for better evaluation.
Solar Collectors and Panels, Theory and Applications
176
(a) (b)
100 150 200 250 300 350 400 450 500 550
0
50
100
150
200
250
300
350
400
450
500
Initial plot of the spots centroids
Plot of the positions of the spots centroids
for ten images captured
Y (mm)
X (mm)
(c)
Fig. 5. a) Image of the screen at the initial position, b) Image of the screen at the final
position, c) Plot of the centroid positions of the spots for ten images captured by using the
point shifting method.
(a) (b)
Fig. 6. a) Image of the screen at the initial position, b) Plot of the position of the centroids for
the spots at each rotation step of the test surface.
Shape Measurement of Solar Collectors by Null Screens
177
Screenimage for
LCD A and LCD A’
Screen image for
LCD B and LCD B’
-40-30-20-100 10203040
-40
-30
-20
-10
0
10
20
30
40
Y (mm)
X (mm)
Centroids positions for all the images
captured of the test surface
(a) (b)
Fig. 7. (a) Image of each LCD monitor showing a sequence of flat null screens and (b) plot
for many sequences of all the LCD monitors.
The screen in this method consisted of four LCD flat panels (LCD A, A’ and LCD B, B’), the
distance between LCD A and A’ is smaller than the distance between LCD B and B’, for this
reason the image area covered by LCD A and A is greater than that covered by LCD B and B
(Fig. 7a). Each LCD displayed a sequence of dynamic flat null screens, and the number of
sequences can be increased to the density of equidistant spots. Figure 7b shows the plot of
the centroids for all the screens displayed.
3. Testing a parabolic trough solar collector (PTSC)
3.1. Testing a PTSC by area
3.1.1 Screen design
The null screen method can also be used for testing other surfaces without symmetry of
revolution such as off-axis parabolic surfaces (Avendaño-Alejo, et al., 2009). This method
has also been used in the testing of parabolic trough solar collectors (PTSC). In both cases
the use of flat null screens was proposed; the screen is designed in the same way as
the cylindrical screens described above, using inverse ray tracing starting on the array of
points in the image plane and intercepting the reflected ray on the surface with the flat
screen.
The proposal is to use two flat null screens parallel to the collector trough; physically, they
are located on each side of a wood or plastic sheet; each side is useful for testing half of the
surface of the PTSC. Figure 8 shows the schematic arrangement for the proposed evaluation
for a PTSC with flat null screens.
The design of the screen starts on a CCD point P
1
, with coordinates (x,y,a+b); the ray passes
through the point P(0,0,b) (pinhole of the camera optical system), and arrives at the test
surface at P
2
(X,Y,Z); after reflection, the ray hits the point P
3
(x
3
,y
3
,z
3
) on the null screen (see
Fig. 8).
Solar Collectors and Panels, Theory and Applications
178
X
Y
N
y
x
d
P
1
(x,y,a+b)
Z
R
I
P (0,0,b)
P
2
P
3
b
a
Fig. 8. Setup for the testing for a PTSC with null screens.
The equation for the PTSC is given by.
2
2
=
Y
Z
r
, (8)
where r is the radius of curvature at the vertex. Then, the coordinates of the point P
2
are
found by
txX = , (9)
tyY = , (10)
r
Y
batZ
2
=+=
2
, (11)
where
(
)
22 2
2
1
2tararyrb
y
=±+ . (12)
Here, a is the distance from the aperture stop to the CCD plane and b is the distance from
the aperture stop to the vertex of the surface. Then, using the Reflection Law written as
(
)
⋅
I=R-2 R-N N, (13)
where I, R, and N, are the incident, reflected and normal unit vectors associate with each
corresponding ray. As we are performing an inverse ray trace, the real incident ray is the
reflected ray of our tracing. Then, as the normal vector (not normalized) is given by
0, , 1
Y
r
⎛⎞
=
−
⎜⎟
⎝⎠
N , (14)
the normalized Cartesian components of the vector
I are given by
Shape Measurement of Solar Collectors by Null Screens
179
22 22
222 22222 22222
()2 2 ()
, ,
() ()
xy z
x y r Y arY ryY a r Y
x
ya Yr xya Yr xya
−+ − −
== =
++ + ++ + ++
I I and I (15)
Finally, the intersection with the flat null screen gives the coordinates of the point P
3
222
3
ayx
x
stxx
++
+=
, (16)
22222
22
3
)(
2)(
ayxrY
arYYry
styy
+++
+
+=
-
, (17)
22222
22
3
)(
)(2
ayxrY
YraryY
sbatz
+++
++=
, (18)
where s is a parameter determined by the condition that the point P
3
is on the flat screen.
The equation for this condition is
dy =
3
, (19)
where d is the distance between the XZ plane and the flat null screen. Substituting Eq. (19) in
Eq. (17) yields
22222
22
++)+(
2+)(
+=
ayxrY
arYYry
styd
-
, (20)
and solving for s, we get
)(
2)(
)(
22
22222
tyd
arYYry
ayxrY
s -
-
⎥
⎥
⎦
⎤
⎢
⎢
⎣
⎡
+
+++
= . (21)
To test the whole area of the PTSC with only one image, it is necessary use two flat null
screens in the positions d and -d with respect to the Y axis.
3.1.2 Quantitative surface testing
With the aim of testing a PTSC with the parameter data given in table 2, a null screen was
designed. The test surface and the screen designed for it are shown in Fig. 9; the resultant
image of the screen after reflection on the test surface is also shown.
Parameter
Symbol Size
Full aperture
Δ
Y
3.0 m
Length
L
1.2 m
Focal Length
f
1.0 m
Vertex radius of curvature
r
2.0 m
Stop aperture-CCD plane
a
12.5 mm
CCD length
d
8.1 mm
Stop aperture-surface vertex
b
5192.12 mm
Table 2. Design parameters for the test of a PTSC
Solar Collectors and Panels, Theory and Applications
180
(a) (b)
(c) (d)
Fig. 9. a) PTSC component, b) flat printed null screen with drop shaped spots for
quantitative testing (400x1600 mm), c) image of the screen after reflection on the test area
surface, and d) detail of the image.
Fig. 10. Plot of the centroid positions for some spots of the flat null screen.
Shape Measurement of Solar Collectors by Null Screens
181
In Fig. 9 the PTSC before assembly is shown, for final assembly it is possible to use a flat null
screen for alignment of the PTSC sections. In this example only the result of the test of the
lower central panel of the PTSC component is shown. In the qualitative result for the test of
a central panel (Fig. 9c) it can clearly be observed that, in general the image shows
deformations near the edge of the surface; in the upper part of the image (Fig. 9d) it can be
observed that there are doubled or elongated spots. This behavior is due to some small
deformations of the test surface. In this case it is not possible to separate the doubled spot
images and the surface cannot be tested in this zone, the only spots for which its positions
can be determined on the CCD plane (centroids) are show in Fig. 10.
The proposed flat null screen consists of 600 spots, and only 443 were processed for
quantitative evaluation.
Having the information of the positions of the centroids on the CCD plane, the normals to the
surface are evaluated and the shape of the surface is obtained by using Eq. (3). The method
used for the discrete evaluation was the trapezoidal method, which can be written as
()
()
1
1
1
11
1
1
1
1
22
z
yy
n
n
n
n
xx
n
n
n
n
z
ii
i
z
i
y
i
z
i
y
ii
i
z
i
x
m
i
i
z
i
x
m
+
⎪
⎭
⎪
⎬
⎫
⎟
⎟
⎠
⎞
⎜
⎜
⎝
⎛
−
⎟
⎟
⎠
⎞
++
−
⎟
⎟
⎠
⎞
⎪
⎩
⎪
⎨
⎧
⎜
⎜
⎝
⎛
+−=
+
+
++
+
+
−
=
∑
, (22)
Here m represents the number of points along some integration path; z
1
is the value for the
initial point, which represents only a rigid translation of the surface so it can be
approximated by Eq. (11).
(a)
(b) (c)
Fig. 11. a) Evaluated surface, b) Differences in sagitta between the measured surface and the
best fit, and c) Contour map of differences in sagitta.
Solar Collectors and Panels, Theory and Applications
182
Figure 11a shows the evaluated surface (lower central panel of PTSC); Fig. 11b shows the
differences in sagitta (z coordinate) between the evaluated surface and the best fit. In this
case the P-V difference in sagitta between the evaluated points and the best fit was
Δz
p-v
= 11.08 mm and the rms difference in the sagitta was Δz
rms
= 4.89 mm.
3.2 Testing a PTSC by profile
An alternative method for testing the PTSC is given by (Moreno-Oliva et al., 2009); here the
test is made by testing one profile at a time with two flat null screens and by scanning the
PTSC. All the calculations were made in a meridional plane (X, Y), and for simplicity in the
calculus we use an approximation using ellipses instead of drop shaped spots (Carmona-
Paredes & Díaz-Uribe, 2007).
A ray starting at point P
1
(α, a +b) on the image plane passes through the pinhole located on
the Y axis at a distance b, P (0, b) (Fig. 12), away from the vertex of the surface; this ray
arrives at the test surface at the point P
2
(x
2
, y
2
). After reflection on the PTSC the ray hits the
surface at the point P
3
(x
3
, y
3
) on the flat null screen.
Fig. 12. Layout of the test configuration.
The equation of a parabolic profile with vertex in the origin and axis parallel to the Y axis is
p
x
y
4
=
2
2
2
, (23)
where p is the focal length of the parabola.
The coordinates of the points that describe the parabolic profile P
2
(x
2
, y
2
), in terms of the
parameters of the optical system and the focal length of the parabola p are
α
αpbappa
x
222
2
+22
=
-
, (24)
and the intersection points on the flat null screen P
3
(x
3
, y
3
) are given by
Shape Measurement of Solar Collectors by Null Screens
183
)(
242
44
3
2
22
3
xx
αpxαpapxαx
αxαpxap
yy
-
-
⎥
⎦
⎤
⎢
⎣
⎡
−
−= , (25)
where x
3
= R/2 is constant, R is the separation between the flat null screens.
In the meridional plane, with the inverse ray tracing it is only possible to obtain the
coordinates of the spots from their center and the vertices along the direction parallel to the
Y-axis of each spot in the CCD plane. For each spot on the CCD we obtained three points on
the flat null screen (Fig. 13), and according to reference (Carmona-Paredes & Díaz-Uribe,
2007) we can use an approximation using ellipses instead of the drop shape for simplicity in
the calculations.
Fig. 13 Inverse ray tracing on the X-Y plane, the elliptical approximation in the Y-Z screen
plane, and the flat null screen for testing the PTSC component.
To test the PTSC, the optical system was displaced a distance K and an image for each
profile of the PTSC was captured, the PTSC was scanned along the trough (axis Z), m was
the number of linear arrangements of spots of the flat null screen, and D the trough length.
4. Testing parabolic dish solar collector systems
In reference (Campos-Garcia et al., 2008) the procedure to obtain the shape of fast concave
surfaces is described for a general conic. The same method can be applied to testing of
parabolic dish solar collector systems and the equations are simplified if, instead of using a
general conic only a parabolic surface is considered. The layout of the test configuration is
similar to that of Fig. 1b, starting with one of the points of the proposed arrangement at the
Solar Collectors and Panels, Theory and Applications
184
CCD plane P
1
(ρ
1
, φ, a + b), where P
1
is given in cylindrical coordinates (ρ
1
> 0; 0 ≤ φ ≤ 2π; a, b
> 0), and the calculations are made for a conic with constant k = -1; a ray passing through the
point P(0,0,b) (the pinhole of the camera optical system) reaches the surface at the point
P
2
(ρ
2
, φ + π, z
2
), where
[
]
1
2/1
2
1
22
2
2
ρ
bρrraar
ρ
−−
=
, (26)
ba
ρ
ρ
z +=
1
2
2
, (27)
here r = 1/c is the radius of curvature at the vertex, a is the distance from the aperture stop
to the CCD plane, and b is the distance from the aperture to the vertex of the surface.
After reflection on the surface the ray hits the cylindrical screen at P
3
(ρ
3
, φ + π, z
3
), where
Rρ
=
3
, (28)
22
2
2
1
2
21
21
22
2
3
)(
2
2
zρR
aρrrρρρ
ρρrarρa
z +−−
−−
−+−
= , (29)
R is the radius of the cylindrical screen. Distances a and b are chosen in such a way that the
image of the whole surface fits the CCD area; they are related by Eq. (1), where D is the
diameter of the test surface and β is the sagitta at the rim of the surface, which for a
parabolic surface is given by Eq. (2). The method for the surface shape evaluation is as given
in section 3.1
5. Conclusion
This Chapter gives a general view of the latest developments of the null screen method and
its application in the measurement of the shape of solar collectors. The null screen principles
principle has many advantages when compared to other methods; the method does not
require a special optical system and its implementation is not very expensive, it is also
possible to apply the method to any collector system geometry. With new developments in
null screen methods (section 3) it is possible to increase the precision and sensitivity of the
quantitative evaluation.
6. References
Avendaño-Alejo, M., Moreno-Oliva, V.I., Campos-García, M. & Díaz-Uribe, R. (2009),
Quantitative evaluation of an off-axis parabolic mirror by using a tilted null screen.
Applied Optics. 48, 1008-1015.
Campos-García, M., Díaz-Uribe, R. & Granados-Agustín, F. (2004). Testing fast aspheric
surfaces with a linear array of sources. Applied Optics. 43, 6255-6264.
Campos-García M., Díaz-Uribe R. (2008), Quantitative shape evaluation of fast aspherics
with null screens by fitting two local second degree polynomials to the surface
normals, AIP Conf. Proc. 992, 904-909.
Shape Measurement of Solar Collectors by Null Screens
185
Campos-García, M., Diaz-Uribe, R., & Bolado-Gómez, R. (2008). Testing fast aspheric
concave surfaces with a cylindrical null screen. Applied Optics. 47, 6, (February 2008)
849-859.
Cordero-Dávila, A., & González-García, J., Surface evaluation with Ronchi test by
using Malacara formula, genetic algorithms and cubic splines, in International
Optical Design Conference (IODC)/Optical Fabrication and Testing (OF&T)
Technical Digest on CD-ROM (Optical Society of America, Washington, DC, 2010),
JMB46.
Cornejo-Rodríguez, A. (2007). Ronchi Test, In: Optical Shop Testing, D. Malacara, (Wiley,
New York), pp. 317-360.
Diaz-Uribe, R., & Campos-García, M. (2000). Null-screen testing of fast convex aspheric
surfaces. Applied Optics. 39, 16, (June 2000) 2670-2677.
Díaz-Uribe, R. (2000). Medium precision null screen testing of off-axis parabolic mirrors for
segmented primary telescope optics; the case of the Large Millimetric Telescope.
Applied. Optics. 39, 2790-2804.
Díaz-Uribe, R., Granados-Agustín, F., & Cornejo-Rodríguez, A. (2009) “Classical Hartmann
test with scanning”, Opt. Express, 17, 13959-13973.
Mahajan, V. N., ZernikePolynomials and Wavefront Fitting, In: Optical Shop Testing, D.
Malacara, 3
rd
. Ed. (Wiley, New York), pp. 498-546.
Malacara-Doblado, D., & Ghozeil, I. (2007). Hartmann, Hartmann-Shack, and other screen
tests, In: Optical Shop Testing, D. Malacara, (Wiley, New York), pp. 361-397.
Moreno-Oliva, V.I., Campos-García, M., Bolado-Gómez, R., & Díaz-Uribe, R. (2008a). Point
Shifting in the optical testing of fast aspheric concave surfaces by a cylindrical
screen. Applied Optics. 47, 5, 644-651.
Moreno-Oliva, V.I., Campos-García, M., & Díaz-Uribe, R. (2008b). Improving
the quantitative testing of fast aspherics with two-dimensional point shifting by
only rotating a cylindrical null screen. Journal of optics A: Pure and Applied Optics. 10,
1-7.
Moreno-Oliva, V.I., Campos-García, M., Avendaño-Alejo, M., & Díaz-Uribe, R. (2008c).
Dinamic null screens for testing fast aspheric convex surfaces with LCD´s.
Proceedings of 18
th
IMEKO TC 2 Symposium on Photonics in Measurement, M. Jedlicka,
M. Klima, E. Kostal, P. Pata, eds., (Czech and Slovak Society for Photonics, Czeck
Republic, 2008). (1P5, 6pp).
Moreno-Oliva, V.I., Campos-García, M., Granados-Agustín, F., Arjona-Pérez, M.J., Díaz-
Uribe & Avendaño-Alejo (2009). Optical testing of a parabolic trough solar collector
by null screen with stitching. Proceedings of SPIE in Modeling Aspects in Optical
Metrology II. edited by Harald Bosse, Bernd Bodermann, Richard M. Silver, Vol.
7390 (October 2009) 739012.
Pottler, K., & Lüpfert, E. (2005). Photogrammetry: A Powerful Tool for Geometric Analysis
of Solar Concentrators and Their Components. Journal of Solar Energy Engineering.
127, 94-101.
Salas-Peimbert, Malacara-Doblado, Durán-Ramírez, Trujillo-Schiaffino & Malacara-
Hernández (2005). Wave-front retrieval from Hartmann test data. Applied Optics. 44,
4228-4238.
Solar Collectors and Panels, Theory and Applications
186
Shortis M., & Johnston G. (1996). Photogrammetry: An Available Surface Characterization
Tool for Solar Concentrators, Part 1: Measurement of Surfaces. ASME J. of Solar
Energy Engineering, 118,146-150.
9
Theory, Algorithms and Applications
for Solar Panel MPP Tracking
Petru Lucian Milea
1
, Adrian Zafiu
2
, Orest Oltu
1
and Monica Dascalu
1
1
”Politehnica” University of Bucharest,
2
Romanian Academy Research Institute for Artificial Intelligence
Romania
1. Introduction
The photovoltaic panel is a power source whose parameters depend on some external
factors like incident light angle, shading, ambient temperature etc. Some of these factors are
unpredictable and, for this reason, so is the evolution of cell parameters. The most known
parameters of the photovoltaic panel are the open circuit voltage (V
oc
) and short circuit
current (I
sc
). These values define the points where the I(V) graph curve of the panel
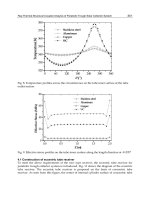
intersects the two axes (I and V), like in Fig. 1.
Fig. 1. Some I(V) characteristics of a photovoltaic panel under different work conditions
Every point on the I(V) curve has specific values of V
i
and I
i
, defining the power as P
i
= V
i
·I
i
.
For a specific I(V) curve there is only one point corresponding to the maximum power. This
is named maximum power point or MPP. For any power source it is always good to supply
electrical consumers at this value or close to it. For a specific resistive load, R
L
, the I
RL
(V)
load characteristic is a line given by the equation I
RL
=-I =V/R
L
. This line intersects the panel
characteristic in a point which is near or far from MPP (Fig. 1.). According to this position,
the power transferred to the load can be only a fraction of the power that panel can supply
at MPP. To correct this unbalance and prevent the associated lose of usefully power, some
methods, generically named MPPT (Maximum Power Point Tracking) are used.
Solar Collectors and Panels, Theory and Applications
188
MPPT methods are designed to tune the electrical current to the value corresponding to
MPP. This means, in other words, to adapt the impedance of the consumers to the optimal
impedance for the best power transfer. For this reason, we named the resulted circuits as
“impedance adapters”. For the studied case, characterized by the almost permanent
modification of the I(V) curve, the MPP varies almost at every moment, therefore the power
maximization process needs a dynamic impedance adaptor.
In the studied scientific literature, we found some algorithms which are purposed to
implement this function, but the adaptation speed may be a problem for some of them
(Yang et al., 2008). We start this study in order to find solutions for simple, fast and accurate
(efficient) MPPT. For this purpose, we propose two computational algorithms and a
impedance adjustment method which use DC/DC converters. The tracking method was
designed to be able to track the MPP for an unknown type of solar panel (viewed as a black
box) and external conditions (irradiance and temperature). The algorithms were simulated
with a dedicated application and the results were compared with other algorithm results
and also with some experimental data.
2. The mathematical model
We propose a mathematical model to estimate the maximal power point of a panel, starting
from the simplest model of a photovoltaic cell.
The photovoltaic cell I(V) characteristic, presented in Fig 2, is given by a equation derived
from the Shockley diode equation:
()
(
)
0
() 1
T
VaV
L
IV I e I
⋅
=
−−
, (1)
where, I
0
is the reverse saturation current, V
T
is the thermal voltage (V
T
=kT/q, with
q=1.602x10
-19
C the electron charge, T – jonction temperature and k=1.381x10
-23
J/K is
Boltzmann constant), a is known as the diode ideality factor (for silicon diodes a is between
1 and 2) and I
L
is cell illumination current.
Fig. 2. The parameters of I-V cell illumination characteristic
The maximal power point, P
m
, corresponds to the point where the power transferred from
the panel/cell to the consumer is maximal. The ratio of P
m
and the product I
SC
· V
OC
(the
dotted areas) define the fill factor, FF, which represents a measure of the resistive losses of
the device.
For the cell illumination current we choose to use a formula based on datasheet parameters
of the cell or panel (Chenni et al., 2007):
Theory, Algorithms and Applications for Solar Panel MPP Tracking
189
(
)
(
)
LLre
f
re
f
re
f
II TTGG
α
=+−
, (2)
where:
G
ref
=1kW/m
2
represents the irradiation at AM1,5, T
ref
=25
0
C, I
Lref
(A) has value I
L
at G
ref
and T
ref
, α(A/K) is the temperature coefficient at short circuit.
The reverse saturation current, I
0
, is given by the relation:
33
0
g
gT
q
akT aV
IDTe DTe
εε
−−
== (3)
For the ideal photovoltaic cell (without resistive losses – Fig. 3.a) we have equation:
()
()
1 1
3
1
10 0
11
g
T ref
T T
T
VV
aV T
aV aV
L ref Lref ref
ref ref
TG
IIe II e e I TT
TG
ε
α
⎛⎞
⎜⎟
−
⎜⎟
⎝⎠
⎛⎞ ⎛⎞
⎛⎞
⎜⎟ ⎜⎟
⎜⎟
=−−= −− +−
⎜⎟ ⎜⎟
⎜⎟
⎝⎠
⎝⎠ ⎝⎠
(4)
The real photovoltaic cell contains also energy dissipation elements. For the approximate
model, presented in figure 3.b, the relation
I(V) becomes:
22
22
20
1
s
T
VIR
aV
s
L
p
VIR
IIe I
R
−
⎛⎞
−
⎜⎟
=−−−
⎜⎟
⎝⎠
(5)
In order to adapt the model for a panel, we take into account that this is formed by a matrix
of NS x NP cells (Fig. 4.). The cell parameters are scaled as follows:
P
L
p
INI= ,
00
P
p
INI= ,
32s
VNV= ,
32p
INI= ,
32p
INI
=
,
P
s
ss
p
N
RR
N
=
,
P
s
pp
p
N
RR
N
=
.
We obtain the global
I(V) equation of the panel:
33
33
30
1
P
s
s
sT
VIR
P
aN V
PP
L
P
p
VIR
IIe I
R
−
⎛⎞
−
⎜⎟
=−−−
⎜⎟
⎜⎟
⎝⎠
(6)
The MPP condition for transferred power is defined as follows:
() ()
0
RL
MPP MPP MPP MPP MPP
dP d I V d I V dI dV
VI
dV dV dV dV dV
⋅−⋅
=
==−−= (7)
Fig. 3. Two equivalent circuits of PV cell: a) an ideal circuit, b) an equivalent circuit with
serial and parallel resistive loses
Solar Collectors and Panels, Theory and Applications
190
Fig. 4. A photovoltaic panel, as a matrix of N
S
x N
P
cells
Denoting with R
X
the value of resistive load at MPP, R
X
=-V
m
/I
m
, we obtain:
1
X
MPP
dI I
dV V R
=− = (8)
For the studied cases, from the relation (8), we obtain:
1
10
/( )
T
V
aV
xT
RaVIe= (9)
21
1/(1/ 1/ )
XS p X
RR R R
=
++ (10)
32
/
XXSP
RRNN
=
(11)
which can be replaced in the following equation, to obtain the PV cell/panel MPP current:
X
V
I
R
=−
(12)
The equation (12) is a nonlinear implicit equation and has to be solved numerically. For the
ideal model of a PV cell, the equation to be solved is:
(
)
(
)
1
1
3
1
0
1
T
g
T ref
V
Lref ref
ref
aV
T
T
aV T
ref
ref
G
ITT
G
V
e
aV
T
Ie
T
ε
α
⎛⎞
⎜⎟
−
⎜⎟
⎝⎠
+−
⎛⎞
+=
⎜⎟
⎜⎟
⎝⎠
⎛⎞
⎜⎟
⎜⎟
⎝⎠
(13)
Also we solved this equation graphically (Fig. 5.), at the intersection of the curves
I(V)
(cell/panel characteristic) and
I
m
(V), where we denoted I
m
=-V/R
X
, under specific conditions.
From the graphics we observed the relatively constant value of
FF, for relatively high
variations of
G and T. A numerical solution can be also obtained following this principle.
Theory, Algorithms and Applications for Solar Panel MPP Tracking
191
Fig. 5. The graphic solution of the MPP equation for two datasets of G and T
In practical applications, the MPP tracking is made in an iterative manner, similar with
numerical solution, trough iterative adjustment of the charge’s impedance to the necessary
value, with the aid of a DC/DC converter (boost, buck or buck–boost converter). For this
type of application we implement two types of algorithms which are presented in section 4.
3. MPPT advantages evaluation, based on proposed model
To assess the benefits of using a MPPT circuit, we consider that it is based on a buck-boost
converter. We’ll make a comparative analysis of the energetic transfer from photovoltaic
panel to a battery by using a direct load circuit and a MPPT circuit respectively.
In this evaluation we will estimate the energetic transfer in a summer day, when the panel
temperature varies between
T
0
=290K at sunrise and T
max
=330K at middle day, when the Sun
is at meridian. To reduce the computational complexity we suppose that the panel tracks the
direction to the Sun, so the direct irradiation is always upright on the panel.
In this simplified hypothesis we suppose that global radiation
AM1 has value G
0
=1000W/m
2
and the global radiation during all day is inverse with the optical path (air mass) throw
atmosphere (m
r
).
0
r
G
G
m
=
, (9)
where m
r
is given by (Milea, 2010):
(
)
2
531 1 /265,25 cos ( ) cos( )
r
mzz=⋅ + − (10)
To estimate the panel temperature, we used a simplified formula, considering that it is
directly dependent with the Sun’s position. Under this aproximative model, for a cloudless
summer day, the diurnal variation of the panel temperature will be (Milea, 2010):
0
r
T
TT
m
Δ
=+ , (11)
where
T=290K and ΔT=40K.
For a panel with
N
S
x N
P
cells, based on the ideal model, the open circuit voltage formula is:
Solar Collectors and Panels, Theory and Applications
192
0
ln 1
L
OC T S
I
VaVN
I
⎛⎞
=⋅ ⋅ ⋅ +
⎜⎟
⎜⎟
⎝⎠
(12)
The short circuit current is:
()
(
)
SC P L P Lref ref
ref
G
ININ I TT
G
α
=⋅= + − (13)
To model a solar panel for off-grid application with a DC bus of 12V, under reference
conditions, we choose N
S
=44 taking into account that V
OCcref
=0,51V, for a single cell. The
obtained open voltage of the panel is V
OCref
=22,64V, which is a common value for such
applications.
For the mentioned parameters, we determined the values of V
OC
, I
SC
and P
MAX
for G and T
values corresponding to different hours of a cloudless summer day. The results are plotted
in Fig. 6.
Fig. 6. V
OC
, I
SC
and P
MAX
curves at different hours of a cloudless summer day
Note that the voltage is always greater than 19V, while the current and maximum reference
power curves have a gait similar to that of the optical path.
If direct charging of accumulator batteries, since the panel voltage is significantly higher
than the battery’s one (Milea, 2010), we can assume with a very good approximation that the
battery will charge at the panel’s short-circuit current:
()
(
)
DIR bat SC bat P Lref ref
ref
G
PVIVN I TT
G
α
=⋅=⋅⋅ + −
(13)
From (9) şi (13), because the irradiance references, G
0
and G
ref
, are identical, we obtain:
0
bat P
DIR Lref ref
rr
VN
T
PITT
mm
α
⎛⎞
⎛⎞
⋅
Δ
=++−
⎜⎟
⎜⎟
⎜⎟
⎜⎟
⎝⎠
⎝⎠
(14)
For the cosine function of the zenith angle of a summer day, in Bucharest, Romania, we used
an approximated relation (Milea, 2010):
cos( ) 0, 2813 0,6488 cos(0,2618 2,8117)zt=+⋅ ⋅+ , (15)
where t is the legal time of Bucharest, expressed in hours.
Theory, Algorithms and Applications for Solar Panel MPP Tracking
193
If the battery is charged using a MPPT charger, approximating FF=0.8 as constant
throughout the day (Fig. 5.), we get:
()
(
)
MPP m m OC P SC OC P Lref ref
ref
G
PVIFFVNI FFVN I TT
G
ηηα
=⋅=⋅ ⋅⋅⋅=⋅ ⋅⋅⋅ + −
, (16)
where η =0,95 is the efficiency of the MPPT charger.
From (9) and (16), we obtain:
0
OC P
MPP Lref ref
rr
FF V N
T
PITT
mm
η
α
⎛⎞
⎛⎞
⋅⋅⋅
Δ
=++−
⎜⎟
⎜⎟
⎜⎟
⎜⎟
⎝⎠
⎝⎠
(17)
The instant ratio of powers in the two cases will be:
0
0
ln 1
ln 1
L
TS
MPP OC S
L
T
DIR bat bat bat
I
FF a V N
I
PFFV aFFN
I
V
PV V V I
η
ηη
⎛⎞
⋅⋅⋅ ⋅ ⋅ +
⎜⎟
⎛⎞
⋅⋅ ⋅⋅⋅
⎝⎠
== = ⋅+
⎜⎟
⎜⎟
⎝⎠
(18)
Based on these relations we calculate the powers supplied by a solar panel to the battery by
direct connection (P
DIR
), and through a MPPT charger (P
MPP
). All calculations are made for a
cloudless summer day. The two powers and their ratio are plotted in Fig. 7.
Fig. 7. Direct power and MPPT power (left) and the power ratio (right)
If we evaluate the daily average power gain of using MPPT, starting from average hourly
values, we get:
0,11 0,01 6 0,1
20,1160,02
0,59
22 2
1,2 1,2 1,274
16 8
MPPs
DIRs
P
P
⋅
⎛⎞
⋅+++⋅+
⎜⎟
⎝⎠
=+ =+ =
(19)
So in summer, MPPT circuits provide an average increase of 27.4% transferred powers.
Making the same calculations for the winter, we get the following chart:
Solar Collectors and Panels, Theory and Applications
194
Fig. 8. Power ratio under winter conditions
If we evaluate the average MPPT power gain for winter, we get:
0,04 0,003
220,0420,04
0,143
22
1,276 1,276 1,312
84
MPPw
DIRw
P
P
⎛⎞
⋅+⋅+⋅+
⎜⎟
⎝⎠
=+ =+ =
, (20)
It follows an average power gain of 31.2%, higher than in summer.
Therefore, the minimum power gain, obtained by MPP tracking, is 27.4%.
4. Proposed MPPT algorithms
The maximum power point (MPPT) tracking algorithms use the I(V) characteristic and the
P(V) characteristic. All over the world there are many studies concerning the maximum
power point (MPP) tracking. The performance of various types of MPPT algorithms (Chenni
et al., 2007), (Faranda et al., 2007), (Santos et al., 2006), (Hui, 2008) is always measured by
precision tracking of MPP and responsiveness to changes in the power curve.
In several studies we have addressed MPP tracking algorithms (Zafiu et al., 2009) and have
designed new solutions, original circuits and applications for this purpose (Milea, 2010).
To determine the MPP we used previous mathematical relationships to create the
algorithms presented in this section.
The proposed MPP tracking algorithms stands upon the relation dP/dV=0 and involves the
continuous adjustment of impedance adaption circuit (increasing or decreasing). Initially we
choose two points so that dP/dV<0, respectively dP/dV>0, and the MPP is estimated to the
medium value of these two points. Then, while dP/dV>err, the distance between points will
be decreases and the MPP will take again the medium value of these points. The principle of
MPP determination follows two phases. Firstly there is the measurement of three successive
points (according to V) in the coordinates of I and V. Secondly, starting from these three
points, the control circuit will decide the next adjustment to achive the MPP.
Theory, Algorithms and Applications for Solar Panel MPP Tracking
195
4.1 General presentation of the algorithms principle
This algorithm considers the values of three points (the last measured values) and Δ the
distance between points. The measured value is in the middle and the other points are
equidistant positioned on the left and on the right side of middle point (Fig. 9.).
Measured point
P0
??
d
d-?
d+?
P1 P2
Fig. 9. Point’s relative position
Fig. 10. Example of adjusting d and Δ so that MPP is between d-Δ and d+Δ
Fig. 11. Example where Δ is progressively reduced