The Discovery of Type II Superconductors Part 10 ppt
Bạn đang xem bản rút gọn của tài liệu. Xem và tải ngay bản đầy đủ của tài liệu tại đây (3.89 MB, 25 trang )
Superconductor
216
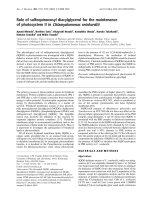
Fig. 10. Normalized pinning force density f=F
p
/F
pmax
as a function of reduced field h=B/B
irr
of NEG-123 samples with the same, 35 mol%, content of Gd-211 (70 nm) but various
contents of TiO
2
, for temperatures from 65 to 90 K.
7. Flux pinning in NEG-123 with MoO
3
nanoparticles
The size reduction of non-superconducting pinning centers significantly below 100
nanometer range proved that mesoscopic precipitates (size of a few tens of nanometers)
were able to exceptionally enhance flux pinning up to very high temperatures. Although
levitation experiments at 90.2 K have already been realized with NEG-123 superconductors
doped by Zr-based or TiO
2
based nanoparticles, the safety margins needed for practical
applications require a further improvement in flux pinning in these materials. Recent
experiments clarified that this task could be realized with MoO
3
nanoparticles.
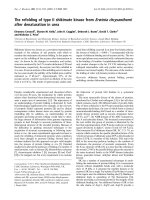
Figure 11 shows the temperature dependence of the dc magnetic susceptibility in the ZFC
and FC modes in magnetic field of 1 mT for NEG-123 + 35 mol% Gd-211, 1 mol% CeO
2
, and
0.5 mol% Pt samples with varying contents of MoO
3
. All the samples exhibited a sharp
superconducting transition (around 1 K wide) with a high onset T
c
. The onset T
c
systematically decreased from 93.2 to 92 K with increasing MoO
3
content.
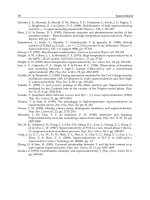
The critical current density at 77 K of the MoO
3
added NEG-123 composites with 35 mol%
Gd-211 secondary phase is presented in Fig. 12 (left). The remnant critical current density
dramatically increased for 0.1 mol% MoO
3
but decreased thereafter. The J
c
-B curves of the
0.1 mol% MoO
3
sample deduced from SQUID magnetometer measurements in the
temperature range around 77 K in magnetic field applied parallel to the c-axis are shown in
Fig. 12. At 65 K tremendous super-currents were obtained, exceeding 700 kA/cm
2
at 0 and
4.5 Tesla and 610 kA/cm
2
over the whole range, up to 5 Tesla. These values approach the
range typical for thin films. It might be promising to combine this technology with that used
for fabrication of thick coated conductors. At liquid argon (87 K) and liquid oxygen (90.2 K),
the super-current densities at zero field reached 175 kA/cm
2
and 50 kA/cm
2
, respectively.
0
0.2
0.4
0.6
0.8
1
70 K
73 K
75 K
77 K
78 K
80 K
82 K
84 K
86 K
88 K
90 K
0
0.2
0.4
0.6
0.8
1
0 0.2 0.4 0.6 0.8 1
65 K
68 K
70 K
73 K
75 K
77 K
80 K
82 K
84 K
86 K
88 K
90 K
0
0.2
0.4
0.6
0.8
1
65 K
68 K
70 K
73 K
75 K
77 K
80 K
82 K
84 K
86 K
88 K
90 K
0
0.2
0.4
0.6
0.8
1
0 0.2 0.4 0.6 0.8 1
65 K
68 K
70 K
73 K
75 K
77 K
80 K
82 K
84 K
86 K
88 K
90 K
F
p
/F
p,max
h
o
h
o
F
p
/F
p,max
0.0 mol% TiO
2
0.1 mol% TiO
2
0.3 mol% TiO
2
0.2 mol% TiO
2
Nanoscale Pinning in the LRE-123 System -
the Way to Applications up to Liquid Oxygen Temperature and High Magnetic Fields
217
-10
-8
-6
-4
-2
0
20 40 60 80 100 120
0.10
0.20
0.30
0.35
Magnetization (emu/cm
3
)
Tem
p
erature
(
K
)
H//c, 1mT
ZFC
FC
Fig. 11. Temperature dependence of the normalized susceptibility of the OCMG-processed
NEG-123 + 35 mol% Gd-211 (70 nm) with varying contents of MoO
3
.
0
100
200
300
400
01234567
0.00
0.10
0.20
0.30
0.35
J
c
(kA cm
-2
)
T = 77 K
H//c-axis
MoO
3
mol%
H
a
(T)
μ
ο
0
200
400
600
800
01234567
65 K
77 K
87 K
90 K
MoO
3
0.1 mol%
J
c
(kA cm
-2
)
H
a
(T)
μ
ο
Fig. 12. Left: J
c
(B
a
) plots for NEG-123 samples with 35 mol% Gd-211 (70 nm), 1 mol% CeO
2
, 0.5
mol% Pt, and various contents of MoO
3
at 77 K and B
a
||c-axis. Note the relatively high critical
current density of 390 kA/cm
2
at self-field at 77 K achieved with 0.1 mol% MoO
3
. Right: The
J
c
(H) curves of the sample with 0.1 mol% MoO
3
under liquid nitrogen pumping (65 K), at
liquid nitrogen (77 K), liquid argon (87 K), and liquid oxygen (90.2 K) (H||c-axis). Note the
very high critical current density of 700 kA/cm
2
at self-field and 4.5T at 65 K (right figure).
The MoO
3
-based nanoparticles thus represent an effective pinning medium, appropriate for
moderate magnetic fields and high temperatures, going up to boiling point of liquid oxygen.
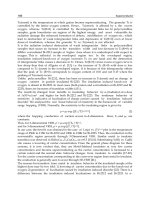
In order to evaluate the nanoparticle dispersion and its chemical analysis in the NEG-123
sample with 0.1 mol% MoO
3
, TEM-EDX observations were performed on it. Figure 13 shows
the TEM viewed from the <001> direction. Three types of defects can be seen: large irregular
inclusions of about 150 to 500 nm in size, round particles of 20-50 nm size, and clouds of
spots less than 10 nm in diameter. We note that in the partial-melted region there are two
different kinds of LRE-211 inclusions: one (ball-milled) added to the initial powders and
another one being created by peritectic decomposition of LRE-123. The large particles (over
150 nm in size) are Gd-rich NEG-211 or NEG-211 ones of the latter origin.
Superconductor
218
The chemical composition of the precipitates was studied by scanning TEM-EDX analysis. The
quantitative analysis clarified that the large particles were Gd-211/Gd-rich-NEG-211, in
agreement with our earlier studies of the NEG-123 system. In contrast, the defects with size
below 50 nm always contained a significant amount of Mo. For the particles less than 10 nm,
marked by the white arrows, it was difficult to estimate the exact composition. Anyway, just
these particles are considered to be responsible for the high Jc observed at high temperatures.
We succeeded in finding the appropriate processing parameters for their creation. The pinning
enhancement due to the new type of defects is so profound that it extends up to temperatures
above 90 K. This means that the limiting operating temperature for levitation experiments and
other applications shifts from liquid nitrogen (77.3 K) to liquid oxygen (90.2 K) temperature.
Fig. 13. Transmission electron micrograph of NEG-123 sample with 35 mol% Gd-211 (the
initial average particle size 70 nm) and 0.1 mol% MoO
3
the arrows point to some of the
smallest nanoparticles, of size below 10 nm.
8. Flux pinning in NEG-123 due to Nb
2
O
5
nanoparticles
An optimum content, size, and dispersion of the nanoparticles play the crucial role in
improving vortex pining in the melt-textured LRE-123 materials. Different physical/chemical
properties are certainly equally important. This conclusion follows from the fact that the
refractory metals of the same group as Zr give so different results, even if added in the same
amount and same size. The best results in this direction were so far achieved with Nb
2
O
5
nanoparticles added to the NEG-123 material. The critical current densities at 77 K of the
NEG-123 composites with 35mol% Gd-211 doped by various contents of Nb
2
O
5
are presented
in Fig. 14. The low-field super-current density in the sample with 0.1 mol% of Nb
2
O
5
was more
than factor three higher than that of the standard NEG-123. The remnant J
c
values of 640
kA/cm
2
and 400 kA/cm
2
were achieved at zero and 2 Tesla, respectively. This result was by
more than 50% better than the previous record values of NEG-123 and by more than order of
magnitude better than in other RE-123 materials. With further increase of Nb content the
super-current density and irreversibility already dropped. The super-currents in the sample
with 0.1 mol% of Nb
2
O
5
in temperatures around 77 K are presented in the in Fig. 15. The
remnant J
c
value reached 925 kA/cm
2
at 65K. In liquid argon (87 K) and liquid oxygen (90.2 K)
the super-current densities at zero field reached 300 kA/cm
2
and 100 kA/cm
2
, respectively.
These J
c
values are the highest reported so far for bulk RE-123 materials at the respective
temperatures, approaching nearly the thin film limit.
Nanoscale Pinning in the LRE-123 System -
the Way to Applications up to Liquid Oxygen Temperature and High Magnetic Fields
219
Fig. 14. Field dependence of the super-current density in NEG-123 samples with the same,
35 mol% content of Gd-211 (70 nm) but various contents of Nb
2
O
3
. All the samples were
measured at T = 77 K with H||c-axis. The current density increased in the whole field range
up to the 0.1 mol% content of Nb
2
O
5
and decreased thereafter. Note the critical current
density of 640 kA/cm
2
at self-field and 77 K, achieved with 0.1 mol% Nb
2
O
5
.
In Fig. 16 we show the TEM images of the sample with 0.1 mol% Nb
2
O
5
, viewed from the
<001> direction. Three types of defects can be seen: large irregular inclusions of about 150 to
500 nm in size, round particles of 20-50 nm size, and clouds of spots less than 10 nm in
diameter. We note that in the partial-melted region there are two different kinds of LRE-211
inclusions: one (ball-milled) added to the initial powders and another one being created by
peritectic decomposition of LRE-123. The large particles (over 150 nm in size) are Gd-rich
NEG-211 or NEG-211 ones.
0
200
400
600
800
1000
01234567
65 K
77 K
87 K
90 K
H//c-axis
J
c
(kA cm
-2
)
H
a
(T)
μ
ο
Fig. 15. The J
c
(H) curves of the sample with 0.1 mol% Nb
2
O
5
under liquid nitrogen pumping
(65 K), at liquid nitrogen (77 K), liquid argon (87 K), and liquid oxygen (90.2 K) (H||c-axis).
Note the record critical current density of 925 kA/cm
2
at self-field and 4.5T at 77 K.
Superconductor
220
Fig. 16. Transmission electron micrograph of NEG-123 sample with 35 mol% Gd-211 (the
initial average particle size 70 nm) and 0.1 mol% Nb
2
O
5
the arrows point to some of the
smallest, Nb-based, nanoparticles.
The small Gd-211 nanoparticles (≈20 nm) were found to be those contaminated by Zr during
the ball milling process. As Nb and Mo just follow Zr in the periodic table of elements, they
possess similar properties as Zr, in particular chemical inactivity with respect to the
constituents of the perovskites under study.
The chemical structure identification of the precipitates was made by scanning TEM-EDX
analysis. The analyzed spot of 2-3 nm in diameter enabled to unambiguously analyze even
the smallest clusters. The quantitative analysis clarified that the large particles were Gd-
211/Gd-rich-NEG-211, while the defects with size below 50 nm always contained a
significant amount of Zr, in agreement with our earlier studies of the NEG-123 and SEG-123
systems (Muralidhar et al., 2003c; Muralidhar et al., 2004a). Recently, the exact chemical
composition of these particles was determined as LREBa
2
CuZrO
y
(Muralidhar et al., 2003).
The new class of precipitates of less than 10 nm in size contained a detectable amount of Nb
incorporated in the NEG secondary phase. Some of these defects are marked in Fig. 16 by
white arrows but these defects were distributed over the whole sample. Four such defects
are denoted as B1 - B4 in figure 16. The four nanoparticles possessed different elemental
ratios but always a significant amount of Nb atoms (see Fig. 17). The appearance of such
small defects correlates with the super-current enhancement in a wide temperature range,
spread up to liquid oxygen temperature.
The decreasing average particle size resulted in a critical current density enhancement at
low and intermediate magnetic fields. Although the size of the smallest particles came close
to the vortex core size, 2ξ, (in YBCO 2ξ
ab
(77 K) ≈ 4.5 nm) and thus the limit of single-vortex
interaction has been approached for these particles, no sign of a crossover to the secondary
peak enhancement was observed. Note that a similar behavior was observed in the studies
of [Werner et al., 2000] and [Sauerzopf et al., 1995; Sauerzopf et al., 1998] done on various
RE-123 and Y-124 single crystals irradiated by fast neutrons. The explanation might be still a
broad distribution of defect sizes, the largest ones having the strongest pinning energy,
governing thus the overall behavior of the sample. Another possibility is that the crossover
Nanoscale Pinning in the LRE-123 System -
the Way to Applications up to Liquid Oxygen Temperature and High Magnetic Fields
221
between multiple- and single-vortex pinning is rather sharp and we are still not close
enough. Or, the present defects are in some sense different from the typical point-like
defects (oxygen vacancies and/or the LRE-123 matrix chemical fluctuation (Werner et al.,
2000; Ting et al., 1997; Osabe et al., 2000).
0
0.1
0.2
0.3
0.4
0.5
0.6
0.7
B1 B2 B3 B4
NEG /Ba
Nd/ Ba
Eu/Ba
Gd/Ba
Nb/ Ba
Elemental ratio
< 10 nanometer size
p
articles
Fig. 17. The elemental content in the new nanoparticles in the material from Fig. 16. Note the
significant amount of Nb in all nanoparticles.
The last NEG-123 material features the highest flux pinning performance of all bulk RE-123
compounds developed in SRL-ISTEC and to our knowledge in the world. To control
pinning performance of the NEG material in a broad low-field range, various second phase
precipitates have been tested in various contents. Gd-211 was found to produce always the
highest flux pinning. Its optimum content was established to be around 35mol%. In each
further step we have used the optimum composition obtained in the previous step. Thus,
the Gd-211 content was also here just 35 mol%. Also the oxygen partial pressure has been
chosen in accord with the best previous experience. The only variable in the present work
was the varying content of the nanometer-sized TiO
2
, MoO
3
, and Nb
2
O
5
. As a result, critical
current density was enhanced by factor 2, 3, and 4, respectively, in comparison with the best
our previous results, in all cases extended up to high temperatures. This record electro-
magnetic performance was always accompanied by appearance of clouds of exceptionally
small precipitates (10 nm in size) in the NEG-123 matrix. Although this cannot be taken as a
direct proof of causality, a similar coincidence observed previously in the case of Zr-
contaminated 20 nm in size particles and the previous significant enhancement of the low-
and medium-field critical currents (Muralidhar et al., 2005) supports this conclusion. In fact,
it correlates with predictions of various models of vortex interaction with “large” normal
particles (Campbell et al., 1991; Dew-Hughes et al., 1974; Zablotskii et al., 2002) suggesting
j
c
∝d
-n
, where d is the average particle diameter and n=1 [2] or 1/2. These facts are strong
indications that the enhanced pinning is due to a collaborative pinning by the operative
pinning assemble, the result being exceptionally sensitive to the smallest nanoparticles, in
our work especially those containing Mo and Nb, 10 nm in size.
Superconductor
222
9. Trapped-field distribution in the NEG-123 samples calculated using the
J
c
-B data at 77 K and 90 K.
In the NEG system, we can now for the first time create a particles distribution of the size
less than 10 nm. As a result, the critical current density is very high, even at the boiling point
of liquid oxygen. Trapped field measurements at 90.2 K for sample with Zr-contaminated
nanoparticles (Muralidhar et al., 2004b) showed two peaks the higher of which reached 0.16
T. It indicated a crack in the sample created during magnetization process. Evidently, the
mechanical performance was not good enough and a reinforcement was needed by adding
silver oxide, resin impregnation (Tomita & Murakami, 2003), and/or an external metal ring
(Kita et al., 2006).
We calculated TF values using experimental J
c
-B data and with help of a numerical
simulation. NEG-123 with 30 mol% Gd-211 (70 nm particles) was selected for this purpose,
the J
c
-B data from Fig. 4. Based on these data we calculated trapped field profile for disks of
40 mm and 50 mm diameters and thicknesses of 10 mm and 20 mm, respectively. Figure 18
shows the result for the disk of 50 mm in diameter and 20 mm thick, giving 0.45 T at 90 K.
So far a standard NEG-123 sample of 32 mm diameter was able to trap in remnant state at 77
K maximum of 1.4 T (Yamada et al., 2003). Using the same J
c
-B data, trapped field profiles
for 77 K and samples of 50 mm in size and 10 and 20 mm thick were calculated in the same
manner as above. The results are presented in Fig. 19. The trapped field reached more than 4
T in remnant state at 77 K. A summary of the calculated TF values at 77 K and 90 K is
presented in the right Fig. 19. It is clear that the NEG-123 samples can generate more than 5T
at 77 K with increasing the sample size to 60 mm diameter. The simulation results proved
that the new material enables construction of non-contact pumps for transport of liquid
gases including liquid oxygen. Thus, these results represent a significant step forward in the
technology of bulk high-T
c
superconductors towards novel engineering applications.
10. Levitation experiments at liquid oxygen temperature (90.2 K) and its new
application potential
When speaking about applications of bulk high-temperature superconductors,
superconducting levitation should be mentioned in the first place. Several years after the
discovery of high temperature superconductivity, we developed a NEG-123 disk capable of
levitation with liquid oxygen cooling. Although Y-123 has also critical temperature above
boiling point of oxygen (90.2 K), levitation with this coolant has not yet been possible. The
reason is that the pinning performance of Y-123 rapidly drops when coming close to the
critical temperature. Thus, Y-123 can be used so far only for levitation at 77.3 K. The
superconductors with T
c
higher than 100 K, like Bi
2
Sr
2
Ca
2
Cu
3
O
9+δ
and others, exhibit a poor
pinning performance already at intermediate temperatures and thus they cannot be used for
levitation even with liquid nitrogen cooling. The new LRE-123 materials reach critical
temperatures 93-96 K, not significantly above those typical for Y-123, but the best of them
possess an exceptionally good pinning at high temperatures, super-current density being in
the range of several tens of kA/cm
2
at 90 K (Fig. 15). This enabled levitation experiments
with liquid oxygen cooling. Superconducting materials working at 90.2 K might have an
important impact in industrial applications as magnet levitation at this temperature is a
direct link to construction of non-contact pumps for liquid oxygen. Note that the industrial
use of liquid oxygen is quite broad. It is commonly used in hospitals or as an oxidizer for
liquid hydrogen fuel for launching rockets.
Nanoscale Pinning in the LRE-123 System -
the Way to Applications up to Liquid Oxygen Temperature and High Magnetic Fields
223
Fig. 18. The calculated trapped field distribution in the sample NEG-123 + 30 mol% Gd-211
(70 nm in size), melt processed in Ar-1% O
2
, at liquid oxygen temperature (90.2 K).
Dimensions and thicknesses of the sample were assumed 40&50 mm and 10&20 mm,
respectively. The high trapped field of 0.45 T was achieved in the remnant state at 90.2 K.
Fig. 19. The calculated trapped field distribution in the sample NEG-123 + 30 mol% Gd-211 (70
nm in size), melt processed in Ar-1% O
2
, calculated for the liquid nitrogen temperature.
Dimensions and thicknesses of the sample were assumed 50 mm and 10&20 mm, respectively.
Trapped field as high as 4.5 T was achieved in the remnant state at 77.3 K. The summary for
the sample size vs trapped field at 77 K and 90 K in the remnant state is in the right figure.
Superconductor
224
Fig. 20. (left) NEG-123 + 40 mol% Gd-211 superconductor suspended below another NEG-
123 + 40 mol% Gd-211 superconducting magnet. Both NEG super-magnets were before
cooled by liquid oxygen; (right) Levitation of a tilted Fe-Nd-B magnet over the NEG-123 +
40 mol% Gd-211 superconductor cooled by liquid oxygen. Note that liquid oxygen is
attracted to the magnet due to its paramagnetism.
Fig. 20 (left) is a proof, how effective is the potential well created in this way: a NEG-123
magnet can be suspended below another NEG-123 magnet when both are kept cool enough.
That liquid oxygen is really used as a coolant, it is seen in figure 20 (right): since liquid
oxygen is paramagnetic (in contrast to the diamagnetic liquid nitrogen), it is attracted to a
tilted Fe-Nd-B magnet hanging over the superconductor immersed in liquid oxygen.
Hospitals need comprehensive medical gas distribution systems to meet increasing
demands of the life support technologies and emergency help. Medical gases have to be
distributed in a clean, safe, and reliable manner. Gases in liquid form can be transported in a
sophisticated network, which would supply either medical air and/or oxygen for patient
breathing support or nitrous oxide for anesthesia. For such systems, the new
superconductors represent a basic construction material for design of non-contact liquid
oxygen pumps.
11. Summary
Over the past 20 years, remarkable progress in the area of melt-grown LRE-123 systems
processing has been made. Improved processing techniques like oxygen controlled melt
growth (OCMG) have been used for LREBa
2
Cu
3
O
y
bulks processing and then ternary
LREBa
2
Cu
3
O
y
systems have been developed. Ternary LREBa
2
Cu
3
O
y
composites feature
typical T
c
onset around 94 K, critical current density at 65 K in the self-field and 5 T at the
level of 10
5
A/cm
2
(H//c-axis), and irreversibility field at 77 K (H//c-axis) up to 15 T. This
performance, highly exceeding that of YBCO, makes from these materials an excellent
option for utilization in practical applications. A very important aspect is the possibility to
control the pinning defects size up to nanoscale level and to bring it close to the material’s
coherence length (4.5 nm in YBCO at 77 K and similar in the LRE-123 compounds). A
further tuning of the nanoscale secondary phase particles and Zn, Mo, Ti, Nb etc. additives
enhance flux pinning of these materials up to 3 times compared to a single-LRE 123
material. As a result, pinning in these materials is very strong up to liquid oxygen
temperature (90.2 K), leading to impressive levitation forces and extending thus the
Nanoscale Pinning in the LRE-123 System -
the Way to Applications up to Liquid Oxygen Temperature and High Magnetic Fields
225
application range of 123 compounds by about 13 K. In another direction, these materials can
be utilized as a new type of bulk superconducting magnets, in particular for liquid oxygen
pumps for various purposes.
12. Acknowledgements
The authors would like to record thanks to Prof. S. Tanaka, the former Director of ISTEC-
SRL for his encouragement. We also acknowledge the stimulating discussions with Dr. U.
Balachandran (Argonne), Prof. David A Cardwell (University of Cambridge), Dr. Shunichi
KUBO (RTRI), Prof. M. Murakami (SIT), Prof. V. Hari Babu (Osmania University), Dr. A.
Das (Canada), Dr. M. R. Koblischka (Germany), Dr. N. Sakai (ISTEC-SRL) and Dr. P. Diko
(SAS,Slovakia). This work was supported by Grants-in-Aid for Science Research from the
Japan Society for the Promotion of Science (JSPS). One of the authors, MJ, acknowledges
support from grants MEYS CR No. ME 10069 and AVOZ 10100520.
13. References
Aksay, I.; Han, C.; Maupin, G. D.; Martin, C. B.; Kurosky, R. P.; & Stangle, G. C. (1991).
Ceramic precursor mixture and technique for converting the same to ceramic,
United states patent No. 5061682, October 1991.
Awaji, S.; Isono, N.; Watanabe, K.; Murakami, M.; Muralidhar, M.; Koshizuka, N.; & Noto,
K. (2004). Bose glass state in (Nd,Eu,Gd)Ba
2
Cu
3
O
x
bulk with high irreversibility
field, Phys. Rev. B, Vol.69, No.21, (214522, 4p).
Brunauer, S.; Emmett, P.; & Teller, E. (1938) Adsorption of Gases in multimolecilar layers. J.
Am. Chem. Soc. Vol. 60, No. 2, (309-319).
Bednorz, J. G.; & and Mueller, K. A. (1986). Possible high T
c
superconductivity in the Ba-La-
Cu-O system, Z. Phys. B, Vol. 64, No. 2, (189-193).
Babcock, S. E.; Cai, X. Y.; Kasier, D.L.; & Larbalestier, D.C. (1990). Weak-link-free behaviour
of high-angle YBa
2
Cu
3
O
y
grain boundaries in high magnetic fields, Nature Vol. 347,
13 September 1990, (167-169).
Blohowiak, K. Y.; Garrigus, D. F.; Luhman, Thomas S.; Mccrary, K. E.; Strasik, M.; Aksay, I.;
Dogan, F.; Hicks, W. C.; & Martin, C. B. (2000). Making large, single crystal, 123
YBCO superconductors, United states patent No. 6046139, April 2000.
Campbell, A. M.; Evetts, J. E.; & Dew-Hughes, D. (1968). Pinning of flux voritices in type II
superconductors, Philos. Mag. Vol. 18, (313-343).
Cava, R. J.; Batlogg, B.; van Dover, R. B.; Murphy, D. W.; Sunshine, S. ; Siegrist, T.; Remeika,
J. P.; Rietman, E. A.; Zahurak, S.; & Espinosa, G. P. (1987). Bulk superconductivity
at 91 K in single phase oxygen-deficient perovskite Ba
2
YCu
3
O
9-δ
, Phys. Rev. Lett.
Vol.58, Issue 16, (1676-1679).
Cardwell, D. A. (1998). Processing and properties of large grain (RE)BaCuO. Mater. Sci.
Eng.B, Vol. 53, No.1 (1-10).
Dew-Hughes, D. (1974). Flux pinning mechanisms in type II superconductors, Philos. Mag.
30, Issue 2, (293-305).
Diko, P.; Muralidhar, M.; Koblischka, M. R. & Murakami, M. (2000). Homogeneous
distribution of 211 secondary-phase particles in single-grain melt-grown
(Nd,Eu,Gd) Ba
2
Cu
3
O
7
bulk, Physica C, Vol.339, No. 3, (143-147).
Superconductor
226
Egi, T.; Wen, J. G.; Kurada, K.; Koshizuka, N.; & Tanaka, S. (1995). High critical-current
density of Nd (Ba,Nd)2Cu3O7-
δ
single crystals. Appl. Phys. Lett. Vol. 67, No. 16,
(2406-2408).
Fuchs, G. (2000). Trapped magnetic fields larger then 14T in bulk YBa
2
Cu
3
O
y
.
Appl. Phys.
Lett. Vol. 76, No. 15, (2107-2109)
Jirsa, M.; & Muralidhar, M. (2004). Superconducting permanent magnets for high
temperature operation, Czech J. Phys., Vol.54, No. 1, (441-444).
Jin, S.; Fastnacht, R. A.; Tiefel, T. H.; & Sherwood, R. C. (1988). Transport critical current in
rare-earth-substituted superconductors RBa
2
Cu
3
O
7-δ
, (R=Gd, Dy, Sm, Ho,Y), Phys.
Rev. B. Vol. 37, Issue 10, (5828-5830).
Koblischka, M. R.; van Dalen, A.J.J.; Higuchi, T.; Yoo, S. I.; & Murakami, M. (1988). Analysis
of pinning in NdBa
2
Cu
3
O
7-δ
superconductors, Phys. Rev. B, Vol. 58, Issue 5, (2863-
2867).
Krabbes, G.; Fuchs, G.; Schatzle, P.; GruB, S.; Park, J. W.; Hardinghaus, F.; Stover, G.; Hayn,
R.; Dreshsler, S-L.; & Fahr, T. (2000). Zn doping of YBa
2
Cu
3
O
y
in melt textured
materials: peak effect and high trapped fields, Physica C. Vol. 330, No. 3, (181-190).
Kita, M., Nariki, S.; Sakai. N.; & Hirabayashi, I. (2006). Characteristics of metal impregnated
bulk Gd-Ba-Cu-O superconductors cooled down in a magnetic field, Supercond. Sci.
Technol., Vol. 19, Issue 7, (S491-S493).
Mavani, K.R., Rana, D.S., Nagarajan, R.; & Kuberkar, D.G. (2004). Effect of Sc and Ti doping
on superconducting and magnetic properties in DyBa
2
Cu
3
O
7-δ
, J. Mag. and Mag.
Mat., Vol. 272, (E1067-E1069).
Murakami, M.; Gotoh, S.; Fujimoto, H.; Yamaguchi, K.; Koshizuka, N.; Tanaka, S. (1991).
Flux pinning and critical currents in melt processed YBCO superconductors,
Supercond. Sci. Technol. Vol. 4, No. 1S, (S43-S50).
Murakami, M.; Takata, T.; Yamaguchi, K.; Kondoh, A.; & Koshizuka, N. (1995). Oxide
superconductor and preocess for producing the same, United states patent No.
5395820, May 1995.
Murakami, M.; Sakai, N.; Higuchi, T.; & Yoo, S. I. (1996). Melt-processed light rare earth
element -Ba-Cu -O. Supercond. Sci. Technol. Vol. 9, Issue 12, pp.1015-1032.
Muralidhar, M.; Chauhan, H. S.; Saitoh, T.; Kamada, K.; Segawa, K.; & Murakami, M. (1997).
Effect of Mixing Three Rare Earth Elements on the superconducting properties of
REBa
2
Cu
3
O
y
, Supercond. Sci. Technol., Vol. 10, Issue 9, (663-668).
Muralidhar, M.; Murakami, M.; Segawa, K.; Kamada, K.; & Saitho, T. (2000). Oxide
Superconductor of high critical current density, United states patent No. 6063736,
May 2000.
Muralidhar, M.; & Murakami, M. (2000). Effect of matrix composition on the flux pinning in
(Nd,Eu,Gd)Ba
2
Cu
3
O
y
superconductors, Phys. Rev. B., Vol. 62, No.21, (13911-13914).
Muralidhar, M.; Jirsa, M.; Sakai, N.; & Murakami, M. (2001). Optimization of Matrix
chemical ratio for high flux pinning in ternary (Nd-Eu-Gd)Ba
2
Cu
3
O
y
, Appl. Phys.
Lett., Vol.79, No.19, (3107-3109).
Muralidhar, M.; Wu, Y.; Sakai, N.; Murakami, M.; Jirsa, M.; Nishizaki, T.; & Kobayashi, N.
(2002a). Excess of Eu in the (Nd
0.33
Eu
0.66-x
Gd
x
)Ba
2
Cu
3
O
y
system-the way to high
irreversibility field at 77 K, Supercond. Sci. Technol., Vol. 15, No. 9, (1357-1363).
Nanoscale Pinning in the LRE-123 System -
the Way to Applications up to Liquid Oxygen Temperature and High Magnetic Fields
227
Muralidhar, M.; Nariki, M.; Jirsa, M.; Wu, Y.; & Murakami, M. (2002b). Strong pinning in
ternary (Nd-Sm-Gd)Ba
2
Cu
3
O
y
superconductors, Appl. Phys. Lett., Vol. 80, No. 6,
(1016-1018).
Muralidhar, M.; Sakai, N.; Chikumoto, N.; Jirsa, M.; Machi, T.; Wu, Y.; & Murakami, M.
(2002c). New type of vortex pinning structure effective at very high magnetic fields,
Phys. Rev. Lett., Vol.89, No.23, (237001-1-237001-4)
Muralidhar, M.; Sakai, N.; Nishiyama, T.; Jirsa, M.; Machi, T.; & Murakami, M. (2003a). The
pinning characteristics in chemically modified (Nd,Eu,Gd)-Ba-Cu-O
superconductors, Appl. Phys. Lett., Vol. 82 , No. 6, (943-945).
Muralidhar, M.; Sakai, N.; Jirsa, M.; Murakami, M.; & Koshizuka, N. (2003b). Levitation of
NEG-123 at the temperature of liquid oxygen (90.2K), Supercond. Sci. Technol., Vol.
16, No. 11, (L46-L48).
Muralidhar, M.; Sakai, N.; Jirsa, M.; Koshizuka, N.; & Murakami, M. (2003c). Vertex pinning
by mesoscopic defects – a way to levitation at liquid oxygen, Appl. Phys. Lett., Vol.
83, No. 24, (5005-5007).
Muralidhar, M.; Sakai, N.; Jirsa, M.; Koshizuka, N.; & Murakami, M. (2004a). Direct
observation and analysis of nanoscale precipitates in (Sm,Eu,Gd)Ba
2
Cu
3
O
y
, Appl.
Phys. Lett., Vol. 85, No. 16, (3504-3506).
Muralidhar, M.; Sakai, N.; Jirsa, M.; Murakami, M.; & Koshizuka, N. (2004b). Pinning centers
in NEG-123 active at liquid oxygen temperature (90.2 K), Supercond. Sci. Technol.,
Vol. 17, No. 2, S66-S69.
Muralidhar, M.; Sakai, N.; Jirsa, M.; Murakami, M.; & Koshizuka, N. (2004c). Effect of
nanoscopic ZrO
2
particles on flux pinning in (Nd,Eu,Gd)-123/Gd-211 composites,
Supercond. Sci. Technol., Vol.17, (1129-1132).
Muralidhar, M.; Sakai, N.; Jirsa, M.; Machi, T.; & Murakami, M. (2008a). Levitation at 90.2 K
and its applications, International Journal of Condensed Matter, Vol.6, (269-292).
Muralidhar, M.; Sakai, N.; Jirsa, M.; Murakami, M.; & Hirabayashi, I. (2008b). Highly
enhanced flux pinning in melt-textured NEG-123 doped Nb and Mo nano partices,
Appl. Phys. Lett., Vol. 92, Issue 16, (162512-3p).
Muralidhar, M.; Tomita, M.; Jirsa, M.; Sakai, N.; Murakami, M.; & Hirabayashi, I. (2009).
Observation of record flux pinning in melt-textured NEG-123 superconductor
doped by Nb, Mo, and Ti nano particles, Physica C, Vol.469, (1196-1199).
Okura, K.; Ohmatsu, K.; Takei, H.; Hitotsuyanagi, H.; & Nakahara, T. (1988).
Superconductivity of Ba
2
Y(Cu, Ti)
3
O
y
oxide, Jpn. J. Appl. Phys. Vol. 27, No. 4,
(L655-L657).
Osabe, G.; Yoo, S. I.; Sakai, N.; Higuchi, T.; Takizawa, T.; Yasohama K.; & Murakami, M.
(2000). Confirmation of Ba-rich Nd
1+x
Ba
2-x
Cu
3
O
7-δ
solid solutions Supercond. Sci.
Technol. Vol. 13, No. 6, (637-640).
Pradhan, A. K.; Muralidhar, M.; Feng, Y.; Shibata, S.; Murakami, M.; Nakao, K.; &
Koshizuka, N. (2001). Flux pinning in melt-processed ternary (Nd-Eu-Gd) and Nd-
based superconductors, IEEE Appl. Supercond. Vol. 11, No. 1, (3706-3711).
Salama, K.; & Lee, F. D. (1994). Progress in melt texturing of YBa
2
Cu
3
O
x
superconductor,
Supercond. Sci. Technol. Vol.7, No. 4, (177-193).
Sandiumenge, F.; Martinez, B.; & Obradors, X. (1997). Tailoring of microstructure and
critical current in directionally solidified YBa
2
Cu
3
O
7-x
, Supercond. Sci. Technol., Vol.
10, No. 7A, (A93-A119).
Superconductor
228
Sauerzopf, F. M.; Wiesinger, H. P.; Weber, H. W.; Crabtree, G.W. (1995). Analysis of pinning
effectrs in Yba
2
Cu
3
O
y
single crystals after fast neutron irradiation, Phys. Rev. B. Vol.
51, (6002-6012).
Sauerzopf, F. M. (1998). Anisotropic flux pinning in single crystals: The influence of defect
size and density as determined from neutron irradiation, Phys. Rev. B, Vol. 57,
(10959-10971).
Shigemori, M.; Okabe, T.; Uchida, S.; Sugioka, T.; Shimoyama, J.; Horii, S.; & Kishio, K.
(2004). Enhanced flux pinning properties of Bi(Pb)2212 single crystals, Physica C,
Vol. 408-412, (40-45).
Shimoyama, J.; Maruyama, T.; Shigemori, M.; Uchida, S.; Yamamoto, A.; Katsura, Y.; Hori,
S.; & Kishio, K. (2005). Generic positive effects of low level impurity doping on flux
pinning properties of HTSC and MgB
2
, IEEE Trans. Appl. Supercond. Vol. 15, (3778-
3781).
Ting, W.; Egi, T.; Kurada, K.; Koshizuka, K.; & Tanaka, S. (1997). Evidence of a new
magnetic flux pining center in Nd
1
Ba
2
Cu
3
O
y
single crystals. Appl. Phys. Lett., Vol.
70, Issue 6, (770-772).
Tomita, M.; & Murakami, M. (2003). High-temperature superconductor bulk magnets that
can trap magnetic fields of over 17 tesla at 29 K, Nature. Vol. 421, (517-520).
Umezawa, A.; Crabtree, G. W.; Liu, J. Z.; Weber, H. W.; Kwok, W. K.; Nunez, L. H.; Moran,
T. J.; Sowers, C. H.; & Claus, H. F. (1997). Enhanced critical currents due to fast
neutron irradiation in single crystal YBa
2
Cu
3
O
7-d
. Phys. Rev. B. Vol.36, (7151-7154).
Vipulanandan, C,; & Salib, S. (1994). Mechanical and Physical properties of sintered YBCO
melt bulk composites with silver powder and fibres, J. Mat. Sci., Vol. 30, (763-769).
Venkataramani, N.; Muraleedharan, K.; Datta, A.; Bhatia, S. N.; Prakash, O.M.; & Srivastava,
C. M. (1988). Effect of Zr, Ti, substitutions on T
c
in superconducting YBa
2
Cu
3
O
7-δ
system, Pramana J.Phys.Vol. 30, (L455-L457).
Wu, M. K.; Ashburn, J. R.; Torng, C. J.; Hor, P. H.; Meng, R. L ; Gao, L.; Huang, Z. J.; Wang,
Y.Q.; & Chu, C. W. (1987). Superconductivity at 93 K in a new mixed-phase Y-Ba-
Cu-O compound system at ambient pressure, Phys. Rev. Lett., Vol. 58, (908-910).
Welp, U.; Kwok, W. K.; Crabtree, G. W.; Vandervoort, K. G.; & Liu, J. Z. (1989). Magnetic
measurements of the upper critical field of YBa
2
Cu
3
O
7-δ
single crystals, Phys. Rev.
Lett., Vol. 62, (1908-1911).
Werner, M.; Sauerzopf, F.M.; Weber, H. W.; & Wisniewski, A. (2000). Fishtail effect in the
magnetization of superconducting RBBa
2
Cu
3
O
7-d
(R= Y,Nd,Yb) and YBa
4
Cu
8
O
16
single crystals, Phys. Rev. B. Vol. 61, (14795-14803).
Yoo, S. I.; Sakai, N.; Takaichi, H.; & Murakami, M. (1994). Melt processing for obtaining
NdBa
2
Cu
3
O
y
superconductors with high T
c
and large J
c
, Appl. Phys. Lett. Vol. 65,
(633-635).
Yanmaz, E.; Bali, B., & Kucukometoglu, T. (2002).Magnetic properties of melt textured
YBa
2
Cu
3
O
7-δ
with TiO
2
dopent, Materials Lett., Vol. 54, No. 2, (191-199).
Yamada, T.; Ikuta, H.; Yoshikawa, M.; Yanagi, Y.; Itoh, Y.; & Mizutani, U. (2003). Field
trapping capability of melt processed (Nd-Eu-Gd)-Ba-Cu-O bulk superconductors,
Physica C, Vol. 392-396, (623-627).
Zablotskii, V.; Jirsa, M.; & Petrenko, P. (2002). Vortex pinning by large normal particles in
high T
c
superconductors, Phys. Rev. B. Vol. 65, (224508, 4p).
11
X-ray Micro-Tomography as a
New and Powerful Tool for
Characterization of MgB
2
Superconductor
Gheorghe Aldica
1
, Ion Tiseanu
2
, Petre Badica
1
,
Teddy Craciunescu
2
and Mattew Rindfleisch
3
1
National Institute of Materials Physics, Magurele, Ilfov, 077125
2
National Institute for Lasers, Plasma and Radiation Physics, Magurele, Ilfov, 077125
3
Hyper Tech Research, Inc. Troy, OH 45373
1,2
Romania
3
USA
1. Introduction
Applied superconductivity is virtually important for all human activities solving different
problems in the fields such as power and energy, electronics, computing and
communications, medical equipment and sensors, fast transportation and so on. However,
the progress in this field is relatively slow when compared to other young industries. The
reasons are diverse, and among them are the prohibitive prices vs. performance of the
superconducting technologies. In this regard, superconducting-based materials or products
with improved working characteristics at constant or lower prices are always of interest.
One superconductor of practical interest is MgB
2
. This superconductor has several
advantages as follows:
1. Critical temperature T
c
= 39 K of MgB
2
[1] is the highest among simple superconducting
compounds. This is a unexpectedly high T
c
and, although MgB
2
can be considered a s-
wave classical Bardeen-Cooper-Schriffer (BCS) superconductor, it shows elements of
unconventional superconductivity: two-gap superconductivity was observed with gap
values of Δ
σ
= 7.4 meV and Δ
π
= 2.1 meV at 4.2 K corresponding to critical temperatures
of 15 K and 45 K, with σ and π being the bands of the boron electrons [2]. In fact, there
are two hole-type quasi-two-dimensional σ bands (σ1 and σ2), an electron-type (π 1)
and a hole-type (π 2) three-dimensional π bands [3,4]. Such situation generates new
physical effects with markedly different behaviors in many properties some of them of
practical meaning when compared with single band superconductors.
2. It is a simple compound composed of only two elements.
3. It is a cheap compound composed of relatively cheap and available elements.
4. It is not toxic and it is considered stable in the air.
5. It is a light compound with low theoretical density of 2.63 g/cm
3
. Crystal structure is
relatively simple of layered hexagonal type.
6. It has anisotropy, but it is not as high as in high temperature superconductors.
Superconductor
230
7. Ginzburg-Landau coherence length along the ab-plane is ξ
ab
= 10 nm, while along c-axis
is ξ
c
= 5 nm [5]. These values are significantly higher than for the HTS resulting in
transparent grain boundaries for the supercurrent passing. Moreover, grain boundaries
are recognized to act as strong pinning centers in this superconductor enhancing critical
current in high magnetic fields.
8. MgB
2
has in dirty C-alloyed MgB
2
thin films H
c2
and J
c
above the values for the practical
superconductors Nb
3
Sn and NbTi.
9. Films of MgB
2
were shown to grow on single crystal substrates, but also on metallic
ones, e.g. on stainless steel [6 and therein refs]. This is important for fabrication of
coated conductors.
Despite significant advantages, MgB
2
has several problems in the growth and properties
control. Among them we shall mention the fact that Mg is a highly volatile element. High
volatility of Mg, according to general ceramic principles does not allow synthesis of high-
density bulks. This is a serious and difficult-to-remove limitation and, as a consequence, it
requires much effort to improve connectivity, to produce a high-density uniformity and
finally to improve critical current density J
c
, that is the key parameter for applications of
superconductors. Challenging difficulties are amplified because microscopy techniques such
as optical microscopy or SEM, in many cases, cannot provide useful information on specifics
of the MgB
2
nanostructure, on local density, local density distribution and connectivity,
while TEM is very local and is applied to few selected regions. It is important to mention in
this context that most of the practical MgB
2
samples are composed of nanoparticles usually
less than 20-30 nm. The requirement of nanostructuring in MgB
2
is due to point 7, above
introduced: smaller grain in the material means more grain boundaries with a positive effect
on pinning increase, and, hence, on J
c
enhancement. Another limitation is that typical
microscopy techniques are not suitable for 3D observations. On the other hand, 3D
observations are extremely useful in analysis of composite complex 3D objects such as wires,
tapes, cables, joints, coils and so on of superconductors and in particular of MgB
2
. X-ray
microtomography as it will be shown in this chapter can fill the gap and solve some of the
presented problems, bringing new and very useful information about MgB
2
. At the same
time X-ray microtomography cannot replace existing microscopy techniques.
2. Principles of X-ray micro-tomography method
Computed tomography (CT) is widely used in the medical community and is receiving
increased attention from industrial users including electronics, aviation, advanced materials
research, casting and other manufacturing. Computed tomography systems are usually
configured to take many views of the object in order to build a 3-D model of its internal
structure. 2-D slices through this volume can be viewed as images, or the 3-D volume may
be rendered, sliced, thresholded and measured directly. Amplitudes of the volume elements
(or voxels) are proportional to the X-ray linear attenuation of the material at that position
and are therefore dependent only on material properties and not on the shape of the object
as in case of plain radiography.
The principle of most common transmission tomography configurations is depicted in Fig 1.
Traditionally, volumetric image reconstruction is achieved through scanning a series of
cross-sections (slices) with a fan-shaped X-ray beam, and by stacking these slices. Recently,
with the introduction of planar detectors, computed tomography began a transition from
fan-beam to cone-beam geometry. In cone-beam geometry the entire object is irradiated with
X-ray Micro-Tomography as a New and Powerful Tool for Characterization of MgB
2
Superconductor
231
a point-shaped X-ray source, and the radiation attenuation is measured on a detector plane
behind the object. The primary advantages of cone-beam geometry include reduced data
acquisition time, improved image resolution, and optimized photon utilization. Cone-beam
X-ray microtomography is used in this work to characterize MgB
2
superconducting objects.
Fig. 1. Fan beam (left) versus cone beam (right) tomography configurations.
Despite progress in exact cone-beam reconstruction, approximate cone-beam reconstruction
remains the 3-D CT main solution, especially in the cases of incomplete scanning and partial
detection. Furthermore, approximate reconstruction is usually associated with higher
computational efficiency, and may produce less image noise and ringing. The Feldkamp
(FDK) cone-beam algorithm [7], which is an ingenious adaptation of the weighted filtered
backprojection algorithm for equispatial rays, represents the most reliable approach for
solving the cone-beam reconstruction problem. The unknown distribution function at
position (t,s,z) is given by:
()
2
2
2
222
0
1
(,, ) ( , )
2
SO SO SO
SO
SO
SO
DDtD
f
tsz P YZh Y d dY
Ds
Ds
DYZ
π
β
β
∞
−∞
⎛⎞
=−
⎜⎟
−
−
++
⎝⎠
∫∫
where:
cos sintx y
β
β
=+, sin cossx y
β
β
=
−+ , (Y, Z) are the detector pixel coordinates in
a plane translated such that the q-axis is superimposed on the z-axis (Fig. 2).
The cone beam reconstruction algorithm can be conveniently broken into the following
steps:
1.
Weighting projections: multiply projection data, P
β
(Y,Z), by the function
Dso/(Dso
2
+Y
2
+Z
3
) to find the weighted projections.
2.
Filtering projections: convolute the weighted projection with the ramp filter h by
multiplying their Fourier transforms with respect to Y. Note this convolution is done
independently for each elevation Z.
3.
Backprojection: each filtered weighted projection is backprojected over the three-
dimensional reconstruction grid. The two arguments of the weighted projection
represent the transformation of a point in the object volume into the coordinate system
of the tilted fan.
The FDK algorithm is highly parallelizable and hardware supported. The FDK is an
approximate method because only those points of the object that are illuminated from all
directions can be properly reconstructed. In a cone-beam system this region is a sphere of
radius
()
sin
SO m
D Γ
where
Γ
m
is half the horizontal cone angle. Outside this region a point
Superconductor
232
will not be included in some of the projections and thus will not be correctly reconstructed.
The main limitation occurs at relatively large cone angles.
Fig. 2. Feldkamp algorithm cone-beam geometry
Oxyz - reconstruction coordinate system; sample rotates around z-axis
Dpq - planar detector coordinate system
SO - source-object distance
SD - source-detector distance
β - angle of rotation of sample (equivalent picture – angle of synchronous rotation of
source-detector assembly )
The application of X-ray tomography for non-destructive analysis of superconducting
materials was recently reported. Synchrotron tomography [8-9], but also micro-tomography
based on conventional X-ray tubes [10, 11] proved to provide useful information on the
internal structure of superconducting materials. X-ray micro-tomography (XRT) was
initially used and tested to reveal in a non-invasive and convenient way [11], the
architecture of the superconducting composite wires. The method can also reveal at macro
local scale the occurrence, distribution and shape of the regions with a different density [12].
The results presented here were obtained using a high resolution X-ray micro-tomography
facility constructed at NILPRP Bucharest, Romania with European Community support. The
main component is an open type microfocus X-ray source (W target, maximum high voltage
of 160 kVp at 20 W maximum power). X-rays are detected by means of a high-resolution
image intensifier (Siemens Medical Solutions) or an amorphous silicon flat panel sensor
(Hamamatsu). The detection system is placed on a precise motorized stage (Sigma-Koki)
additionally provided with vertical and transversal adjustable tables. The investigated
sample is placed on a four axes motorized manipulator to assure a high degree of freedom
in accurate sample positioning. The micro-radiography analysis is guaranteed for feature
recognition down to 1 micron. Due to the ability to work with magnifications over 1000, it
has been demonstrated that for miniaturized samples the micro-tomography analysis is
valid for feature recognition down to few microns. The 3D tomographic image
X-ray Micro-Tomography as a New and Powerful Tool for Characterization of MgB
2
Superconductor
233
reconstructions are obtained by a proprietary highly optimized computer code based on a
modified Feldkamp algorithm.
The reconstruction software also incorporates efficient techniques for beam hardening
reduction and ring artifacts elimination. Beam hardening effects are the main challenge for
the application of the microtomography technique to the analysis of high density metallic
samples. Beam hardening artifact consists of an elevated density displayed on the perimeter
of a uniform density object and a corresponding density depression in the object’s core
region. It is caused by the polychromatic structure of the energy spectrum of the X-ray
generators. Several experimental techniques have been reported for beam-hardening
correction [13-15]. However, the optimization of the tomographic measurement by
experimental selection of a large set of parameters is a very laborious procedure and the
result is not always guaranteed. Therefore, in our approach [15], a numerical simulation
procedure-time-independent multimaterial and multidimensional-coupled electron/photon
Monte Carlo transport - was developed. Any important element, such as: target material,
pre and post-filters and X-ray energy spectra have been studied. The optimisation procedure
requires pre-filtering the X-ray beam for narrowing the energy spectra, at the same time
monitoring the spectra evolution into the probe structure for maximum absorption contrast.
High performance microtomography on fusion material samples of advanced steel alloys
would require, in addition to beam parameters optimization, the application of active
methods of beam hardening reduction. This means the determination of the non-linear
dependence between investigated object thickness and log ratio of intensities in the
radiographic views, followed by the corresponding processing of the radiographic data.
Obviously, determination of the non-linearity of the line integrals by accurate Monte Carlo
simulation instead of laborious experiments is always desirable. Reducing beam hardening
effects means, consequently, reducing the need for employing highly sophisticated post-
processing methods.
3. Application of XRT on MgB
2
superconductors
3.1 MgB
2
synthesis using mechanical alloying method and X-ray microtomography
observations
First attemps to apply X-ray microtomography were performed on MgB
2
ceramic obtained
by conventional solid state reaction between powder of boron and magnesium. Mixtures of
Mg (99.5%, 45 μm), B (0.85 μm, amorphous, 95% purity and impurities are: 3% Mg, 0.5%
water soluble, 1% insoluble in H
2
O
2
and 0.5% moisture) and SiC (99.3%, 20 nm) powders
with composition (Mg + 2B)
0.95
(SiC)
0.05
were prepared by hand mixing under Ar (glove-box)
and by mechanical milling in a planetary ball mill (Fritsch P7, Cr-steel pot and 20 balls of 7
mm diameter; composition of the Cr-steel used for the pot and balls is: 85.3%Fe, 12%Cr,
2.1%C, 0.3%Si, 0.3Mn) [16, 17]. Mechanical milling was done for 0.5, 1, and 3 h at 400 rpm
under Ar gas introduced into an evacuated milling pot. As-prepared powders, after
pressing into pellets, were heat treated in Ar using a tube furnace with a quartz tube. Pellets
were wrapped into Mo and Zr-foils together with chunks of Mg to prevent significant
evaporation of this element from the samples during heating. Samples and processing
conditions are gathered in Table. 1.
Samples were characterized by x-ray diffraction (PANalytical, CuKα radiation) and SEM
(JEOL JSM 6400F). Measurements of M-H loops at 4.2 K and 20 K were conducted using a
Superconductor
234
SQUID magnetometer (Quantum Design, 5T). Same equipment was used to determine
critical temperature, T
c
taken as the onset of the diamagnetic signal in the zero-field-cooled
M(T) curves measured for a dc magnetic field of 20 Oe. X-ray microtomography
measurements were performed as presented in second part of this section.
Sample Mixing/milling
Heat treatment
temp. (°C)
Heat treatment time
(h)
A Manual in Ar 700 1h
B Mechanical milling in Ar, 0.5h 700 1h
C Mechanical milling in Ar, 1h 700 1h
D Mechanical milling in Ar, 3h 700 1h
Tape Powder in tube MgB
2
tape [18] 750 1h
Table 1. Samples and processing conditions
SEM images (not presented) taken on the A-D Ar-as-milled (un-reacted) powders consist of
large agglomerates up to 30-50 μm and no other significant differences can be observed. On
the other hand, XRD patterns for the same precursor powders A-D show that enhancement
of milling time produces patterns with Mg diffraction-lines of lower intensity and larger full
width at half maximum (FWHM). For A-D mixtures FWHM was estimated at 0.16, 0.23, 0.25
and 0.27°, respectively. The result suggests occurrence of smaller particles with a lower
degree of crystal perfection for Mg vs. milling time. A relatively short milling time leads to a
relatively fast decrease of the intensity and a fast increase of FWHM, while for longer
milling time variation of the intensity and of FWHM is slower. B cannot be observed in the
XRD patterns since this element was used in the amorphous state.
Fig. 3. SEM images for the reacted B-D samples. Sample notation is the same as in Table 1.
Bulk samples prepared from the powders A-D for the same heat treatment conditions are
showing roughly very similar XRD and SEM (Fig. 3) results with some small differences. In
the XRD the crystal quality is decreasing with the milling time, but the ratio between
different phases is approximately constant. Low level of MgB
4
in the samples indicates that
Mg-losses during heat treatment are relatively low, while the decrease in a-axis of the MgB
2
(from 0.3084 to 0.3074 nm) with the increase in the milling time (from 0 to 3 h, respectively)
of the precursor mixtures suggests introduction into the lattice of MgB
2
of C coming from
the milling pot and balls.
SEM images (Fig. 3) on the reacted B-D samples are showing small grains and agglomerates
of 1-3 μm. The appearance is of a glassy bulk where the grains cannot be easily observed,
and the connectivity between the grains is likely decreasing from sample A to D. The
X-ray Micro-Tomography as a New and Powerful Tool for Characterization of MgB
2
Superconductor
235
decrease of the connectivity and the decrease of the crystal quality can be the reasons for the
decrease of the superconducting properties. Carbon presence should be also considered and
it is probably the main reason for the observed decrease of the critical temperature (37.4,
34.8, 32.2 and 32 K for A-D samples, respectively). The presence of other impurities is also of
interest and some aspects are addressed in the next paragraphs. The decrease in T
c
with the
milling time is accompanied by the decrease in the magnetization loop width, ΔM, which is
proportional to J
c
through the Bean formula [19] (Fig. 4).
Our results indicate that milling and milling time are important and are producing different
states for Mg and a different level of carbon in the precursor. This likely influences the
further growth processes leading to a different quality of the MgB
2
samples. Changes in the
superconducting properties are logically correlated with the changes observed in SEM and
XRD data, but the details are missing and the mechanism and the key factors controlling this
relationship cannot be satisfactorily revealed. It is also questionable if this is the full picture
and one problem is that the changes in the T
c
and J
c
are significant, while in the XRD and
SEM are much lower. This discrepancy leads to the idea that XRD and SEM are not sensitive
enough or are not the most appropriate to reveal the differences. Complementary
techniques to check and expand the available data are needed.
10
0
10
1
10
2
10
3
10
4
0 1 2 3 4 5
open symbols - measured at 4.2 K
filled symbols - measured at 20 K
D
C
B
A
D
C
B
A
B (T)
J
c
(A/cm
2
)
Fig. 4. Magnetization loop width (proportional to J
c
) for the samples A-D at 4.2 K and 20 K.
X-ray microtomography (XRT) was applied for characterization of the reacted bulk samples
AD (Fig. 5). This technique can display images of microstructure in the sense that the dark
regions are of low density. Pores in the material will be black and they will have the shape
and size as visualized through microscopy. Grains will have in the XRT images different
gray tones and the whiter they are the higher density they have. What is remarkable
about this technique is that, in fact, we do not depend on the clear observation of the grains
to construct a 3D image showing macroscopic regions of the material with a different
density.
Superconductor
236
Fig. 5. Representative XRT images of the heat treated bulk samples A-D (Table 1). Images
were taken for a voltage of 40 kV and a current of 100 μA. Scale bar is 100 μm.
This is advantageous because even a relatively low XRT resolution (of few μm in our case)
when compared to SEM or TEM and when measuring materials composed of small-size
grains (for our samples less than 50-100 nm and significantly less than the XRT resolution),
can reveal useful information on local density distribution and uniformity or on the shapes,
packing and alignment of the regions and/or pores of the size larger than the resolution.
Further development of the technique and improvement of the resolution is expected to
show more details inside the macroscopic regions and also to identify the phases based on
their density. One interesting aspect related to the last part of the previous statement is that
our MgB
2
samples contain a relatively low level of impurities. By XRD the impurities in the
reacted A-D samples were Mg
2
Si, MgO, MgB
4
and some unreacted Mg. The densities, d, of
different phases in the material and of the raw materials are: d
SiC
= 3.22 g/cm
3
, d
C-graphite or
amorphous
=1.8-2.3 g/cm
3
, d
Mg
= 1.738 g/cm
3
, d
B-amorphous or crystalline
= 1.74-2.44 g/cm
3
, d
MgB2
=
2.63 g/cm
3
, d
MgO
= 3.58 g/cm
3
, d
Mg2Si
= 2.56 g/cm
3
and d
MgB4
= 2.50 g/cm
3
. The highest
density is for MgO or SiC. The two phases should have the whitest colour on the XRT
images. The amount of the XRT white regions in the A-D superconducting samples is much
larger than a few percent of residual MgO or SiC phases estimated from XRD. Hence, the
white regions in the XRT images do not reflect a certain phase and mainly show regions
with a very different local density. However, contribution of a certain phase to the colour
nuance of a region cannot be totally excluded. It is also necessary to discuss some other
issues related to the limitations of different measurement techniques. It is generally
recognized that solid and liquid phases are present during the reaction to form MgB
2
.
AB
C
D
X-ray Micro-Tomography as a New and Powerful Tool for Characterization of MgB
2
Superconductor
237
Hence, glassy phases, phases with poor crystal quality or nanoscale grains can easily occur
and can be hardly detected by XRD leading to underestimated values of the impurity-
phases amounts. Following the same idea, a special attention deserves MgO or more general
the presence of oxygen in the material. Sometimes, a fine mixture of MgB
2
with oxygen is
mentioned (more often for thin films), and even by high resolution techniques such as TEM
it is very difficult to observe grains of MgB
2
and MgO and to make a separation between
them. Since the role and behaviour of the oxygen in MgB
2
is not clear and also considering
the above limitations from the different measuring techniques it is wise to keep in mind the
oxygen impurification during milling and the following scenario can be imagined: with the
increase in the milling time, the amount of oxygen impurification in the precursor powders
may increase. This might be related to the behaviour of Mg and its reactivity influenced by
the milling conditions. It is thought that longer milling time, generating lower Mg crystal
quality and smaller grains, leads to more reactive powders including with residual oxygen.
It is noteworthy that, during milling, other processes relevant for the XRT images may take
place such as the transfer of the material from the milling-pot-walls and balls into the
precursor powder. Impurities are also present in the raw materials, especially in the boron
amorphous raw powder of relatively low purity. Milling can change their behaviour so that
they can influence processes. However, EDS and XRD investigations could not detect
impurity elements (except the presence of C entering the lattice of the MgB
2
phase) or
phases (such as Fe
2
B) in the MgB
2
final bulk meaning that, if they are present, these elements
are below the detection limit of these techniques. From XRT point of view changes in the
particle size and particle size distribution can influence agglomeration and rheological
properties of the powder mixtures so that packing and density distribution in the bulk can
be very different.
Although, at present, it is not possible to significantly advance the understanding of the
milling-properties relationship, XRT can reveal clear differences between the samples and
the details are addressed in the next paragraphs.
For the reacted samples milled in Ar-atmosphere (Fig. 5), XRT microstructure is changing
from a vermicular in A to a layered structure with long oriented pores in B (up to 50 μm in
length), to a relatively uniform distribution of the regions of higher and lower density and
containing many small pores as well as few large pores of irregular shape in sample C.
Finally, a ‘leopard’-3D-spot-like structure is observed for the sample D. The white ‘spots’ of
the high density material in this sample are of regular sphere- and ellipsoidal- like or of the
irregular shape. One can appreciate from the Fig. 5 that the amount of the brighter regions is
likely to enhance from A to D and, hence, the amount of the high density regions in the
material is enhancing. At the same time the homogeneity of the samples is getting lower.
Furthermore, the tendency of the XRT patterns is likely preserved for the case when
precursor powders are milled in H
2
atmosphere [12], but the evolution of the XRT
microstructure towards the ‘leopard’-like structure is slower. This might be because Ar is an
inert atmosphere while H
2
is a highly reducing one, so that the reacted samples in the same
conditions may contain different amounts of the residual oxygen, as it was discussed above.
3.2 Observation of MgB
2
tapes and wires by XRT
Powder-in-tube fabrication of the tape observed by X-ray microtomography was reported in
[18].
XRT structure of the tape can be visualized in (Fig. 6). Tape shows relatively uniform XRT
microstructure, when compared with the patterns taken on bulk samples A-D (Section 3.1),
Superconductor
238
but one can easily observe regions with different nuances of gray. There are regions in the
center of the MgB
2
core from the tape that are darker (e.g. see Fig. 6c) suggesting a lower
density, and meaning, from a practical point of view, that that there is room for
improvements even for tapes with record high level of J
c
in high magnetic fields [18] as
measured in this tape investigated here by XRT.
Fig. 6. 3D XRT image reconstruction of an MgB
2
tape (S = metal sheath) and representative
images of the (a)- axial, (b)-sagital and (c)-frontal (from left to right) sections. The cross
identifies the same point in all images. Images were taken for a voltage of 60 kV and a
current of 80 μA.
Apart from the local density information, 3D images and selected sections can also give
valuable information on the architecture and geometrical perfection of the composite tapes
or wires as well as on some macro defects such as cracks and pores.
3D visualisation is particularly important for complex multifilamentary MgB
2
wires. This is
because for real applications (e.g. fabrication of the superconducting coils) wires are more
suitable than tapes. This situation, and the necessity to test the 3D geometrical quality and
defects of the wires for their further improvement and for development of new types of
wires, motivated us to apply XRT visualization to commercial wires produced by
HyperTech Inc, US. These round-shape wires of MgB
2
were produced by Hypertech Inc. by
continuous tube forming and filling process [20].
The significant advantage of XRT in the case of wires is that it works on extended 3D
volumes vs. 2D SEM or optical microscopy. The 3D reconstructed images can reveal hidden
defects that can easily go unnoticed with traditional microscopy methods. For example, in
Fig. 7, from the SEM images taken in SE and BSE regimes on a HyperTech wire with 7 sub-
elements, one can observe regions with possible defects. The nature, shape and, hence,
importance of such defects cannot be assesed from the 2D images. At the same time, 3D
navigation (Fig. 8 left) inside the same wire shows macrodefects. In particular, defects of
interruption of the Nb barrier material or voids are clearly visible. Similar 3D defects were
visualised for another HyperTech wire with 18 sub-elements (Fig. 8 right). Macrodefects,
such as e.g. voids, can have extended, irregular shape and, not rarely, a hidden part. It
X-ray Micro-Tomography as a New and Powerful Tool for Characterization of MgB
2
Superconductor
239
means that XRT is valuable not only because it is possible to detect the defect in a highly
reliable way, but it can reveal their 3D shape details.
Fig. 7. SEM images of the polished Hypertech MgB
2
wires (7 sub elements): upper panels –
transversal SE and BSE modes; bottom panels - longitudinal SE and BSE modes. Defects are
identified by the circles. The outer diameter of the wire is 0.83 mm.
It is expected that different architecture of the wires will result in different non-uniformities
leading to different overall quality. Non-uniformity is expressed in uniformity of the phase
quality (crystal, morphological, structural defects, impurities, grain boundaries) density
distribution quality (variation of the local density as discussed for tapes), geometrical
perfection. It is a complex system and indicated parameters are not independent.
Architecture of the wire vs. processing should be investigated and optimized. XRT can help
in understanding the geometrical quality of a sample produced by different technological
conditions or it allows comparative analysis between different wires for the same
technology. For example, the two wires already mentioned (Fig. 8 left and right colums)
from the geometrical perfection viewpoint, even in the absence of the macrodefects are very
Superconductor
240
different. For each wire there is a difference in the quality of the superconducting sub-
elements if the sub-element is located in the outer or inner part of the wire. Namely,
interface roughness (R) between Nb and MgB
2
sub-element for the inner sub-elements is
higher, while cylinder-shape perfection (CSP) is worse for the same sub-elements.
Furthermore, this difference between inner and outer sub-elements is higher for the wire
with 18 than for the wire with 7 sub-elements. A closer look also suggests that the worst
quality from the R and CSP viewpoints is for the inner sub-elements from the wire with 18
sub-elements. These representative results show that XRT analysis can play an important
role in explaining the differences in superconducting properties of MgB
2
samples. However,
at present, the relationship between XRT and the superconducting properties of the wires is
not established and more research is required.
3.3 MgB
2
consolidation by Spark Plasma Sintering method and XRT observations
One promising method to obtain a dense MgB
2
superconductor is the Field Assisted
Sintering Technique (FAST), also known as Spark-Plasma-Sintering (SPS) that was
successfully used to consolidate different kinds of difficult-to-sinter powders [e.g. 21]. In
this technique, the sample is submitted to a pulsed electric field during the compression
process. Although the physics involved is not completely understood, this method provides
an excellent way to obtain high density MgB
2
[22-24], while preventing the increase of the
grain size. Both, high density and reduced grain size, as already noted above, are very
important features for maximization of the properties in MgB
2
. Also, doping with various
elements or compounds into MgB
2
has been found to enhance the critical current properties
[25-27]. In this respect, best results were obtained by using nano-SiC [28], SiC whiskers,
nanometer Si/N/C [29] and B
4
C [30], that showed a positive influence on irreversibility
field (H
irr
) and critical current density J
c
under magnetic fields. In this regard detailed study
of the XRT microstructure of MgB
2
samples is of interest.
Polycrystalline samples of MgB
2
(MB), C-doped MgB
2
(MBBC), and SiC-doped MgB
2
(MBSC) were prepared from commercially available powders of MgB
2
(2.3 μm, Alpha
Aesar), SiC (45 nm, Merck), and B
4
C (0.8 μm, HC Starck Grade HS). For each experiment
about 3 g of MgB
2
powder without or with doping compound was loaded into a graphite
die with 1.9 cm diameter punches. Prior to powder loading, MgB
2
and SiC or B
4
C were
mixed in a 0.95:0.05 molar ratio using a mortar and pestle in argon atmosphere for 30 min.
After loading the powder into the die (also in argon atmosphere), samples were processed
using a “Dr Sinter” (Sumitomo Coal Mining Co, Japan) sintering machine. Sintering was
performed in vacuum (6-15 Pa). The temperature was measured by a thermocouple (type K)
placed at half of the thickness of the die wall. A uniaxial pressure of 63 MPa was applied
during sintering for all samples. In the SPS apparatus, we used a default 12:2 (on:off) current
pulsed pattern. The waveform is not square and, in fact, is composed of several spikes
(pulses) separated by a current-free interval [31]. Regardless of the pattern, each pulse has
the same period of about 3
·10
-3
s. Thus, the pattern of 12:2 has a sequence of 12 pulses "on"
and 2 pulses with no current (off). The total time of one sequence (cycle) is about 0.04 s. The
operating voltage and the peak current were below 10 V and 1000 A, respectively.
The SPS-processed pellets have bulk densities (Table 2) above 90 % of the theoretical value
(2.63 g/cm
3
) [32, 33]. For 0.95MgB
2
+0.05B
4
C a smaller density is observed probably due to
the limited chemical reaction between two components, and to a lower sintering
temperature. Maximum sintering temperature was selected to be about 40-45 °C higher then
the temperature T
d
where sample’s densification starts.