The Discovery of Type II Superconductors Part 14 ppt
Bạn đang xem bản rút gọn của tài liệu. Xem và tải ngay bản đầy đủ của tài liệu tại đây (863.34 KB, 25 trang )
Superconductor
316
() ( ) ()
()
00
0cos
cos /
0
2
0
1
() lim
2
()
T
it i ix tt
ix t iEt
T
n
n
PE e e e e e dtdt
T
JxPEn
ϕϕ ω
ω
π
ω
∞
′
−+
′
−
→∞
−∞
∞
=−∞
′
=
=−
∫∫
∑
(6)
Here
P
0
(E) is the spectral function in absence of the microwave influence, and satisfies the
detailed balance
(
)
00
()exp ()
B
PE EkTPE−= − , a consequence of thermal equilibrium. We
note that equation (6) is an expression of multiple photon absorption and emission with the
amplitude of Bessel function
J
n
(x).
01234
0.00
0.05
0.10
0.15
0.20
0.25
0.30
0.35
0.40
2.14G
1.90G
1.60G
0.94G
0.60G
R
0
(MΩ)
RF amplitude (arbitrary unit)
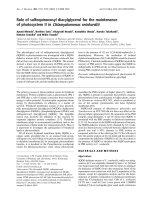
Fig. 4. The zero-bias resistance as a function of irradiating microwave (or RF) amplitude at
various frequencies. Here the resistances are shifted and the microwave amplitude is
rescaled to its period for each curve. The oscillation period is related to the superconducting
gap of the electrodes. Adopted from (Liou, Kuo et al. 2008)
Expression (6) gives a supercurrent
() ()
20
2
sns
n
IV J xI V n
e
ω
∞
=−∞
⎛⎞
=−
⎜⎟
⎝⎠
∑
. (7)
Here
0
()
s
IV is the Cooper-pair tunneling current in absence of the microwaves. When the
environmental impedance is much smaller than the quantum resistance, the spectral
function becomes Delta-function so as to yield a coherent supercurrent,
C
I at zero bias
voltage. In turn, the microwave-induced supercurrent becomes
(
)
(
)
2
sn Cn
IV IJ x= at a voltage
2
n
Vn
e
ω
=
, leading to the structure of Shapiro steps. Ideally, each step in IV curves
represents a constant-voltage state, labeled by
n, featuring a “coherent” charge tunneling
generated by the mode-locking. When the bias voltage is ramped, the junction would switch
Phase Dynamics of Superconducting Junctions
under Microwave Excitation in Phase Diffusive Regime
317
from one constant-voltage state to another, and eventually jumps to the finite-voltage state.
It is noteworthy that in the analogy of a driven pendulum described in the previous section,
the mode-locking should yield
()
()
sn Cn
IV IJ x=
, a different result from the incoherent
square dependence.
Dc Voltage (eV
dc
/2Δ)
0.0
1.0
2.0
0.5
1.5
RF amplitude (eV
ac
/2Δ)
0.0
1.0
2.0
0.5
1.5
2.0
-2.0
0.0
1.0
-1.0
2.0
-2.0
0.0
1.0
-1.0
0.0
1.0
0.5
2.0
-2.0
0.0
1.0
-1.0
(a)
(b)
(c)
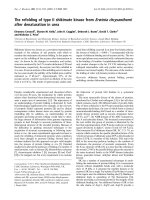
Fig. 5. The intensity plots of the dynamical conductance as a function of dc bias voltage
V
dc
and microwave amplitude
V
ac
of a long array(a) and a short array(c). According to the
model described in text, the conductance peaks evolve into a “mesh” structure with the
same period in
V
dc
and in V
ac
of 2Δ/e. Adopted from(Liou, Kuo et al. 2008)
When the microwave frequency
ω
is small, argument x and n large, the summation over n
can be replaced by an integration of
(
)
1
cosunx
−
= :
2
10
0
(2 ) ( cos )d
ssdcac
IIVVuu
π
π
−
=+
∫
. (8)
This expression is quite simple: It follows the same result as in the classical detector model.
We note that Eq. (8) gives a general description for mesoscopic charge tunneling processes
and should be applicable to both Cooper-pair tunneling and quasiparticle tunneling in the
superconductive junction system.
4. Bloch wave formalism
Previous results are classical in nature. In a quantum point of view, the phase is not a
function of time, but time-evolving quantum states. The un-biased single junction
Hamiltonian can be expressed by
2
0
4cos
CJ
HEnE
φ
=− . (9)
Here
n is the charge number, obeying the commutation relation
[
]
,ni
φ
=
. Because the
potential is periodic in
φ
, the wavefunctions have the form of Bloch waves in lattices:
Superconductor
318
(
)
(
)
,
ik
ks
ue
φ
φφ
Ψ=
In which
()
,ks
u
φ
is the envelope function for lattice momentum k and band index s. When
there is a bias, an interaction term
(
)
2
I
HeI
φ
=
is added to the Hamiltonian, rendering the
change of the lattice momentum and inter-band transitions.
2RC time
quasi -charge
0.0
0.5
-0.5
Δ
t=e/I
Fig. 6. The calculated diagonal elements of the single band density matrix for the junction
under a dc-current bias. The expectation value of the lattice momentum (also called quasi-
charge) linearly increases in time. This results in an oscillatory response with a period in
time of
e/I.
0.00.51.01.52.0
0
1
2
3
4
5
Current
Voltage
0.00.51.01.52.0
0
1
2
3
4
5
Current
Voltage
1
Q
RR
=
0.2
Q
RR=
5
Q
RR
=
(a)
(b)
Fig. 7. (a) The calculated current-voltage characteristics of a junction with different
dissipation strengths using the Bloch wave formalism. A Coulomb gap appears when the
dissipation which quantified as
Q
RRis weak, featuring a relative stable quasi-charge.
When the bias current is larger than
x
IeRC= , the quasi-charge starts to oscillate, turning
the
IV curve to a back-bending structure. (b) The IV curves of a R=R
Q
junction under the ac
driving of various amplitudes,
I
1
. In both figures the voltage is presented in unit of e/C
while the current is presented in unit of
e/R
Q
C.
Phase Dynamics of Superconducting Junctions
under Microwave Excitation in Phase Diffusive Regime
319
It has been shown that in quantum dissipative system, the effect of environment can be
introduced through a random bias and an effective damping to the system.(Weiss 2008)
These effects would be better considered by using the concept of density matrix,
ρ
in stead
of wavefunctions
(
)
φ
Ψ :
[]
,
i
H
t
ρ
ρ
∂
=
∂
.
Especially, when dropping the contributions from the off-diagonal elements, one can write
down the differential equations for the diagonal parts:
()
()()
{}
2
22
1
ZE ZE
ss s
B
ss ss ss s ss ss s
s
IkT
V
tekeRk
eR k
σσ σ
σ
σσ
′
′′′′
′
∂∂ ∂
∂
=− + + + −Γ+Γ +Γ+Γ
∂∂∂
∂
∑
(10)
Here
()
,skkss
k
σρ
=
denotes the diagonal element of the density matrix for quasi-momentum
k and band s. Also called master equation, expression (10) describes the time evolution of the
probability of state
,ks . The terms describe the effect of the external driving force, the
resistive force, the random force, and interband transitions due to Zener tunneling(
Z
ss
′
Γ -
terms) and energy relaxation(
E
ss
′
Γ
-terms). Also,
,
1
ks
s
E
V
ek
∂
=
∂
describes the dispersion relation
of the Bloch waves in band
s.
By calculate the time-evolution of the density matrix elements, one can obtain the
corresponding junction voltage
ss
s
VVdk
σ
=
∑
∫
under a driving current I, yielding a
comparison to the
IV measurement results(Watanabe & Haviland 2001; Corlevi, Guichard et
al. 2006). The most important feature of this approach is the Bloch oscillation under a
constant bias current,
22Ie
ω
π
=
as illustrated in Fig. 6. In the IV calculations, a Coulomb
gap appears when
1
Q
RR
<
, featuring a relative stable quasi-charge. When the bias current
is larger than
x
IeRC= , the driving force is large enough for the quasi-charge to oscillate.
The Bloch oscillation features a back-bending structure in the
IV curve which cannot be
explained by previous approaches(see Fig. 7 for calculation results and Fig. 8 for
experimental results).
When the junction is driven by the ac excitation, namely
(
)
01
cosIt I I t
ω
=+ , a mode-locking
phenomenon may be raised at specific dc current
22
n
Ine
ω
π
=
. This mode-locking can be
viewed as a counterpart of the Shapiro steps, which gives characteristic voltages
n
Vn eV
ω
= . The master equation approach, although more accurate than the classical
ways, involves complicate calculations so a numerical method is un-evitable.
5. Photon-assisted tunnelling
The method introduced in previous section is a perturbative approach which may not be
appropriate when the bias current is large. Alternatively, one may consider the eigen-energy
problem for a periodically driven system describe by the Hamiltonian:
Superconductor
320
(
)
0 I
HH Ht=+ ,
in which
2
0
4cos
CJ
HEnE
φ
=−
, and H
I
is a periodic function with frequency
ω
, satisfying
()
,
2
in t
IIIn
n
Ht Ht He
ω
π
ω
⎛⎞
+= =
⎜⎟
⎝⎠
∑
. Here
,In
H is the n-th Fourier component in the frequency
domain.
In general, it can be solved by applying the Floquet’s theorem, which is similar to the Bloch
theorem, in the following way:
()
i
Et
in t
n
n
tee
ω
ψ
−
Ψ=
∑
. (11)
The result can be viewed as a main level at energy E with sideband levels spaced by
ω
. To
determine the coefficients
Ψ
n
, one needs to solve the eigen equation:
0,nImnmn
m
HH E
ψ
ψψ
+
+=
∑
.
Fig. 8. The
IV curves of the single junction in tunable environment of different impedances.
From top left to bottom right, the environment impedance increases. Origin of each curve is
offset for clarity. Adopted from (Watanabe & Haviland 2001)
Tien and Goldon (Tien & Gordon 1963) gave an simple model to describe the charge
tunneling in the presence of microwaves. Suppose the ac driven force produces an ac
Phase Dynamics of Superconducting Junctions
under Microwave Excitation in Phase Diffusive Regime
321
modulation in the state energy that
0
cos
ac
EE eV t
ω
=
+ for an unperturbed wavefunction
0
ϕ
. Then the change in wavefunction is simply on the dynamical phase such that,
()
()
()
0
00
0
0
exp cos
t
ac
i
Et
in t
n
n
i
tEeVtdt
Jxe e
ω
ϕω
ϕ
−
⎡
⎤
′
′
Ψ= +
⎢
⎥
⎣
⎦
=
∫
∑
. (12)
Fig. 9. The energy levels generated according to Eq. (12) in the presence of a microwave
field. Adopted from (Tucker & Feldman 1985).
p
ω
1
Γ
2
Γ
Fig. 10. A schematic of the enhanced macroscopic quantum tunneling in a single Josephson
junction due to photon excitation. In each potential valley, the quantum states may form a
harmonic oscillator ladder with a spacing of
p
ω
. The absorption of photon energy may
lead to an inter-valley resonant tunneling Γ
1
, and a tunneling followed by an inner-valley
excitation,
Γ
2
. The enhancement in macroscopic quantum tunneling results in a reduction of
junction critical current.
Again
2
ac
xeV
ω
= as defined before. This expression is useful in the tunneling-
Hamiltonian formalism applicable to the high-impedance devices such as single electron
Superconductor
322
transistors and quantum dots. One may include additional tunneling events through the
side-band states with energies of
0
En
ω
±
, namely the photon-assisted tunneling(PAT).
The PAT is a simple way to probe the quantum levels in the junctions. For example, if the
Josephson coupling energy E
J
is relatively large, a single potential valley of the washboard
potential can be viewed as a parabolic one. In this case the system energy spectrum has a
structure of simple harmonic ladder as shown in Fig. 10. The microwave excitation enhances
the tunneling of the phase to adjacent valleys, also called macroscopic quantum tunneling
when the photon energy matches the inter-level spacing. This can be observed in the
reduction of junction critical current.
6. Experiments on ultra-small junctions
The Josephson junction under the microwave excitation has been studied for decades and
much works have contributed to the topic, however mostly on low impedance junctions.
(Tinkham 1996) Here the main focus is the junctions with small dissipation, namely, with
environmental impedance Re
Q
ZR≥ . Although a large junction tunneling resistance as well
as small junction capacitance can be obtained by using advanced sub-micron lithography,
the realization of the high impedance condition remains a challenge to single junctions
because of large parasitic capacitance between electrodes. Tasks have been made by using
electrodes of high impedance to reduce the effective shunted resistance and
capacitance.(Kuzmin & Haviland 1991) Another approach to this problem can be made by
using systems in a moderate phase diffusive regime by thermal fluctuation, namely,
J
B
EkT . Koval et al performed experiments on sub-micron Nb/AlO
x
/Nb junctions and
found a smooth and incoherent enhancement of Josephson phase diffusion by microwaves.
(Koval, Fistul et al. 2004) This enhancement is manifested by a pronounced current peak at
the voltage
p
VP∝ . Recently experiments on untrasmall Nb/Al/Nb long SNS junctions
have found that the critical current increases when the ac frequency is larger than the
inverse diffusion time in the normal metal, whereas the retrapping current is strongly
modified when the excitation frequency is above the electron-phonon rate in the normal
metal. (Chiodi, Aprili et al. 2009)
Double junctions, also called Bloch transistors and junction arrays are much easier for
experimentalists to realize the high impedance (low dissipation) condition. The pioneer
work by Eiles and Martinis provided the Shapiro step height versus the microwave
amplitude in ultra-small double junctions.(Eiles & Martinis 1994) Several works found that
the step height satisfies a square law,
(
)
(
)
2
sn Cn
IV IJ x= instead of the RCSJ result,
()
()
sn Cn
IV IJ x= .(Eiles & Martinis 1994; Liou, Kuo et al. 2007) In the one-dimensional(1D)
junction arrays, the supercurrent as a function of microwave amplitude can be found to
obey
()
(
)
2
0
0
sC
IIJx= at high frequencies,
B
kT
ω
> , although no Shapiro steps were seen. At
low frequencies, the current obeys the classical detector result as in expression (8) even for
quasi-particle tunneling. (Liou, Kuo et al. 2008) Therefore a direct and primary detection
scheme was proposed by using the 1D junction arrays.
In single junctions with a high environmental impedance, people has reported observation
of structures in
IV curves at 22Ie
ω
π
=
, featuring the Bloch oscillations due to pronounced
charge blockade. (Kuzmin & Haviland 1991) The 1D arrays also demonstrate similar
Phase Dynamics of Superconducting Junctions
under Microwave Excitation in Phase Diffusive Regime
323
interesting behavior signifying time-correlated single charge tunneling when driven by
external microwaves. This behavior yields a junction current of
22
n
Ine
ω
π
=
as what was
found in the single junctions.(Delsing, Likharev et al. 1989; Andersson, Delsing et al. 2000)
Recently, the Bloch oscillations are directly observed in the “quantronium” device and a
current-to-frequency conversion was realized. (Nguyen, Boulant et al. 2007)
-0.2 0.0 0.2
-100
-50
0
50
100
150
200
250
300
05101520
0
25
50
75
I (pA)
V
b
(mV)
V
s
(μV)
ν (GHz)
w/o rf
-36dBm
-33dBm
-30dBm
-25dBm
-20.8dBm
Fig. 11. The
IV curves of a double junction under microwave irradiation clearly show
Shapiro steps. Inset illustrate the step voltages obey the theoretical prediction. Adopted
from (Liou, Kuo et al. 2007)
PAT is an ideal method to probe the quantum levels or band gaps in a quantum system. For
the charge dominant system(
E
C
>E
J
, R>R
Q
) as an example, Flees et al. (Flees, Han et al. 1997)
studied the reduction of critical current of a Bloch transistor under a microwave excitation.
The lowest photon frequency corresponding to the band gap in the transistor was found to
reduce as the gate voltage tuned to the energy degeneracy point for two charge states. In
another work, Nakamura et al. biased the transistor at the Josephson-quasiparticle (JQP)
point. The irradiating microwaves produced a photon-assisted JQP current at certain gate
voltages, providing an estimation of the energy-level splitting between two macroscopic
quantum states of charge coherently superposed by Josephson coupling.(Nakamura, Chen
et al. 1997) For the phase dominant systems, enhanced macroscopic quantum tunneling
were observed in system of single Josephson junction (Martinis, Devoret et al. 1985; Clarke,
Cleland et al. 1988) and superconducting quantum interference devices(SQUIDs)(Friedman,
Patel et al. 2000; van der Wal, Ter Haar et al. 2000). Recently, devices based on Josephson
junctions, such as SQUIDs, charge boxes, and single junctions have been demonstrated as an
ideal artificial two-level system for quantum computation applications by using the
microwave spectrometry.(Makhlin, Schon et al. 2001)
Superconductor
324
I
n
(pA)
100
0
20
40
60
80
8.00.0 2.0 4.0 6.0
2eV
ac
/h
ν
V
gmax
n=0
n=1
n=2
n=3
Fig. 12. The Shapiro height as a function of the microwave amplitude
V
ac
observed in a
double junction system obeys the square law, a feature of incoherent photon absorption in
this system. Adopted from(Liou, Kuo et al. 2007).
7. Conclusion
We have discussed the dc response of a Josephson junction under the microwave excitation
in the phase diffusion regime theoretically as well as summarized recent experimental
findings. In relative low impedance cases, the classical description (in phase) is plausible to
explain the observed Shapiro steps and incoherent photon absorption. The quantum
mechanical approaches may provide a more precise description for the experimental results
of higher impedance cases such as Bloch oscillations and photon-assisted tunneling. In
extremely high impedance cases, single charge tunneling prevails and a classical description
in charge, such as charging effect can be an ideal approach.
8. Acknowledgement
The authors thank National Chung Hsing University and the Taiwan National Science
Council Grant NSC-96-2112-M-005-003-MY3 for the support of this research.
9. References
Andersson, K., P. Delsing, et al. (2000). "Synchronous Cooper pair tunneling in a 1D-array of
Josephson junctions." Physica B: Physics of Condensed Matter 284: 1816-1817.
Caldeira, A. and A. Leggett (1983). "Dynamics of the dissipative two-level system." Ann
Phys 149: 374.
Chiodi, F., M. Aprili, et al. (2009). "Evidence for two time scales in long SNS junctions."
Physical Review Letters 103(17): 177002.
Clarke, J., A. Cleland, et al. (1988). "Quantum mechanics of a macroscopic variable: the
phase difference of a Josephson junction." Science 239(4843): 992.
Phase Dynamics of Superconducting Junctions
under Microwave Excitation in Phase Diffusive Regime
325
Corlevi, S., W. Guichard, et al. (2006). "Phase-Charge Duality of a Josephson Junction in a
Fluctuating Electromagnetic Environment." Physical Review Letters 97(9): 096802.
Delsing, P., K. K. Likharev, et al. (1989). "Time-correlated single-electron tunneling in one-
dimensional arrays of ultrasmall tunnel junctions." Physical Review Letters 63(17):
1861.
Devoret, M., D. Esteve, et al. (1990). "Effect of the electromagnetic environment on the
Coulomb blockade in ultrasmall tunnel junctions." Physical Review Letters 64(15):
1824-1827.
Eiles, T. M. and J. M. Martinis (1994). "Combined Josephson and charging behavior of the
supercurrent in the superconducting single-electron transistor." Physical Review B
50(1): 627.
Flees, D. J., S. Han, et al. (1997). "Interband Transitions and Band Gap Measurements in
Bloch Transistors." Physical Review Letters 78(25): 4817.
Friedman, J. R., V. Patel, et al. (2000). "Quantum superposition of distinct macroscopic
states." Nature 406(6791): 43-46.
Ingold, G L. and Y. V. Nazarov (1991).
Single Charge Tunneling. H. Grabert and M. H.
Devoret. New York, Plenum. 294.
Koval, Y., M. Fistul, et al. (2004). "Enhancement of Josephson phase diffusion by
microwaves." Physical Review Letters 93(8): 87004.
Kuo, W., C. S. Wu, et al. (2006). "Parity effect in a superconducting island in a tunable
dissipative environment." Physical Review B 74(18): 184522-184525.
Kuzmin, L. S. and D. B. Haviland (1991). "Observation of the Bloch oscillations in an
ultrasmall Josephson junction." Physical Review Letters 67(20): 2890.
Leggett, A., S. Chakravarty, et al. (1987). "Dynamics of the dissipative two-state system."
Reviews of Modern Physics 59(1): 1-85.
Liou, S., W. Kuo, et al. (2007). "Shapiro Steps Observed in a Superconducting Single Electron
Transistor." Chinese Journal of Physics 45: 230.
Liou, S., W. Kuo, et al. (2008). "Phase diffusions due to radio-frequency excitations in one-
dimensional arrays of superconductor/ insulator/superconductor junctions." New
Journal of Physics(7): 073025.
Makhlin, Y., G. Schon, et al. (2001). "Quantum-state engineering with Josephson-junction
devices." Reviews of Modern Physics 73(2): 357.
Martinis, J. M., M. H. Devoret, et al. (1985). "Energy-Level Quantization in the Zero-Voltage
State of a Current-Biased Josephson Junction." Physical Review Letters 55(15): 1543.
Nakamura, Y., C. Chen, et al. (1997). "Spectroscopy of energy-level splitting between two
macroscopic quantum states of charge coherently superposed by Josephson
coupling." Physical Review Letters 79(12): 2328-2331.
Nguyen, F., N. Boulant, et al. (2007). "Current to Frequency Conversion in a Josephson
Circuit." Physical Review Letters 99(18): 187005.
Schon, G. and A. Zaikin (1990). "Quantum coherent effects, phase transitions, and the
dissipative dynamics of ultra small tunnel junctions." Physics Reports 198: 237-412.
Tien, P. and J. Gordon (1963). "Multiphoton process observed in the interaction of
microwave fields with the tunneling between superconductor films." Physical
Review 129(2): 647-651.
Tinkham, M. (1996).
Introduction to Superconductivity. New York, McGraw-Hill.
Superconductor
326
Tucker, J. and M. Feldman (1985). "Quantum detection at millimeter wavelengths." Reviews
of Modern Physics 57(4): 1055-1113.
van der Wal, C., A. Ter Haar, et al. (2000). "Quantum superposition of macroscopic
persistent-current states." Science 290(5492): 773.
Watanabe, M. and D. Haviland (2001). "Coulomb Blockade and Coherent Single-Cooper-
Pair Tunneling in Single Josephson Junctions." Physical Review Letters 86(22): 5120-
5123.
Weiss, U. (2008). Quantum dissipative systems, World Scientific Pub Co Inc.
17
Determination of the Local Crystal-Chemical
Features of Complex Chalcogenides by Copper,
Antimony, and Arsenic NQR
R.R. Gainov
1,2
, A.V. Dooglav
1
, I.N. Pen’kov
2
, A.Yu. Orlova
1
,
I.A. Evlampiev
1
, N.N. Mozgova
3
, and R.R. Khasanov
2
1
Department of Physics, Kazan Federal University, Kazan, Kremlevskaya str. 18, 420008,
2
Department of Geology, Kazan Federal University, Kazan, Kremlevskaya str. 4/5, 420111,
3
Institute of geology of ore deposits, petrography, mineralogy and geochemistry of the
Russian Academy of Science, Staromonetny per. 35, Moscow 109017,
Russian Federation
1. Introduction
In recent years, a number of reviews have appeared in scientific literature on the application
of different physical methods in the structural-chemical and physical studies of solid state
materials, for example, high-temperature superconductors (HTSC). An important place
among them is occupied by nuclear-resonance methods, particular, nuclear magnetic
resonance (NMR), nuclear quadrupole resonance (NQR), nuclear gamma resonance (NGR
or Mössbauer spectroscopy) and other. Particularly, this article shows the feasibility of using
the NQR method, in some instance, in the study of those features of material structure and
chemistry, which are difficult or impossible to attack by conventional methods. The key
advantage of NQR is a possibility to probe directly the electric (quadrupole) interactions
between nuclei and their local environment. In general, the quadrupole interaction describes
the coupling of the nuclear quadrupole moment to the electric field gradient (EFG). The EFG
is determined by bond directions and electronic charge distribution, therefore the
quadrupole interaction is a very sensitive tool for structural-chemical studies of condensed
matter. Notably, it is possible to analyze NQR data (both the spectroscopic and the
relaxation) in materials containing different structural copper (
63,65
Cu), arsenic (
75
As), and
antimony (
121,123
Sb) complexes. This circumstance is especially important in the light of
existence of two types of HTSC: Cu-oxide materials (cuprates) (Rigamonti et al., 1998) and
As- and Sb-bearing pnictides (Wilson, 2009).
Our article is devoted to brief review of some important spectroscopic experimental results
obtained during the studies of binary chalcogenide CuS (also known as covellite),
representing the unusual low-temperature superconductor, and ternary material Ag
5
SbS
4
(referred to as a stephanite). Examples are taken mainly from the studies of the authors′
research group.
The article is organized as follows. Section I contains necessary NQR background for
63,65
Cu,
75
As,
121,123
Sb nuclei. In Section II we report our results concerning the covellite CuS and
Superconductor
328
some related materials with subsequent discussions. Section III is devoted to studies of
stephanite Ag
5
SbS
4
in connection with other related compounds. The paper concludes with
a summary in Section IV.
2. NQR background
The NQR background will be reviewed only for the sake of clarity (Grechishkin, 1973). The
nuclear spins I interact with their electronic environment through quadrupole (i.e. electric)
and magnetic hyperfine couplings. In general, the NQR spectrum is described by the
following Hamiltonian:
222
1
{3 ( 1) ( )}
4(2 1) 2
ZZ
QZ
eQV
HIIIII
II
η
+−
=−+++
−
(1)
Hamiltonian H
Q
refers to as the coupling of nuclear quadrupole moment eQ to the local
crystal electric field gradient (EFG) with V
ZZ
the largest component of the crystal EFG
tensor,
η
=|V
XX
- V
YY
|/V
ZZ
the asymmetry parameter showing the deviation of the EFG
symmetry from the axial one, i.e. the value of
η
lies in the range [0,1]. The EFG components
satisfy Laplace equation: V
XX
+ V
YY
+ V
ZZ
= 0.
The pure NQR spectrum is observed in the case of absence of the external (H
0
=0) and
internal (H
int
= 0) static magnetic fields. The number of NQR lines is defined (i) by the
amount of crystallographically nonequivalent positions of quadrupole nucleus (I > ½) in the
crystal structure, (ii) by the local geometry (i.e. symmetry) of quadrupole nucleus
surrounding, (iii) by the magnitude of nuclear spin I and (iv) by the number of naturally
available isotopes of quadrupole nucleus.
In case of copper, only two naturally available isotopes exist:
63
Cu (69.2% natural
abundance,
γ
/2π=1.128 kHz/Oe, Q=-0.22 barn) and
65
Cu (30.8% natural abundance,
γ
/2π=1.209 kHz/Oe, Q=-0.204 barn) both having spin I=3/2 and thus two doubly
degenerate ±1/2 and ±3/2 energy levels. Thus, for each isotope a transition between these
levels yields a single NQR signal at a frequency:
63,65
63,65 2
1
1
23
ZZ
Q
eQV
h
ν
η
⋅
=⋅+. (2)
Arsenic has a single total-lot isotope
75
As (I = 3/2, 100% natural abundance,
γ
/2π=0.729 kHz/Oe, Q=0.3 barn), therefore the single arsenic crystal-chemical position gives
only one NQR signal at a frequency:
75
75 2
1
1
23
ZZ
Q
eQV
h
ν
η
⋅
=⋅+. (3)
Antimony has two naturally occurring isotopes
121
Sb (I = 5/2, 57.3% natural abundance,
γ
/2π=10,188 MHz/T, Q=-1.3 barn) and
123
Sb (I = 7/2, 45.7% natural abundance,
γ
/2π=5,517 MHz/T, Q=-0.18 barn). The
121
Sb exhibits two NQR signals at frequencies (
η
< 0.2):
121
121 2
(3/2 1/2)
359
(1 )
20 54
ZZ
Q
eQV
h
ν
η
±↔±
⋅
=
⋅+ ⋅ , (4a)
Determination of the Local Crystal-Chemical Features
of Complex Chalcogenides by Copper, Antimony, and Arsenic NQR
329
121
121 2
(5/2 3/2)
611
(1 )
20 54
ZZ
Q
eQV
h
ν
η
±↔±
⋅
=
⋅− ⋅ . (4b)
The
123
Sb with I=7/2 has three NQR signals at frequencies (
η
< 0.2):
123
123 2
(3/2 1/2)
109
(1 )
14 30
ZZ
Q
eQV
h
ν
η
±↔±
⋅
=
⋅+ ⋅ , (4c)
121
123 2
(5/2 3/2)
217
(1 )
14 30
ZZ
Q
eQV
h
ν
η
±↔±
⋅
=⋅−⋅, (4d)
121
123 2
(7/2 5/2)
31
(1 )
14 10
ZZ
Q
eQV
h
ν
η
±↔±
⋅
=⋅−⋅. (4e)
Thus, the single antimony crystal-chemical position in the structure of material under study
yields five NQR signals.
As one can see, NQR frequency ν
Q
depends on the certain arrangement of the surrounding
ions through the parameters V
ZZ
and
η
. The value of ν
Q
is defined by two parameters in
Eq.(4): V
ZZ
and
η
; so it is impossible to obtain both parameters experimentally from the
NQR spectra consisting of only one line for I=3/2 (copper and arsenic). Usually it is done
from the angular dependence of the NMR spectrum taken for a single crystal or from
numerical simulations of NMR spectrum for the unaligned powder. In some cases, for
determination of
η
the 2D nutation NQR studies also could help.
In a semi-empirical approach (Kaufmann & Vianden, 1979), it is assumed that components
of EFG tensor at Cu nuclei site can be written as the sum of two terms – lattice and valence
contributions:
(1 ) (1 )
ZZ latt val val
VVRV
γ
∞
=− ⋅ +− ⋅ (5)
The parameters γ
∞
, R
val
are the Sternheimer antishielding factors. The first contribution
arises from all ion charges outside the ion under consideration and can be calculated using
the model of point-charges (MPC):
2
3
(3 cos 1)
ii
latt
i
i
q
V
r
θ
⋅
⋅−
=∑ , (6)
where q
i
and r
i
are the charge and the position of the i-th ion, respectively, θ
i
– angle between
main axis of symmetry and direction into the neighboring ion.
The computation of valence contribution V
val
(and, as consequence, total V
ZZ
) constitutes a
complex problem, since it requires a detailed knowledge of the structure and electronic
density distribution. On the other hand, the comparison of ν
Q
and V
ZZ
, deduced from
theoretical calculations on the basis of different structural models and approaches (see
Eq.(5)), with experimental values (Eq.(4)) permits to determine the individual features of
local electronic arrangement and peculiarities of chemical bonds. Actually, the lattice
contribution V
val
is defined by crystal symmetry, whereas the valence contribution V
val
is
determined by the local symmetry of nearest environment, i.e. according to NQR
frequencies and line-widths it is possible to investigate the following EFG characteristics: the
Superconductor
330
electronic density distribution inside of different coordination complexes and their
symmetry, the extent of ionic (covalent) bonds and angles between them. Every factor,
which is connected with reorganization of atomic or molecular group, can change
significantly the EFG value on the nucleus inside of a such group and, as consequence, NQR
is very sensitive to different crystal-chemical transformations in crystal lattice. Therefore, the
studies of temperature dependences of NQR spectroscopic parameters give the possibility to
find phase transitions and investigate their nature.
3. Towards to electronic structure of binary copper chalcogenides
There is a great number of compounds in the system of binary copper chalcogenides Cu-S,
Cu-Se, and Cu-Te. In particular, materials eleven natural minerals and two unstable
synthetic phases among only binary copper-sulfide have been discovered up to date (Goble,
1985; Gablina, 1997). Many of them are widely used in optoelectronics (Abrikosov et al.,
1975; Isac et al., 2007) and some of them represent the industrial mineral specimens in
copper-ore deposits (Izoitko, 1997). The more significant involving of these compounds into
the practical application is stopped by the fact that currently available standard
instrumental techniques for studying crystal-chemical problems such as X-ray structural
diagnosis, optical spectroscopy, and electronic microscopy have inherent limitations
(Gablina, 1997). These manifest themselves in being unable to characterize the chalcogenides
samples fully, especially if they are polycrystalline. These methods are mainly ineffective
and little informative in case of multiphase natural samples (minerals) (Gablina, 1997).
This Section describes briefly the spectroscopic studies of layered low-temperature
superconductor CuS (covellite, originally published in (Gainov et al., 2009)) and related,
potentially perspective, but insufficiently known compounds: non-stoichiometric sulfide
Cu
1.6
S (naturally occurring as geerite) and selenium analog of CuS – α-CuSe (klockmannite).
The description of experimental methodic and synthesis conditions can be found in (Gainov
et al., 2009).
3.1 Crystal-chemistry of CuS, Cu
1.6
S, and α-CuSe
Covellite CuS represents the metal with excellent hole conductivity, which becomes
anisotropically superconducting below T
C
= 1.6 K (Meissner, 1929; Buckel & Hilsch, 1950;
Saito et al., 1997; Di Benedetto et al., 2006). The elementary cell of CuS at room-T has a
hexagonal symmetry (space group P6
3
/mmc) (Berry, 1954; Evans & Konnert, 1976; Ohmasa
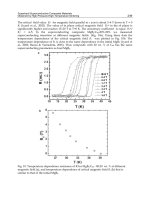
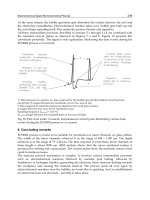
et al., 1977). The structure of CuS can be described as a “sandwich”, which consists of three
alternating layers A
1
-B-A
2
(Fig. 1). The layer B represents the net of [Cu(1)-S(1)
3
]–triangles,
whereas the layers A
1
and A
2
are made up of [Cu(2)-S(1)S(2)
3
]–tetrahedra. The units A
1
-B-A
2
are connected together along the c-axis by S(2)-S(2) bonds. It was revealed that the second-
order phase transition (PT) is occurred at about T
PT
= 55 K (Fjellvåg et al., 1988). This
transition can be presented as a little shift of the layer B with respect to the layers A
1
and A
2
perpendicular to the c-axis with the change of the Cu(2)-S(1)-Cu(2) bonding angle from 180º
at room-T to 170º below T
PT
.
The crystal structure of klockmannite α-CuSe is not identified in detail up to date. As a first
approach, it is assumed that the structure of α-CuSe is somewhat similar to those in CuS
(Berry, 1954; Peiris et al., 1998; Milman, 2002): there are the same space group and layered
motive A
1
-B-A
2
with the CuSe
3
, CuSe
4
, and Se-Se complexes. At the same time, it is
proposed the occurrence of CuS-based superlattice in klockmannite (Berry, 1954).
Determination of the Local Crystal-Chemical Features
of Complex Chalcogenides by Copper, Antimony, and Arsenic NQR
331
The structure of geerite Cu
1.6
S is unsolved. It was suggested only that Cu
1.6
S can have a
structure with the blende-like subcell (Goble, 1985).
Fig. 1. Crystal structure of the covellite CuS above T
PT
= 55 K. For details, see text
3.2 NQR spectra of CuS, Cu
1.6
S, α-CuSe
In Table I the NQR frequencies observed for the title materials together with previously
published data are listed. As one can see, the values of NQR frequencies are quite different.
However, their comparison and analysis can allows us to reveal some unique features of
compounds studied.
Let us start from the covellite CuS. It was found that copper NQR spectra of both synthetic
and natural samples of CuS contain two copper pairs (Gainov et al., 2009). The presence of
two spectral pairs permits us to assert that NQR spectra reflect the occurrence of two
crystallographically non-equivalent sites of copper nuclei in CuS. The first pair, attributed to
three-coordinated Cu(1), is placed at 14.88 (
63
Cu, 4.2 K) and 13.77 MHz (
65
Cu, 4.2 K)
(Fig. 2(a)), whereas the second pair, assigned to four-coordinated Cu(2) site (not shown here,
see (Gainov et al., 2009)), is located at 1.87 (
63
Cu, 4.2 K) and 1.73 MHz (
65
Cu, 4.2 K). In
general, there is no EFG at the sites with cubic local symmetry (Slichter, 1996). This case is
takes place for the tetrahedral Cu(2) sites in layers A
1
and A
2
(Fig. 1). However, significant
deformations of the CuS
4
tetrahedrons break the cubic symmetry and, as consequence, EFG
on the copper nucleus in this position becomes nonzero. The appearance of low-frequency
NQR signals points that this case is realized actually for the tetrahedral Cu(2) sites in CuS.
Therefore, our NQR spectra prove strongly the crystallographic data (Fjellvåg et al., 1988)
concerning the occurrence of low-symmetry distortions around Cu(2) sites below T
PT
= 55 K.
Other words, NQR spectra can serve as an independent confirmation of the low-T model of
the CuS structure.
Superconductor
332
Material
Positions
63
Cu NQR frequencies
1
, MHz
(T = 4.2 K)
Site 1 14.89
CuS (covellite)
Site 2 1.87
Site 1 16.95
Site 2 16.20
Site 3 15.25
Site 4 11.95
Cu
1.6
S (geerite)
Site ? Below 2 MHz?
Site 1 12.17
Site 2 11.89
Site 3 9.49
Site 4 9.39
Site 5 8.27
Site 6 6.60
Site 7 6.50
Site 8 4.49
Site 9 4.01
Site 10 3.75
Site 11 3.29
Site 12 2.83
α-CuSe
(klockmannite)
Site 13 2.09
1
The values of NQR frequencies for
65
Cu isotope can be calculated in accordance with ratio
ν
Q
(
63
Cu)/ν
Q
(
65
Cu) = 1,081.
Table I. NQR frequencies for CuS and some related compounds.
High-frequency NQR spectra, corresponding to triangular Cu(1), are also intriguing (Fig. 2(a)).
It is notable that these NQR signals are placed at lower frequency range in comparison with
the region of 20-25 MHz, in frame of which NQR signals of majority of other copper sulfides
lie (Abdullin et al., 1987). In case of copper sulfides EFG is mainly formed by the lattice term
and a quite narrow range of the ν
Q
changes can be explained by insignificant variations of the
Cu-S distances, S-Cu-S angles and the polarity of chemical bonds. In fact, such conclusion was
checked by theoretical calculations according to Mulliken-Wolfsberg-Helmholtz method
(Abdullin et al., 1987). This result indicates directly that the valence contribution for the EFG at
the Cu(1) site in CuS is more considerable than in case of triangular units CuS
3
of other
sulfides. Analysis shows that the more probable reason of this unusual ν
Q
lowering is
connected with anomalously short Cu(1)-S distances in CuS (2.19 Å) compared to those in
other sulfides (≈ 2.33 Å). It seems, however, that due to Bayer’s influence of thermal-induced
lattice vibrations, NQR frequency ν
Q
must increase with decreasing distances as it takes place
in most compounds (Semin et al., 1975): according to MPC model (Eq.(6)), EFG is inversely
proportional to the distance between metal and ligand. On the other hand, the shortening of
metal–ligand distances can lead to charge transfer with subsequent redistribution on the
different orbitals (Semin et al., 1975). In our case this process can be related to the charge
transfer between valency Cu-4p,3d and S-3p orbitals (Gainov et al., 2009). Indeed, in frame of
the semi-empirical approach (Section I), the valence contribution to the EFG, V
val
, is related
particularly to the various electronic hole densities as follows:
Determination of the Local Crystal-Chemical Features
of Complex Chalcogenides by Copper, Antimony, and Arsenic NQR
333
(4 )
3
44() 4() 4()
11
[]
22
p
pp
z
p
x
py
val
VAr N N N
−
=⋅〈 〉⋅ − − , (7)
where A is a constant, N
3d(x,y,z)
and N
4p(x,y,z)
are the numbers of electronic holes in different
Cu-4p orbitals, the charge of an electron is given by –e. In this way, the hole concentration
can be estimated from the change of ν
Q
. It was pointed that the shortening of Cu-S distances
in Cu(1)S
3
complexes in CuS can lead to decreasing electronic density of the Cu-4p
z
orbital
and increasing population of Cu-4p
x
and Cu-4p
y
orbitals. According to Eq.(7) this factor can
play a vital role in the lowering of the total EFG value at the Cu site by about 5 MHz. Thus,
the experimentally observed shift of the high-frequency
63
Cu(1) NQR signal from the
frequency range of 20–25 MHz typical for three-coordinated Cu by S atoms in other copper
sulfides can serve as an indication of the strong hybridization of Cu(1)–S chemical bonds in
Cu(1)S
3
complexes. Remarkably, this conclusion was confirmed later by studies of copper
nuclear spin-lattice relaxation (Gainov et al., 2009).
Let us compare now the
63
Cu NQR spectra of covellite CuS and geerite Cu
1.60
S (Fig. 2(b)-
2(d), Table I). As one can see, the samples studied are multiphase and contain two structural
phases (CuS and Cu
1.60
S).
10 11 12 13 14 15 16 17 18 19 20
(d)
Frequency (MHz)
(c)
Cu
3
Cu
2
CuS + Cu
1.6
S
(b)
Cu
1
CuS
Cu
1.6
S
63
Cu
NQR spin-echo intensity (arb. units)
Pure CuS
65
Cu
Cu
4
(a)
Fig. 2. High-frequency copper NQR spectra for covellite, CuS, and geerite, Cu
1.6
S. Arrows
point to the positions of
63,65
Cu(1) NQR signals of CuS. The vertical dashed lines point to the
positions of
63
Cu NQR signals of Cu
1.6
S phase For details, see text.
Superconductor
334
The principle difference between samples is a variation of quantitative proportion of CuS
and Cu
1.60
S. The NQR spectra of such samples are convenient for detailed discussion. As
indicated in Fig. 2, at high-frequency range (10.00-17.00 MHz) there are five copper NQR
pairs, one of them corresponds to covellite CuS (exact coincidence of Cu line frequencies);
the additional four Cu pairs belong to another structural phase – geerite Cu
1.60
S. Notably,
the NQR spectra, which pertain to this phase, coincide in all multiphase samples and
include the following lines: 16.95, 16.20, 15.25, 11.95 MHz for
63
Cu and 15.67, 14.98, 14.11,
11.06 MHz for
65
Cu. It should be noted that our results prove fully the previous data for
Cu
1.6
S (Anashkin et al., 1994), according to which these eight Cu NQR lines have been
observed at the same frequencies. It is interesting that the NQR signal intensities of Cu
1.6
S
phase increase with increasing amount of Cu
1.6
S and, simultaneously, the signals intensities
of CuS decrease according to the same proportion (Fig. 2). We not here that this fact can in
general serve as supplementary striking evidence for the possibility to use NQR method in
qualitative and quantitative phase-analytical diagnostics of different chalcogenides.
As it was pointed above (Section I), the number of NQR centers in the structure of material
studied is not less than the amount of crystallographically non-equivalent positions of
resonant nuclei. At least four centers exist in case of geerite Cu
1.6
S (four pairs of
63
Cu and
65
Cu lines). Hence, the total number of different crystal-chemical sites of copper in this
compound is not less than four. This circumstance reflects the serious distinction in
symmetry of CuS and Cu
1.6
S electronic structures. On the other hand, we can see that the
range of 10.00-17.00 MHz, in frame of which eight
63,65
Cu lines of Cu
1.6
S are located, is also
not typical for NQR signals exhibited by most of copper sulfides. Moreover, NQR lines of
Cu
1.6
S are grouped around the high-frequency Cu NQR signal of covellite CuS. Taking into
account these two aspects, it is possible to claim that the electronic structures of CuS and
Cu
1.60
S are still different, but they have the same crystal-chemical motive. In principle, our
NQR results suggest that the structure Cu
1.60
S can be interpreted as the derivative of
covellite CuS structure with the strong deformations. To our knowledge, this conclusion is a
first experimental argument in favor of crystallographical proximity between CuS and
Cu
1.60
S phases.
We turn now to the
63
Cu NQR spectrum for CuS and the
63
Cu NQR spectrum for selenium
analog of CuS – klockmannite, α-CuSe (Table I). Their comparative analysis can also
introduce new information concerning their electronic structure as well as highlight some
reasons for low-temperature phase transitions in these materials (Section II.1). In general,
the copper selenide CuSe undergoes two phase transitions upon cooling: from γ-CuSe into
β-CuSe modification near 398 K and to α-CuSe at 323 K (Nozaki et al., 1995; Milman, 2002).
It was proposed that α-CuSe has the same structure as CuS (Berry, 1954) and the β–γ
transformation of CuSe is similar to that in CuS at T
PT
=55 K (Nozaki et al., 1995). Notably,
Raman spectroscopy and powder X-ray diffratometry shows that in the system of CuS
1-x
Se
x
(0≤x≤1) compounds T
PT
increases from 55 K for x=0 up to 398 K for x=1 (Nozaki et al., 1995).
However, it was found that α-CuSe is characterized by 13 lines in the spectrum with NQR
frequencies in the range of 13–2 MHz at 4.2 K. First, this aspect points strongly to the
presence of strong deformations of the α-CuSe crystal and gives evidence that CuS and α-
CuSe are not isostructural as it was supposed earlier (Berry, 1954). It is clearly seen that α-
CuSe has at least 13 non-equivalent Cu positions. These data point that α-CuSe can be
considered as distorted version of CuS-based structure. Second,
63
Cu NQR frequencies in α-
CuSe are rather low as compared with that in CuS. This indicates that insertion of Se atoms
Determination of the Local Crystal-Chemical Features
of Complex Chalcogenides by Copper, Antimony, and Arsenic NQR
335
instead of S in CuS results in the conversion of Cu(1) threefold units (Fig. 1) into distorted
fourfold ones in CuS
1-x
Se
x
. However, such a substitution mechanism implies basically the
preservation of layered structural motive in CuS
1-x
Se
x
(as in CuS). The preferential
occupation of Se at the S(2) sites (Nozaki et al., 1995) leads to the approaching of some Se(2)
atoms to Cu(1) sites and to the formation of distorted tetrahedrons Cu(1)Se(1)
3
Se(2)
1
in α-
CuSe instead of triangular units Cu(1)S(1)
3
in CuS (Fig. 1). In this case such deformations
would promote the approaching of Cu(1) and Cu(2) ions to each other and creation of an
effective interaction between them, as it was proposed for CuS and α-CuSe earlier (Fjellvåg
et al., 1988; Milman, 2002). Upon cooling this interaction can stimulate the phase transition.
Such scenario is supported by the dependence of the T
PT
value on the Se amount in mixed
samples CuS
1-x
Se
x
(0≤x≤1) (Nozaki et al., 1995). Actually, since the Cu(1)-Cu(2) bonds in CuS
are longer than that in CuS
1-x
Se
x
, this phase transition in CuS occurs at lower T. Thus, NQR
spectra signify that α-CuSe material is related crystal-chemically to CuS and have a
somewhat similar layered structure, but either of Cu(1)Se
3
and Cu(2)Se
4
complexes in this
compound are strongly distorted and this aspect leads again to layered A
1
-B-A
2
structure, as
in CuS, but with different and uncertain structures of layers A
1
, A
2
, and B (Fig. 1).
3.3 Temperature dependences of NQR spectra of CuS, Cu
1.6
S, α-CuSe
The dependence of the high-frequency
63
Cu(1) NQR line of CuS on temperature is shown in
Fig. 3. As one can see, the quadrupole frequency ν
Q
decreases with increasing temperature
without significant anomalies. However, there exist two weak effects: the change of the
slope in the temperature dependence of ν
Q
at 65 K (near T
PT
) and 210 K. In order to describe
an approximate behavior of ν
Q
in the region of 65–290 K we applied the following equation
(Kaufmann & Vianden, 1979):
() (0)(1 )
b
TaT
νν
=⋅−⋅, (8)
where ν
Q
(0), a and b are the fitting parameters. The best result of fitting depicted in Fig. 3 by
solid curve was obtained for ν
Q
(0) = (14.95 ± 0.02) MHz, a = (1.7 ± 0.5)*10
-4
MHz/K and
b = (0.98 ± 0.05). It has been argued that the dependence of the NQR frequency in CuS on
temperature can be understood in terms of charge fluctuations in Cu(1)-S(1)-Cu(2) bonds. It
is known that a lot of non-cubic metals ν
Q
(T) can be well reproduced by the empirical Eq. (8)
with b=1.5; this relation is often referred to as the “T
3/2
law” (Kaufmann & Vianden, 1979).
No reliable explanation of the T
3/2
temperature dependence of ν
Q
has been presented in the
literature (Kaufmann & Vianden, 1979; Torumba et al., 2006). However, it is proposed that
thermal vibrations of the host lattice atoms are regarded as responsible for such universal
relation. CuS shows another relation – parameter b is close to 1 and, as consequence, ν
Q
(T)
does not follow the T
3/2
law. Such unusual behavior of ν
Q
is observed in mixed-valence
metals, for example, in EuCu
2
Si
2
(Sampathkumaran, et al., 1979). The principle distinction of
mixed-valence metals from “simple” ones is a variable number of conduction electrons
(holes), which can “stick” temporary to ionic orbitals as valence electrons (holes). This
valence instability initiated by Eu ions influences indirectly the Cu quadrupole interactions
(V
ZZ
) and, as it was shown experimentally, the T
3/2
law becomes not valid. Since in the
range of 60–290 K there are no structural changes in CuS (η ≈ 0), the dependence of ν
Q
on
temperature is determined only by V
ZZ
. In a similar manner, the bridging S(1) ion in CuS
can provide a minor charge transfer between Cu(1) and Cu(2) in some fluctuating regime.
The strong hybridization of Cu(1) and Cu(2) conduction bands via S(1) atom, which was
Superconductor
336
revealed by means of analysis of NQR spectra and nuclear relaxation (Section II.2), should
allow this transfer.
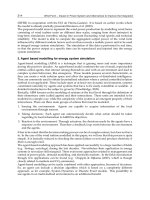
0 25 50 75 100 125 150 175 200 225 250 275 300
14.0
14.2
14.4
14.6
14.8
15.0
T=210 K
63
Cu NQR frequency ν
Q
(MHz)
−− ν
Q
(T)=ν
Q
(0)⋅(1-a⋅T
b
)
ν
Q
(0)=14.95 MHz;
a=1.70⋅10
-4
MHz/K; b=0.98
T=65 K
Fig. 3. The temperature dependence of
63
Cu(1) NQR frequency for CuS (points) with the fit
of data by Eq. (8) within 65–290 K (curve) and extracted fitting parameters. Arrows point to
the positions of the change of slope in the ν
Q
(T) dependence at 210 K and at 65 K. For details,
see text.
Remarkably that the temperature dependences of NQR frequencies in geerite Cu
1.6
S
(Section II.2) have the same linear character, as it takes place in case of case covellite CuS
(results will be published in forthcoming paper). This experimental feature can also serve as
indication of the similarity of CuS and Cu
1.6
S structures. Furthermore, the proximity of NQR
spectra for CuS and Cu
1.6
S materials and their analogous temperature dependences provide
evidence that the main structural block of geerite was inherited from covellite CuS. The
temperature dependences of some NQR frequencies in α-CuSe were also monitored in the
range of 4.2-77 K (Anashkin et al., 1994). It was found that the temperature gradient of NQR
frequencies is rather small, although the dispersion of NQR frequencies is substantial. These
data are also point that CuS and α-CuSe have the similar features in lattice dynamics, where
the layered structural motive and comparable coordination complexes play the essential role.
4. Towards to electronic structure of antimony chalcogenides Sb
2
S
3
,
As
5
SbS
4
, Ag
3
SbS
3
The binary and ternary chalcogenide compounds of As, Sb, and Bi have the structures,
which are closely related to zinc blende or wurtzite materials. As copper chalcogenides,
some of them are used in optoelectronics (Abrikosov et al., 1975) and these compounds also
represent the economically important minerals, which serve, for example, as sources of
silver. From “scientific” position, these materials are interesting due to the fact that many of
them undergo phase changes at low temperatures from ordered states to cation-disordered
ones. The disordered states in these materials have potentially useful unique physical
properties. For example, proustite Ag
3
AsS
3
and pyrargyrite Ag
3
SbS
3
appear to be excellent
model crystals for studies of commensurate and incommensurate ferroelectric properties
(Blinc & Zeks, 1974). Experience has proved that NQR in combination with X-ray analysis
Determination of the Local Crystal-Chemical Features
of Complex Chalcogenides by Copper, Antimony, and Arsenic NQR
337
can be as an effective tool for studies of detailed aspects of such phases (Blinc & Zeks, 1974).
In spite of this fact, some related materials (for instance, phase of stephanite, Ag
5
SbS
4
) are
little known from crystal-chemical and physical point of views. In order to highlight the
electronic features of Ag
5
SbS
4
, we present here some modern NQR data concerning this
compound and comparative analysis in the context of associated materials, such as stibnite
(antimonite) Sb
2
S
3
and pyrargyrite Ag
3
SbS
3
.
4.1 Crystal-chemistry of Sb
2
S
3
, As
5
SbS
4
, Ag
3
SbS
3
Stibnite (Sb
2
S
3
), pyrargyrite (Ag
3
SbS
3
), proustite (Ag
3
AsS
3
), stephanite (Ag
5
SbS
4
), and other
Sb(As)-bearing sulfides and sulfosalts belong to the group of the complex chalcogenides
with universal formula A
x
B
y
S
n
, where A = Ag, Cu, Pb, etc., and B = As, Sb Bi. Some
structural units in materials mentioned above are the same; hence the chalcogenides are
rather similar. In particular, all of them consist of infinite one-dimensional chains, extended
along the c-axis. One of the basic unit elements are the trigonal group BS
3
, referred also to as
umbrella-like complexes (Povarennykh, 1972). The differences between them, however, are
substantial and are caused by different combinations of structural units, mechanisms of
their connection and, of course, different kind of crystal-chemical distortions. However,
these data are not always determinable with the desired accuracy by the methods of X-ray
diffraction: the patterns usually obtained are averaged for all elementary cells.
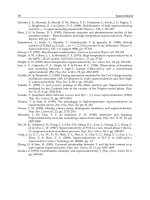
The elementary cell of stephanite, Ag
5
SbS
4
, at room temperature corresponds to
orthorhombic symmetry with the space group Cmc2
1
(Fig. 4). The parameters of the unit cell
are the following: a =7.830 Å, b = 12.450 Å, c = 8.538 Å (Petrunina et al., 1970). The structure
can be presented as chains formed by SbS3 complexes. These chains organize the pairs and
they are oriented along the c-axis. Atoms of Ag are located between the SbS3 units of
adjacent chains. According to X-ray analysis, stephanite contains a single crystal-chemical
position of Sb in the structure.
Fig. 4. Crystal structure of the stephanite, Ag
5
SbS
4
at room temperature. Green circles –
antimony atoms, red circles – silver atoms, yellow circles – sulfur atoms.
Superconductor
338
The space group of stibnite (antimonite), Sb
2
S
3
, is Pbnm, the lattice constants are the
following: a =11.20 Å, b = 11.28 Å, c = 3.83 Å (Povarennykh, 1972). The lattice is constructed
on the base of Sb-S-Sb zigzag-like chains, which form the double tapes (Sb
4
S
6
)
n
. The unit cell
contains two crystallographically non-equivalent Sb-postions: site A and site B.
Pyrargyrite, Ag
3
SbS
3
, and proustite, Ag
3
AsS
3
, are isostructural compounds with limited
substitution between As and Sb (Povarennykh, 1972). Umbrella complexes (BS
3
) are turned
by vertexes to one direction and jointed by means of Ag atoms, which form together with S
atoms the helical chains elongated along the cell axis. Their space groups at room
temperature are R3c with cell dimensions a =10.78 Å, c = 8.682 Å for proustite and
a =11.05 Å, c = 8.74 Å for pyrargyrite. All of them have at room temperature the single
crystal-chemical position of Sb(As) in the structure.
4.2 NQR spectra of Sb
2
S
3
, As
5
SbS
4
, Ag
3
SbS
3
In Table II the NQR frequencies of the compounds mentioned above are reported. NQR
spectrum of stephanite is shown in Fig. 5. In general, it was found that antimony NQR
spectra of Sb
2
S
3
at 77 K consist of 10 lines (Safin & Pen’kov, 1962; Abdullin et al., 1977). This
fact points that stibnite have two crystallographically non-equivalent sites of antimony
nuclei (Section I). Such NQR data are in good agreement with X-ray analysis studies
(Section III.1), according to which there exist two antimony positions noted as site A and site
B. As it should be noted from NQR spectra, A complexes are axially-symmetrical;
asymmetry parameter of EFG tensor closes to zero (
η
= 0.8 %). In contrast, B complexes are
strongly distorted (
η
≈ 40 %). As one can see from Table II and Fig. 5,
121,123
Sb NQR spectra
of stephanite, Ag
5
SbS
4
, at 77 K consist of 5 lines. This information indicates that all positions
of antimony in stephanite lattice are structurally equivalent (there is a single antimony site).
Non-zero value of asymmetry parameter signifies that the perceptible distortions of SbS
3
pyramids take place in Ag
5
SbS
4
. Analogous situation happens in case of isostructural
pyrargyrite, Ag
3
SbS
3
, and proustite, Ag
3
AsS
3
(Pen’kov & Safin, 1966a). For both
chalcogenides, the NQR signals at 77 K are observed from one structural Sb(As) site
(Table II). Analysis of NQR spectra shows that asymmetry parameters at these temperatures
are not far from zero (Pen’kov & Safin, 1966a).
121,123
Sb NQR frequencies, MHz (T = 77 K)
121
Sb
123
Sb
Material Position
1/2↔3/23/2↔5/21/2↔3/23/2↔5/25/2↔7/2
η,
%
Ref.
Site A 47.71 95.41 28.96 57.90 86.86 0.8
Sb
2
S
3
(stibnite)
Site B 42.98 73.29 32.27 43.13 67.45 38.1
Safin & Pen’kov,
1962
Ag
3
SbS
3
(pyrargyrite)
Single 49.84 99.70 30.28 60.52 90.78 ≈ 0
Pen’kov & Safin,
1964
Ag
5
SbS
4
(stephanite)
Single 54.942 108.280 34.265 65.462 98.700 10.7
This work;
Pen’kov & Safin,
1966a
Table II. NQR frequencies for Ag
5
SbS
4
and some related compounds.
The construction of umbrella Sb(As)S
3
complexes, in contrast to some complexes with
transition metals (as it occurs, for example, for CuS
4
units in copper chalcogenides, see
Section II) suggests the presence of non-cubic local crystal fields. This circumstance shows
that EFG on the Sb(As) nuclei is not caused by structural distortions (particularly, X-Sb(As)-
Determination of the Local Crystal-Chemical Features
of Complex Chalcogenides by Copper, Antimony, and Arsenic NQR
339
X angles have little changes in equitype coordination complexes AsS
3
-SbS
3
-BiS
3
-AsO
3
). As
consequence, it is obvious that sp-hybridization does not play a substantial role in creation
of EFG. In this case the EFG is formed primarily due to redistribution of electronic density. It
was demonstrated specially that the main factor influenced on the EFG value in NQR
spectra of Sb(As)-bearing chalcogenides is a change of Sb(As)-S bond polarity (Pen’kov &
Safin, 1966b), i.e. the extent of bond ionicity. Analysis of the EFG nature in a number of
structural motives allows one to take into account the following aspects in distribution of
electronic density: 1) ionicity-covalency of Sb(As)-S bonds, in frame of which the donor-
acceptor type of bonds are also become apparent; 2) occurrence of Sb(As)-Sb(As)
interactions; 3) influence of Me-S (Me is a metal element, such as Cu, Pb, Ag, and other). The
donor-acceptor bonds can be realized owing to transfer of electrons from atoms-“donors”,
which either contains the essential number of electrons on the external p- and d-orbitals or
have “unshared” s
2
-electrons, to atoms-“acceptors” with the little number of electrons.
Sulfur atoms (S, 3s
2
3p
4
) can serve as donors due to both the unshared s
2
-electrons and the p-
electrons.
30 40 50 60 70 80 90 100 110
123
Sb
NQR spin-echo intensity (arb. units)
Frequency, (MHz)
121
Sb
Fig. 5. Antimony NQR spectra for Ag
5
SbS. Triangular symbols point to the positions of
121,123
Sb NQR signals. The vertical dashed lines point to the positions of two Sb NQR signals,
which were not studied. For details, see text.
In this context, let us discuss at first the EFG origin in stibnite, Sb
2
S
3
(Safin & Pen’kov, 1962;
Abdullin et al., 1977). Interestingly, the values of NQR frequencies for antimony in B site are
notably less that NQR frequencies for this element in A site. As it was proposed, Sb-S bonds
in case of B site appear to be more covalent as compared with bonds, corresponding to A
site. The increasing of covalent effect is explained by manifestation of additional bonds,
having the donor-acceptor nature. These contacts should decrease the value of effective
charge on the antimony atom. Taking into account these aspects, the coordination number of
Sb atoms located in B position increases up to 5. Corresponding coordination polyhedron
can be visualized as a distorted semi-octahedron SbS
5
.
In case of “metallic” chalcogenides situation is more complex. In contrast to binary Sb(As)-
bearing compounds, the crystal electric fields, caused by Sb(As)-S bonds in frame of
SbS
3
(SbS
5
) complexes, are influenced also by the fields created by metallic atoms (Cu, Ag
Superconductor
340
and other). These interactions lead to appearance of twofold consequence. First factor is a
so-called steric effect: Sb(As) and S atoms are repulsed. Second factor is an induction effect,
according to which the metallic atoms “remove” part of electronic density. These effects are
closely associated and usually coexist. As a result, Sb(As)-S bonds are “loosened” and they
become more polar. This leads, as a rule, to increase of NQR frequencies. The pyrargyrite-
proustite phases Ag
3
[Sb(As)]S
3
may serve as an excellent example of such behavior (Pen’kov
& Safin, 1966a). As it was found, the natural samples of pyrargyrite, Ag
3
SbS
3
, can contain a
little number of As impurity; these substitution atoms occupy the positions of Sb. The
resonance frequency shift for As impurities indicates the existence of more ionic nature for
the As-S bonds in Ag
3
SbS
3
matrix than for those in the etalon samples of proustite, Ag
3
AsS
3
.
The increasing of ionicity is explained by steric inconsistency: actually, the covalent radiuses
of As and Sb atoms are 1.21 and 1.41 Ǻ, respectively. In this case, the impurity atoms are
forced to accommodate themselves into the structural positions and dimensions of “native”
matrix atoms.
Now, it is easier to discuss the EFG nature in stephanite, Ag
5
SbS
4
. Indeed,
121,123
Sb NQR
frequencies for Ag
5
SbS
4
are higher than that for binary stibnite, Sb
2
S
3
. This fact provides
evidence that the “metallic” twofold factor, in addition to “standard” donor-acceptor bonds,
also exists in Ag
5
SbS
4
. Moreover, the values of NQR frequencies for Ag
5
SbS
4
exceed the
values of resonance frequencies exhibited by pyrargyrite, Ag
3
SbS
3
. Therefore, Sb-S bonds in
stephanite appear to be more polar than in stibnite and pyrargyrite. This circumstance
implies also that the higher NQR frequencies (as compared with pyrargyrite) are associated
with a higher coordination number of the Ag atoms (in other words, with stronger
induction interaction of the Sb-S and Ag-S bonds).
4.3 Temperature dependences of NQR spectra of Sb
2
S
3
, As
5
SbS
4
, Ag
3
SbS
3
The study of spectroscopic parameters (NQR frequencies, ν
Q
, NQR line-widths, Δν
Q
, and
asymmetry parameter, η,) as a function of temperature (T) immediately provides important
information since the components of EFG tensor are very sensitive to small atomic
displacements or modifications of charge distribution.
Let us describe at first the recent data for stephanite phase, Ag
5
SbS
4
. As it was noted above,
121,123
Sb NQR spectrum of Ag
5
SbS
4
at T =77 K consists of five lines (Fig. 5). It is quite enough to
observe only three of five NQR lines in order to detect any possible anomalies in temperature
dependences of spectroscopic characteristics and calculate asymmetry parameter, η (Section I).
In general, we studied the temperature dependences (4.2–300 K) of the following resonance
frequencies and their line-widths: ν
Q1
(±1/2↔±3/2), ν
Q2
(±3/2↔±5/2) for
123
Sb, and
ν
Q3
(±1/2↔±3/2) for
121
Sb. The Sb NQR line shapes were well fitted by Lorentzian function at
all temperatures studied (corresponding line-widths were taken as a full width at half
maximum). The temperature dependence of ν
Q1
is
presented in Fig. 6.
On the whole, the quadrupole frequency ν
Q1
decreases with increasing temperature without
any significant anomalies. Thus, it is possible to exclude the major structural transitions. At
the same time, we point out on the weak change in the slope of the ν
Q1
versus T dependence
at about 145 K. The temperature dependences of line-widths Δν
Q1
and Δν
Q2
are displayed in
Fig. 7. It is important that the line-widths at all temperatures studied are not larger than
90 kHz. Such values, taking into account the stephanite complexity, imply this compound
represents a high-ordered structure. As one can see, the NQR line-widths decrease rather
weakly with decreasing of temperature in the range of 4.2–145 K, but it seems that one of the
lines (Δν
Q2
) narrows more drastically above 145 K.