Hindawi Publishing Corporation EURASIP Journal on Image and Video Processing Volume 2010, Article ID potx
Bạn đang xem bản rút gọn của tài liệu. Xem và tải ngay bản đầy đủ của tài liệu tại đây (14.04 MB, 12 trang )
Hindawi Publishing Corporation
EURASIP Journal on Image and Video Processing
Volume 2010, Article ID 814319, 12 pages
doi:10.1155/2010/814319
Research Article
Automatic Seg mentation and Inpainting of
Specular Highlig hts for Endoscopic Imaging
Mirko Arnold, Anarta Ghosh, Stefan Ameling, and Gerard Lacey
School of Computer Sc ience and Statistics, Trinity College, Dublin, Ireland
Correspondence should be addressed to Anarta Ghosh,
Received 30 April 2010; Revised 2 November 2010; Accepted 2 December 2010
Academic Editor: Sebastiano Battiato
Copyright © 2010 Mirko Arnold et al. This is an open access article distributed under the Creative Commons Attribution License,
which permits unrestricted use, distribution, and reproduction in any medium, provided the original work is properly cited.
Minimally invasive medical procedures have become increasingly common in today’s healthcare pr actice. Images taken dur ing
such procedures largely show tissues of human organs, such as the mucosa of the gastrointestinal tract. These surfaces usually have
a glossy appearance showing specular highlights. For many visual analysis algorithms, these distinct and bright visual features can
become a significant source of error. In this article, we propose two methods to address this problem: (a) a segmentation method
based on nonlinear filtering and colour image thresholding and (b) an efficient inpainting method. The inpainting algorithm
eliminates the negative effect of specular highlights on other image analysis algorithms and also gives a visually pleasing result. The
methods compare favourably to the existing approaches reported for endoscopic imaging. Furthermore, in contrast to the existing
approaches, the proposed segmentation method is applicable to the widely used sequential RGB image acquisition systems.
1. Introduction
Due to reduced patient recovery time and mortality rate,
minimally invasive medical procedures have become increas-
ingly common in today’s healthcare pract ice. Consequently,
technological research related to this class of medical proce-
dures is becoming more widespread. Since many minimally
invasive procedures are guided through optical imag ing
systems, it is a commonly investigated question, what kind
of sensible information may be automatically extracted
from these image data and how this information may be
used to improve guidance systems or procedure analysis
and documentation. Research topics in this context are,
among others, robot-assisted guidance and surgery [1–7],
automated documentation [8–10] or registration of the
optically acquired images or videos to image data obtained
from preprocedure X-ray, computed tomography (CT),
magnetic resonance imaging (MRI) and other medical image
acquisition techniques [11–15].
A key technological advancement that has contributed
to the success of minimally invasive procedures is video
endoscopy. Endoscopy is the most commonly used method
for image-guided minimally invasive procedures, for exam-
ple, colonoscopy, bronchoscopy, laparoscopy, rhinoscopy.
An endoscope is a flexible tube fitted with a camera and
an illumination unit at the tip. Depending on the type
of procedure the tube is inserted into the human body
through either a natural orifice or a small incision. During
the procedure, the performing physician can observe the
endoscopic video data in real-time on a monitor.
Images and videos from minimally invasive medical
procedures largely show tissues of human organs, such
as the mucosa of the gastrointestinal tract. These sur faces
usually have a glossy appearance showing specular highlights
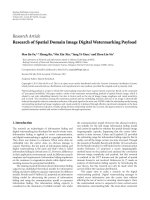
due to specular reflection of the light sources. Figure 1
shows example images extracted from different domains
with typical specular highlights. These image features can
negatively affect the perceived image quality [16]. Further-
more, for many visual analysis algorithms, these distinct
and bright visual features can become a significant source
of error. Since the largest image gradients can usually
be found at the edges of specular highlights, they may
interfere with all gradient-based computer vision and image
analysis algorithms. Similarly, they may also affect texture
based approaches. On the contrary, specular highlights
hold important information about the surface orientation,
if the relative locations of the camera and the illumina-
tion unit are known. Detecting specular highlights may
2 EURASIP Journal on Image and Video Processing
therefore improve the performance of 3D reconstruction
algorithms.
Our area of research is the analysis of endoscopic
video data, in particular from colonoscopy procedures.
Colonoscopy is a video endoscopy of the large intestine
and the currently preferred method for colorectal cancer
screening. Common topics in colonoscopic imaging research
are, among others, the detec tion of polyps and colorectal
cancer [17–20], temporal segmentation and summarisation
of colonoscopy procedures [21–23], image classification
[24–26], image quality enhancement [27]andautomated
procedure quality assessment [28, 29].
Segmentation of specular highlights may be beneficial in
many of these topics. An example is the automatic detection
of colorectal polyps. Colorectal polyps can develop into
cancer if they are not detected and removed. Figure 1(c)
shows an example of a typical colonic polyp. Texture is
one of the important characteristics that are used in their
detection. The specular highlights on the polyp can affect
texture features obtained from the polyp surface and may
therefore imp ede robust detection. A negative effect of
specular highlights was also reported by Oh et al. [26], in the
context of the detection of indistinct frames in colonoscopic
videos. The term indistinct refers to blurry images that occur
when the camera is too close to the intestinal mucosa or is
covered by liquids.
In this paper, we propose: (a) a method for segmentation
of specular highlights based on nonlinear filtering and colour
image thresholding and (b) an efficient inpainting method
that alters the specular regions in a way that eliminates the
negative effect on most algorithms a nd also gives a visually
pleasing result. We also present an application of these
methods in improvement of colour channel misalignment
artefacts removal.
For many applications, the segmentation will be suffi-
cient, since the determined specular areas can simply be
omitted in further computations. For others, it might be
necessary or more efficient to inpaint the highlights. For
example the colour misalignment artefacts as shown in
Figure 1(b) is a major hindrance in many processing algo-
rithms, for example, automated polyp detection. In order
to remove these artefacts the endoscope camera motion
needs to be estimated. Feature point detection and matching
are two pivotal steps in most camera motion estimation
algorithm. Due to the invariance of positions in different
colour channels of the images similar to the one shown in
Figure 1(b), the specular highlights creates a major problem
for any feature matching algorithm and consequently for the
camera motion estimation algorithm.
The paper is organised as follows. Section 2 takes a look
at related work in segmentation of specular highlights, before
the proposed approach is explained in detail in Section 3.
The evaluation of the segmentation method is presented in
Section 4. The proposed inpainting approach is described in
Section 5 along with a brief look at the literature on the topic.
In Section 6 we show how removal of specular highlights
facilitates better performance of other processing algorithms
with the example of colour channel misalignment artefacts.
Section 7 concludes the paper and gives an outlook on future
work.
2. Related Specular Highlights
Segmentation Methods
There exist a number of approaches to segment specular
highlights in images, usually either by detecting grey scale
intensity jumps [30, 31] or sudden colour changes [32, 33]
in an image. This can be seen as detecting the instances,
when the image properties violate the assumption of diffuse
reflection. The problem is also closely related to the detection
of defects in still images or videos, which has been studied
extensively (for an overview, see [34]).
The segmentation and inpainting of sp ecular highlights
was found to be beneficial in the context of indistinct
frame detection in colonoscopic videos [26]. Furthermore,
Cao et al. [35], detected specular highlights to facilitate the
segmentation process in their algorithm for better detection
of medical instruments in endoscopic images. However, this
approach inherently detects only specular highlights of a
specific size.
The algorithm presented in [26] detects specular high-
lights of all sizes and incorporates the idea of detecting
absolutely bright regions in a first step and relatively bright
regions in a second step. This idea fits the problem well, as
most of the specular highlights appear saturated white or
contain at least one saturated colour channel, w hile some,
usually relatively small reflections are not as brig ht and
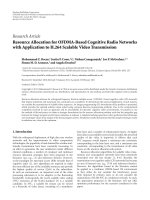
appear as light grey or coloured spots. Figure 2 illustrates
those different typ es of specular highlights.
In their approach, Oh et al. [26], first converted the image
to the HSV colour space (Hue, Saturation, Value). To obtain
the absolutely bright regions, they used two thresholds, T
v
and T
s
,onvalue(v) and saturation (s), respectively, and
classified a pixel at location x as absolutely bright,ifitsatisfied
the following conditions:
s
(
x
)
<T
s
, v
(
x
)
>T
v
.
(1)
After this step, the image was segmented into regions of
similar colour and texture using the image segmentation
algorithm presented in [36], which involves colour quanti-
sation and region growing and merging at multiple scales.
Within those regions, relatively bright pixels were found
using (1) with the same saturation threshold T
s
and a value
threshold T
∗
v
(k) = Q3(k)+1.5 · IQR(k), computed for each
region k using the 75th percentile Q3(k) and the interquartile
range IQR(k) of the values in that region. The union of the
set of the absolutely bright pixels as computed in the first step
and the set of the relatively bright pixels as obtained through
the second step are considered as the set of the specular
highlight pixels.
A disadvantage of this method is the high computational
cost of the segm entation algorithm. Another issue is the
choice of the colour space. Many endoscopy units nowadays
use sequential RGB image acquisition. In this technique,
the colour image is composed of three monochromatic
images taken at different time instances under subsequent
EURASIP Journal on Image and Video Processing 3
(a) (b) (c)
Figure 1: Examples of images from minimally invasive medical procedures showing specular highlights. (a) Laparoscope image of the
appendix, (b) Colonoscopic image with specularity and colour channel misalignment due to sequential RGB endoscopic system, (c)
Colonoscopic image showing a colonic polyp.
Figure 2: Example illustrating absolutely bright (green) and
relatively bright (yellow) specular highlights.
red, green and blue illumination. While this allows for an
increase in image resolution, it has the disadvantage that fast
camera motion leads to misalignment of the colour channels
(Figure 1(b)). Consequently, specular highlights can appear
either white or highly saturated red, green or blue. The
fact that the method presented in [26] only detects specular
highlights by thresholding the value and saturation channels,
makes it less applicable to sequential RGB systems. In
Section 4 we evaluate the proposed method against the one
proposed by Oh et al. which we implemented as described in
[26].
3. Proposed Specular Highlights
Segmentation Method
The proposed segmentation approach comprises two sep-
arate modules that make use of two related but different
characteristics of specular highlights.
3.1. Module 1. The first module uses colour balance adaptive
thresholds to determine the parts of specular highlights that
show a too high intensity to be part of the nonspecular
image content. It assumes that the colour range of the
nonspecular image content is well within the dynamic range
of the image sensor. The automatic exposure correction of
endoscope systems is generally reliable in this respect, so the
image very rarely shows significant over- or underexposure.
In order to maintain compatibility with sequential RGB
imaging systems, we need to detect specular highlights even
if the y only occur in one colour channel. While this suggests
3 independent thresholds for each of the 3 colour channels,
we set one fixed grey scale threshold and compute the colour
channel thresholds using available image information.
More specifically, the colour channels may have intensity
offsets due to colour balancing. At the same time the actual
intensity of the specular highlights can be above the point
of saturation of all three colour channels. Therefore, we
normalise the green and blue colour channels, c
G
and c
B
,
according to the ratios of the 95th percentiles of their
intensities to the 95th percentile of the grey scale intensity
for every image, which we computed as c
E
= 0.2989 · c
R
+
0.5870
·c
G
+0.1140·c
B
,withc
R
being the red colour channel.
Using such high percentiles compensates for colour balance
issues only if they show in the very high intensity range,
which results in a more robust detection for varying lighting
and colour balance. The reason why we use the grey scale
intensity as a reference instead of the dominating red channel
is the fact that intense reddish colours are very common
in colonoscopic videos and therefore a red intensity close
to saturation occurs not only in connection with specular
highlights. We compute the colour balance ratios as follows:
r
GE
=
P
95
(
c
G
)
P
95
(
c
E
)
,
r
BE
=
P
95
(
c
B
)
P
95
(
c
E
)
,
(2)
with P
95
(·) being the 95th percentile. Using these ratios, any
given pixel x
0
is marked as a possible specular highlight when
the following condition is met:
c
G
(
x
0
)
>r
GE
· T
1
∨ c
B
(
x
0
)
>r
BE
· T
1
∨ c
E
(
x
0
)
>T
1
.
(3)
4 EURASIP Journal on Image and Video Processing
(a) (b)
Figure 3: Example of a colonoscopic image before and after median filtering.
(a) (b)
(c) (d)
Figure 4: Illustration of the area that is used for the gradient test. (a) original image. (b) detected specular highlights. (c) contour areas for
the gradient test, (d) resulting specular highlights after the gradient test.
3.2. Module 2. The second module compares every given
pixel to a smoothed nonspecular surface colour at the pixel
position, which is estimated from local image statistics. This
module is aimed at detecting the less intense parts of the
specular hig hlights in the image. Looking at a given pixel, the
underlying nonspecular surface colour could be estimated
as a colour representative of an area surrounding the pixel,
if it was know n that this area does not contain specular
highlights or at least which pixels in the area lie on specular
highlights. Although we do not know this exactly, we can
obtain a good estimate using global image thresholding and
an outlier resilient estimation of the representative colour.
Once this representative colour is computed, we determine
the class of the current pixel from its dissimilarity to this
colour.
The algorithm is initialised by an image thresholding step
similar to the one in the first module: Using a slightly lower
threshold T
abs
2
, pixels with high intensity are detected using
the condition in (3). The pixels meeting this condition are
likely to belong to specular highlights, which is one part of
EURASIP Journal on Image and Video Processing 5
the information we need. The actual computation of the
representative colour is performed by a modified median
filter. Similar nonlinear filters have been successfully used
in defect detection in images and video (see, e.g., [37, 38]),
which is a closely related problem. The median filter was
chosen for its robustness in the presence of outliers and its
edge preserving character, both of which make it an ideal
choice for this task.
We incorporate the information about the location of
possible specular highlights into the median filter by filling
each detected specular region with the centroid of the colours
of the pixels in an area within a fixed distance range from
the contour of the reg ion. We isolate this area of interest
by exclusive disjunction of the masks obtained from two
different dilation operations on the mask of possible specular
highlight locations. For the dilation we use disk shaped
structuring elements with radii of 2 pixels and 4 pixels,
respectively. The same concept of filling of the specular
highlights is also used in the proposed image inpainting
method, which is described in Section 5.
We then perform median filtering on this modified
image. Filling possible specular highlights with a represen-
tative colour of their surrounding effectively prevents the
filtered image to appear too bright in regions where specular
highlights cover a large area. Smaller specular highlights
are effectively removed by the median filter when using a
relatively large window size w. Figure 3 shows an example of
the output of the median filter.
Following this, specular highlights are found as positive
colour outliers by comparing the pixel values in the input
and the median filtered image. For this comparison, several
distance measures and ratios are possible. Examples of such
measures are the euclidean distance in RGB space or the
infinity norm of the differences. During evaluation we found
that the maximal ratio of the three colour channel intensities
in the original image and the median filtered image produces
optimal results. For each pixel location x, this intensity ratio
max
is computed as
max
(
x
)
= max
c
R
(
x
)
c
∗
R
(
x
)
,
c
G
(
x
)
c
∗
G
(
x
)
,
c
B
(
x
)
c
∗
B
(
x
)
,(4)
with c
∗
R
(x), c
∗
G
(x), and c
∗
B
(x) being the intensities of the red,
green and blue colour channel in the median filtered image,
respectively. Here again, varying colour balance and contrast
can lead to large variations of this characteristic for different
images. These variations are compensated using a contrast
coefficient τ
i
, which is calculated for each of the 3 colour
channels for every given image as
τ
i
=
c
i
+ s(c
i
)
c
i
−1
, i ∈{R, G, B},
(5)
with
c
i
being the sample mean of all pixel intensities in colour
channel i and s(c
i
) being the sample standard deviation.
Using these coefficients, we modify (4) to obtain the contrast
compensated intensity ratio
max
as follows:
max
(
x
)
= max
τ
R
·
c
R
(
x
)
c
∗
R
(
x
)
, τ
G
·
c
G
(
x
)
c
∗
G
(
x
)
, τ
B
·
c
B
(
x
)
c
∗
B
(
x
)
. (6)
Using a threshold T
rel
2
for this relative measure, the pixel at
location x is then classified as a specular highlight pixel, if
max
(
x
)
>T
rel
2
.
(7)
At this point the outputs of the first and second module
are joined by logical disjunction of the resulting masks. The
two modules complement each other well: The first module
uses a global threshold and can therefore only detect the very
prominent and bright specular highlights. The less promi-
nent ones are detected by the second module by looking at
relative features compared to the underlying surface colour.
With a higher dynamic range of the image sensor, the second
module alone would lead to good results. However, since the
sensor saturates easily, the relative prominence of specular
highlig hts becomes less intense the brighter a given area of
an image is. It is these situations in which the first module
still allows detection.
3.3. Postprocessing. During initial tests we noticed that some
bright regions in the image are mistaken for specular
highlights by the algorithm presented so far. In particular,
the mucosal surface in the close vicinity of the camera can
appear saturated without showing specular reflection and
may therefore be picked up by the detection algorithm.
To address this problem, we made use of the property,
that the image area surrounding the contour of specular
highlights generally shows strong image gradients. Therefore,
we compute the mean of the gradient magnitude in a stripe-
like area within a fixed distance to the contours of the
detected specular regions. Using this information, only those
specular regions are retained, whose corresponding contour
areas meet the condition
1
N
N
n=1
grad
(
E
n
)
>T
3
∧ N>N
min
,
(8)
with
|grad(E
n
)| being the grey scale gradient magnitude of
the nth out of N pixels of the contour area corresponding to
a given possible specular region. N
min
is a constant allowing
to restrict the computation to larger specular regions, as the
problem of nonspecular saturation occurs mainly in large
uniform areas. The gradient is approximated by vertical
and horizontal differences of directly neighbouring pixels.
Figure 4 illustrates the idea. Using this approach, bright,
nonspecular regions such as the large one on the right in
Figure 4(a), can be identified as false detections.
In the presence of strong noise it can happen that single
isolated pixels are classified as specular highlights. These are
at this stage removed by morphological erosion. The final
touch to the algorithm is a slightly stronger dilation of the
resulting binary mask, which extends the specular regions
more than it would be necessary to compensate for the
erosion. This step is motivated by the fact that the transition
from specular to nonspecular areas is not a step function
but spread due to blur induced by factors such as motion or
residues on the camera lens. The mask is therefore slightly
extended to better cover the spread out regions.
6 EURASIP Journal on Image and Video Processing
Table 1: Performance of the algorithm for equal costs of false positives and false negatives. Compared to the method in [26] with dilation
the proposed method achieves a cost reduction of 28.16%.
Method Cost Accuracy [%] Precision [%] Sensitivity [%] Specificity [%]
Method of Oh et al. 8070 96.83 87.76 37.27 99.25
Method of Oh et al. with Dilation 6473 97.35 86.66 53.34 99.14
Proposed Method 4650 98.33 81.29 75.31 99.28
Table 2: Performance of the algorithm for doubled costs of false negatives. Compared to the method in [26] with dilation the proposed
method achieves a cost reduction of 31.03%.
Method Cost Accuracy [%] Precision [%] Sensitivity [%] Specificity [%]
Method of Oh et al. 15400 96.70 86.15 39.94 99.01
Method of Oh et al. with Dilation 10271 97.05 68.85 69.09 98.13
Proposed Method 7084 97.90 70.23 83.78 98.51
4. Evaluation of the Segmentation Method
In order to evaluate the proposed algorithm a large ground
truth dataset was created by manually labelling a set of 100
images from 20 different colonoscopy videos. Since negative
effects of specular highlights on image analysis algorithms are
mostly due to the strong gradients along their contours, the
gradient magnitudes were computed using a Sobel operator
and overlayed on the images. This allowed the manual
labelling to be very precise on the contours. Great care was
taken in including the contours fully in the marked specular
regions.
In order to compare the performance of the proposed
algorithm with the state of the art, we implemented the
approach proposed by Oh et al. as described in [26], which
was also proposed for detection of specular highlights in
endoscopic images. Both methods were assessed by their
performance to classify the pixels of a given image into either
specular highlight pixels or other pixels.
Using the aforementioned data set, we evaluated both
methods using a cross-validation scheme where in each
iteration the images of one video were used as the test set
and the rest of the images were used as the tr aining set.
For each iteration we optimised the parameters of both the
method in [26] and the proposed one using the training
set and tested their performance on the test set. At any
point no information about the test image was used in
the optimizing process of the parameters. We chose two
different cost scenarios to measure optimal performance:
scenario A assigned equal costs (unit per misclassified pixel)
to missed specular highlights and falsely detected specular
highlights; scenario B assigned twice the cost to missed
specular highlights (2 units per missed specular highlig ht
pixel).
The results are reported in Tables 1 and 2 with the
resulting cost and the commonly used measures accuracy,
precision, sensitivity and specificity [39], for the two cost
scenarios, averaged over the 20 cross-validation iterations.
We report two different variants of the method in [26].
One is the original method as it was reported in [26].
The second method is equivalent to the first, followed by
a dilation similar to one in the postprocessing step of the
proposed method. This was considered appropriate and
necessary for a better comparison of the two methods,
because in our understanding of the extent of specular
highlights, any image gradient increase due to the contours
of the specular highlights is to be included during labelling,
while the definition in [26] was motivated by a purely visual
assessment. The overall improvement resulting from this
modification, as it can be seen in Tables 1 and 2,supports
this interpretation.
It can be seen that the proposed method outperforms the
one presented in [26] substantially with a cost reduction of
28.16% and 31.03% for cost scenario A and B, respectively.
Furthermore, the proposed algorithm was able to process
2.34 frames per second on average on a 2.66 GHz Intel
Core2Quad system—a speed improvement of a factor of
23.8 over the approach presented in [26], which is heavily
constrained by its image segmentation algorithm. It took
10.18 seconds on average to process an image. The results are
visually depicted in Figure 6.
While the parameters were optimised for each iteration
of the cross-validation scheme, they varied only marginally.
For images with similar dimensions (in the vicinity of 528
×
448) to the ones used in this study, we recommend to use the
following parameters for cost scenario A (cost scenario B):
T
1
= 245(240), T
abs
2
= 210(195), T
rel
2
= 0.95(1.00), median
filter window size w
= 30(33), N
min
= 9460(9460), T
3
=
4(5). The size of the structuring element for the dilation in
the postprocessing step should be 3 and 5 for cost scenario A
and B, respectively.
5. Inpainting of Specular Highlights
Image inpainting is the process of restoring missing data in
still images and usually refers to interpolation of the missing
pixels using information of the surrounding neighbourhood.
An overview over the commonly used techniques can be
found in [40] or, for video data, in [34].
For most applications in automated analysis of endo-
scopic videos, inpainting will not be necessary. The informa-
tion about specular highlights will be used directly (in algo-
rithms exploiting this knowledge), or the specular regions
will simply be excluded from further processing. However,
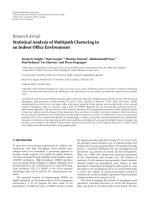
EURASIP Journal on Image and Video Processing 7
(a) Original image
(b) Image section showing the specular
highlights
(c) Gaussian filtered, filled image section
(d) Detected specular highlights (e) Weighting mask (f) Inpainted image section
Figure 5: Stages of the inpainting algorithm.
astudybyVogtetal.[16], suggests that well-inpainted
endoscopic images are preferred by physicians over images
showing specular highlights. Algorithms with the intention
of visual enhancement may therefore benefit from a visually
pleasing inpainting strategy, as well as algorithms working
in the frequency domain. Vogt et al. also [16] proposed an
inpainting method based on temporal information and can
be only used for a sequence of frames in a video and not for
isolated individual images.
An inpainting method was reported by Cao et al. in [35].
The authors replaced the pixels inside a sliding rectangular
window by the average intensity of the window outline, once
the window covered a specular highlight. The approach can
not be used universally, as it is matched to the specular
highligh t segmentation algorithm presented in the same
paper.
In [26], along with their specular highlight segmentation
algorithm, the authors also reported an image inpainting
algorithm, where they replaced each detected specular high-
light by the average intensity on its contour. A problem with
this approach is that the resulting hard transition between
the inpainted regions and their surroundings may again lead
to strong gradients.
In order to prevent these artefacts, in the proposed
algorithm, the inpainting is performed on two levels. We
first use the filling technique presented in Section 3,where
we modify the image by replacing all detected specular
highlights by the centroid colour of the pixels within a
certain distance range of the outline (see above for details).
Additionally, we filter this modified image using a Gaussian
kernel (σ
= 8), which results in a strongly smoothed image
c
sm
free of specular highlights, which is similar to the median
filtered image in the segmentation algorithm.
For the second level, the binary mask marking the
specular regions in the image is converted to a smooth
weighting mask. The smoothing is performed by adding a
nonlinear decay to the contours of the specular regions. The
weights b of the pixels surrounding the specular hig hlights
in the weighting mask are computed depending on their
euclidean distance d to the contour of the specular highlight
region:
b
(
d
)
=
1+exp
(
l
max
− l
min
)
·
d
d
max
c
+ l
min
−1
,
d
∈
[
0, d
max
]
,
(9)
which can be interpreted as a logistic decay function in a
window from l
min
to l
max
, mapped to a distance range from
0tod
max
. The constant c can be used to introduce a skew on
the decay function. In the examples in this paper, we use the
parameters l
min
=−5, l
max
= 5, d
max
= 19 and c = 0.7.
The resulting integer valued weighting mask m(x)(see,
e.g., Figure 5(e)) is used to blend between the original image
c(x) and the smoothed filled image c
sm
(x). The smoothing
of the mask results in a gradual transition between c(x)
and c
sm
(x). Figure 5 illustrates the approach by showing the
relevant images and masks.
8 EURASIP Journal on Image and Video Processing
(a) (b) (c) (d)
(e) (f) (g) (h)
Figure 6: Examples illustrating the performance of the specular highlight segmentation algorithm. Original images are shown in the first
column. The second column contains the ground truth images, the third column shows the results of the method presented in [26] and in
the fourth column the results achieved by the proposed algorithm are depicted.
(a) (b) (c)
(d) (e) (f)
Figure 7: Examples illustrating the performance of the inpainting algorithm. Original images are shown in the first column. The second
column contains images which were inpainted using the proposed method and the third column shows the results of the method presented
in [26]. The segmentation of specular highlights prior to inpainting was performed using the proposed segmentation algorithm.
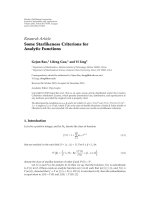
EURASIP Journal on Image and Video Processing 9
(a) (b)
(c) (d)
Figure 8: The results of colour channel realignment algorithm in Datasets 1 (a, b) and 2 (c, d). (a, c): the original images. (b, d): the resulting
images after the colour channel misalignment artefacts are removed.
The inpainted image c
inp
is computed for all pixel lo-
cations x using the following equation:
c
inp
(
x
)
= m
(
x
)
· c
sm
(
x
)
+
(
1
− m
(
x
))
· c
(
x
)
,
(10)
with m(x)
∈ [0, 1] for all pixel locations x.
Figure 7 shows a number of images before and after
inpainting and a comparison to inpainting method reported
in [26]. It can be seen that the proposed inpainting method
produces only minor artefacts for small specular highlights.
Very large specular regions, however, appear strongly
blurred. This is an obvious consequence from the Gaussian
smoothing. For more visually pleasing results for large
specular areas, it would be necessary to use additional
features of the surroundings, such as texture or visible
contours. However , such large specular regions are rare in
clear colonoscopic images and errors arising from them
can therefore usually be neglected. The performance
of the combination of the presented segmentation
and inpainting algorithms can be seen in an example
video which is available online in the following website:
/>PAGE SPECU
PAPER/.
6. Specular Highlights and Colour Channel
Misalignment Artefacts
Sequential RGB image acquisition systems are very com-
monly used in endoscopy. In these systems the images
corresponding to the red (R), the g reen (G) and the blue
(B) colour channels are acquired at different time instances
and merged to form the resulting video frame. However,
an inherent technological shortcoming of such systems is:
whenever the speed of the camera is high enough such that
it moves significantly in the time interval between the acqui-
sition instances of the images corresponding to two colour
channels, they get misaligned in the resulting video frame,
compare, Figure 1(b). This channel misalignment gives the
images an unnatural, highly colourful, and stroboscopic
appearance, which degrades the overall video quality of
the minimally invasive procedures. Moreover, in endoscopic
images, the colour is an invariant characteristic for a given
status of the organ [41]. Malignant tumors are usually
inflated and inflamed. This inflammation is usually reddish
and more severe in colour than the surrounding tissues.
Benign tumors exhibit less intense colours. Hence the colour
is one of the important features used both in clinical and
automated detection of lesions [42]. Consequently, removal
of these artefacts is of high importance both from the clinical
and the technical perspect ives.
10 EURASIP Journal on Image and Video Processing
Table 3: Performance of the colour channel misalignment artefact
removal algorithm in images before and after removing specular
highlights. SR: percentage of images where the colour channels
were successfully realigned. USRND: percentage of images where
the colour channels were not successfully realigned, however
they were not distorted. USRD: percentage of images where the
colour channels were not successfully realigned and they were
also distorted. Dataset 1: 50 colonoscopy video frame with colour
channel misalignment. Dataset 2: Dataset 1 after specular highlights
are removed by the proposed algorithm.
Dataset SR [%] USRND [%] USRD [%]
Dataset 1 78 18 4
Dataset 2 84 14 2
We developed an algorithm to remove these colour
channel misalignment artefacts as fol lows. Let c
B
, c
R
, c
G
be
the three colour channels of a given endoscopy video frame.
The developed algorithm to remove the colour misalignment
artefacts comprises the following key steps.
(i) Compute the Kullback-Leibler divergence, d
KL
,be-
tween the intensity histograms of the colour chan-
nels, denoted as: d
KL
(h
c
i
, h
c
j
), i
/
= j,foralli, j ∈
{
R, G, B}. h
c
i
is the intensity histogram correspond-
ing to colour channel i. Choose the colour channels i
and j, for which the d
KL
is minimum.
(ii) Compute the homography (H
c
i
c
j
) between the cho-
sen colour channels i and j, through feature match-
ing. Assume linear ity of motion and compute the
homography between consecutive colour channels,
H
c
i
c
j
, i, j ∈{R, G, B}.
(iii) Align all the colour channels by using the inverse
homography, H
−1
c
i
c
j
, i, j ∈{R, G, B}.
We tested the algorithm with 50 colonoscopy video
frames before (Dataset 1)andafter(Dataset 2) removing
specular highlights. The measures used to evaluate the algo-
rithm are as follows: ( a) percentage of images where colour
channels were successfully realigned (SR), (b) percentage
of images where colour channels were not successfully
realigned but they were not distorted either (USRND),
(c) percentage of images where colour channels were not
successfully realigned moreover they were also distorted
(USRD). Successful realignment and distortion of the images
were evaluated using visual inspection. The results of the
evaluation are shown in Table 3 andvisualizedinFigure 8.
We see a substantial improvement when specular highlights
are removed.
7. Discussion
In this paper, we have presented methods for segmenting and
inpainting specular highlights. We have argued that specular
highlights can negatively affect the perceived image quality.
Furthermore, they may be a significant source of error,
especially for algorithms that make use of the gradient infor-
mation in an image. The proposed segmentation approach
showed a promising performance in the detailed evaluation.
It performed favourably to the approach presented in [26]
and avoids any initial image segmentation, thus resulting
in significantly shorter computation time (a reduction by
a factor of 23.8 for our implementation). Furthermore,
in contrast to other approaches, the proposed segmenta-
tion method is applicable to the widely used sequential
RGB image acquisition systems. In the sequential RGB
endoscope, a very common problem is the colour channel
misalignment artefacts. We developed a simple algorithm
to remove these artefacts and tested it using colonoscopy
video frames before and after removing specular highlight.
A substantial improvement in the performance was observed
when specular highlights are removed. The performance of
the proposed inpainting approach was demonstrated on a set
of images and compared to the inpainting method proposed
in [26].
When using inpainting in practice, it is important to
keep the users informed that specular highlights are being
suppressed and to allow for disablement of this enhance-
ment. For example, while inpainting of specular highlights
may help in detecting polyps (both for human observers and
algorithms) it could make their categorisation more difficult,
as it alters the pit-pattern of the polyp in the vicinity of the
specular highlight. Also, as it can be seen in the second row
of Figure 7, inpainting can have a blurring effect on medical
instruments. Explicit detection of medical instruments may
allow to prevent these artefacts and will be considered in
future studies.
Future work will also include a clinical study into
whether endoscopists prefer inpainted endoscopic videos
over standard ones. We will further investigate to what
degree other image analysis algorithms for endoscopic videos
benefit from using the proposed methods as preprocessing
steps.
Acknowledgments
This work has been supported by the Enterprise Ireland
Endoview project CFTD-2008-204. Thea authors would also
like to acknowledge the support from National Development
Plan, 2007-2013, Ireland.
References
[1] G. N. Khan and D. F. Gillies, “Vision based navigation system
for an endoscope,” Image and Vision Computing, vol. 14, no.
10, pp. 763–772, 1996.
[2] C. K. Kwoh, G. N. Khan, and D. F. Gillies, “Automated
endoscope navigation and advisory system from medical
imaging,” in Medical Imaging: Physiology and Function from
Multidimensional Images, vol. 3660 of Proceedings of SPIE,pp.
214–224, 1999.
[3] S. J. Phee, W. S. Ng, I. M. Chen, F. Seow-Choen, and B. L.
Davies, “Automation of colonoscopy part II. visual-control
aspects: interpreting images with a computer to automatically
maneuver the colonoscope,” IEEE Engineering in Medicine and
Biology Magazine, vol. 17, no. 3, pp. 81–88, 1998.
[4] L. E. Sucar and D. F. Gillies, “Knowledge-based assistant for
colonscopy,” in Proceedings of the 3rd International Conference
EURASIP Journal on Image and Video Processing 11
on Industrial and Engineering Applications of Artific ial Intel-
ligence and Expert Systems (IEA/AIE ’90), pp. 665–672, July
1990.
[5] D. R. Uecker, C. Lee, Y. F. Wang, and Y. Wang, “Auto-
mated instrument tracking in robotically assisted laparoscopic
surgery,” Journal of Image Guided Surgery,vol.1,no.6,pp.
308–325, 1995.
[6] S. Voros, J. A. Long, and P. Cinquin, “Automatic detection of
instruments in laparoscopic images: a first step towards high-
level command of robotic endoscopic holders,” International
Journal of Robotics Research, vol. 26, no. 11-12, pp. 1173–1190,
2007.
[7] Y. F. Wang, D. R. Uecker, and Y. Wang, “A new framework
for vision-enabled and robotically assisted minimally invasive
surgery,” Computerized Medical Imaging and Graphics, vol. 22,
no. 6, pp. 429–437, 1998.
[8] Y. Cao, D. Li, W. Tavanapong, J. Oh, J. Wong, and P. C. de
Groen, “Parsing and browsing tools for colonoscopy videos,”
in Proceedings of the 12th ACM International Conference on
Multimedia (Multimedia ’04), pp. 844–851, October 2004.
[9] J. P. S. Cunha, M. Coimbra, P. Campos, and J. M. Soares,
“Automated topographic segmentation and transit time esti-
mation in endoscopic capsule exams,” IEEE Transactions on
Medical Imaging, vol. 27, no. 1, pp. 19–27, 2008.
[10] D. K. Iakovidis, S. Tsevas, D. Maroulis, and A. Polydorou,
“Unsupervi sed summarisation of capsule endoscopy video,” in
Proceedings of the 4th International IEEE Conference Intelligent
Systems (IS ’08), pp. 315–320, September 2008.
[11] D. Burschka, M. Li, R. Taylor, and G. D. Hager, “Scale-
invariant registration of monocular endoscopic images to CT-
scans for sinus surgery,” in Proceedings of the 7th International
Conference on Medical Image Computing and Computer-
Assisted Intervention (MICCAI ’04), vol. 3217 of Lecture Notes
in Computer Science, pp. 413–421, 2004.
[12] P. Gross, R. I. Kitney, S. Claesen, and J. M. Halls,
“Mr-compatible endoscopy and tracking for image-guided
surgery,” in Proceedings of the 15th International Congress and
Exhibition of Computer Assisted Radiolog y and Surgery, vol.
1230, pp. 1076–1082, 2001.
[13] J. Liu, T. Yoo, K. Subramanian, and R. Van Uitert, “A stable
optic-flow based method for tracking colonoscopy images,”
in Proceedings of the IEEE Computer Society Conference on
Computer Vision and Pattern Recognition Workshops (CVPR
’08), pp. 1–8, June 2008.
[14] K. Mori, D. Deguchi, J. Hasegawa et al., “A method for tracking
the camera motion of real endoscope by epipolar geometry
analysis and virtual endoscopy system,” in Proceedings of the
International Conference on Medical Image Computing and
Computer-Assisted Intervention (MICCAI ’06), pp. 1–8, 2001.
[15] C. Wengert, P. C. Cattin, J. M. Duff,C.Baur,andG.
S
´
zekely, “Markerless endoscopic registration and referencing,”
in Proceedings of the International Conference on Medical Image
Computing and Computer-Assisted Intervention (MICCAI ’06),
vol. 4190, pp. 816–823, 2006.
[16] F. Vogt, D. Paulus, B. Heigl et al., “Making the invisible visible:
highlight substitution by color light fields,” in Proceedings of
the 1st European Conference on Colour in Graphics, Imaging,
and Vision (CGIV ’02), pp. 352–357, April 2002.
[17] M. T. Coimbra and J. P. S. Cunha, “MPEG-7 visual
descriptors—contributions for automated feature extraction
in capsule endoscopy,” IEEE Transactions on Circuits and
Systems for Video Technology, vol. 16, no. 5, pp. 628–636, 2006.
[18]A.N.Esgiar,R.N.G.Naguib,B.S.Sharif,M.K.Bennett,
and A. Murray, “Fractal analysis in the detection of colonic
cancer images,” IEEE Transactions on Information Technology
in Biomedicine, vol. 6, no. 1, pp. 54–58, 2002.
[19] S. A. Karkanis, D. K. Iakovidis, D. E. Maroulis, D. A.
Karras, and M. Tzivras, “Computer aided tumor detection
in endoscopic video u sing color wavelets features,” IEEE
Transactions on Information Technology in Biomedicine, vol. 7,
no. 3, pp. 141–152, 2003.
[20] D. E. Maroulis, D. K. Iakovidis, S. A. Karkanis, and D.
A. Karras, “Cold: a versatile detection system for colorectal
lesions in endoscopy video-frames,” Computer Methods and
Programs in Biomedicine, vol. 70, no. 2, pp. 151–166, 2003.
[21] Y. Cao, W. Tavanapong, K. Kim, J. Wong, J. Oh, and P.
C. de Groen, “A framework for parsing colonoscopy videos
for semantic units,” in Proceedings of the IEEE International
Conference on Multimedia and Expo (ICME ’04), vol. 3, pp.
1879–1882, June 2004.
[22] J. Oh, M. A. Rajbal, J. K. Muthukudage, W. Tavanapong,
J. Wong, and P. C. de Groen, “Real-time phase boundary
detection in colonoscopy videos,” in Proceedings of the 6th
International Symposium on Image and Signal Processing and
Analysis (ISPA ’09), pp. 724–729, September 2009.
[23] D. Liu, Y. Cao, W. Tavanapong, J. Wong, J. Oh, and P. C.
de Groen, “Mining colonoscopy videos to measure quality of
colonoscopic procedures,” in Proceedings of the 5th IASTED
International Conference on Biomedical Eng ineering (BioMED
’07), pp. 409–414, February 2007.
[24] M.Arnold,A.Ghosh,G.Lacey,S.Patchett,andH.Mulcahy,
“Indistinct frame detection in colonoscopy videos,” in Pro-
ceedings of the 13th International Machine Vision and Image
Processing Conference (IMVIP ’09), pp. 47–52, September
2009.
[25] M. P. Tjoa and S. M. Krishnan, “Texture-based quantitative
characterization and analysis of colonoscopic images,” in
Proceedings of Annual International Conference of the IEEE
Engineering in Medicine and Biology, vol. 2, pp. 1090–1091,
Houston, Tex, USA, October 2002.
[26] J.Oh,S.Hwang,J.Lee,W.Tavanapong,J.Wong,andP.C.de
Groen, “Informative frame classification for endoscopy video,”
Medical Image Analysis, vol. 11, no. 2, pp. 110–127, 2007.
[27]R.Dahyot,F.Vilari
˜
no, and G. Lacey, “Improving the quality
of color colonoscopy videos,” EURASIP Journal on Image and
Video Processing, vol. 2008, Ar ticle ID 139429, 7 pages, 2008.
[28] D. Liu, Y. Cao, W. Tavanapong, J. Wong, J. Oh, and P. C.
de Groen, “Quadrant coverage histogram: a new method for
measuring quality of colonoscopic procedures,” Proceedings
of the 29th Annual International Conference of the IEEE
Engineering in Medicine and Biology Society, vol. 2007, pp.
3470–3473, 2007.
[29] J. Oh, S. Hwang, Y. Cao et al., “Measuring objective quality
of colonoscopy,” IEEE Transactions on Biomedical Engineering,
vol. 56, no. 9, pp. 2190–2196, 2009.
[30] K. Forbus, “Light source effects,”Tech.Rep.AIMemoAIM-
422, Massachusetts Institute of Technology, 1977.
[31] G. Brelstaff and A. Blake, “Detecting specular reflections using
lambertian constraints,” in Proceedings of the 2nd International
Conference on Computer Vision, pp. 297–302, 1988.
[32] R. Gershon, A. D. Jepson, and J. K. Tsotsos, “The use of
color in highlight identification,” in Proceedings of the 10th
International Joint Conference on Artificial Intelligence, vol. 2,
pp. 752–754, 1987.
[33] G. Klinker, S. Shafer, and T. Kanade, “Using a color reflection
model to separate highlights from object color,” in Proceedings
of the 1st International Conference on Computer Vision,pp.
145–150, 1987.
12 EURASIP Journal on Image and Video Processing
[34] A. C. Kokaram, “On missing data treatment for degraded
video and film archives: a survey and a new Bayesian
approach,” IEEE Transactions on Image Processing, vol. 13, no.
3, pp. 397–415, 2004.
[35] Y. Cao, D. Liu, W. Tavanapong, J. Wong, J. Oh, and P. C. de
Groen, “Computer-aided detection of diagnostic and thera-
peutic operations in colonoscopy videos,” IEEE Transactions
on Biomedical Engineering , vol. 54, no. 7, pp. 1268–1279, 2007.
[36] Y. Deng and B. S. Manjunath, “Unsupervised segmentation of
color-texture regions in images and video,” IEEE Transactions
on Pattern Analysis and Machine Intelligence, vol. 23, no. 8, pp.
800–810, 2001.
[37] E. Decenci
`
ere, “Motion picture restoration using morpholog-
ical tools,” in Mathematical Morphology and Its Applications to
Image and Signal Processing,P.Maragos,R.W.Schafer,and
M. A. Butt, Eds., pp. 361–368, Kluwer Academic Publishers,
Norwell, Mass, USA, 1996.
[38] O. Buisson, B. Besserer, S. Boukir, and F. Helt, “Deterioration
detection for digital film restoration,” in Proceedings of the
IEEE Computer Society Conference on Computer Vision and
Pattern Recognition, pp. 78–84, June 1997.
[39] J. Han and M. Kamber, Data Mining: concepts and Techniques,
Morgan Kaufmann, San Francisco, Calif, USA, 2006.
[40] T. K. Shih and R. C. Chang, “Dig ital inpainting—survey and
multilayer image inpainting algorithms,” in Proceedings of the
3rd International Conference on Information Technology and
Applications (ICITA ’05), vol. 1, pp. 15–24, July 2005.
[41] Paris Workshop Participants, “The Paris endospcopic clas-
sification of superficial neoplastic lesions,” Gastrointestinal
Endoscopy, vol. 58, no. 6, pp. 3–23, 2003.
[42] S. A. Karkanis, D. K. Iakovidis, D. E. Maroulis, D. A.
Karras, and M. Tzivras, “Computer aided tumor detection
in endoscopic video u sing color wavelets features,” IEEE
Transactions on Information Technology in Biomedicine, vol. 7,
no. 3, pp. 141–152, 2003.