Advanced Microwave and Millimeter Wave Technologies Devices, Circuits and Systems Part 16 docx
Bạn đang xem bản rút gọn của tài liệu. Xem và tải ngay bản đầy đủ của tài liệu tại đây (1.96 MB, 40 trang )
AdvancedMicrowaveandMillimeterWave
Technologies:SemiconductorDevices,CircuitsandSystems592
The D and H main trams of bioelectric impulse in neurons (Fig. 2) are controlled by the well
known Hodgkin & Huxley (HH) equation (Hodgkin and Huxley, 1952). This equation has
been usually referred to an equivalent electric circuit of in parallel conductances, membrane
capacitance,
C
m
and DC generators, the latter being mainly the Nernst equilibrium Na
+
and
K
+
e.m.f., E
Na
and E
K
, due to the ions electrochemical gradients (other e.m.f. are due to Ca
2+
and Cl
-
ions). Consideration of this network by meshes does not allow its easy solution, and
we will consider the membrane as a Kirchoff knot where the currents concur (Fig. 3).
Therefore HH equation in the presence of an applied magnetic field, B
eff
,
takes the knot law
of charge conservation (no charge accumulation in membrane),
0t,BIVVgEVtngEVthtmgdtdVC
effCaLLK
4
KNa
3
Nam
, (1)
where V is the transmembrane voltage, g
i
(i =Na, K, L) the channels conductances. m and n
are the HH channel excitatory and h inhibitory functions, of microscopic origin not yet well
known, although the phenomenological needed powers four, point out to four independent
processes, acting for the opening (m, n) and closing (h) of corresponding channels. Leakage
channels and voltage/ligand operated ones are probably responsible for the setting of the
threshold voltage, V
s
but current through them is weak and here neglected. Finally, for our
purpose, HH currents have been supplemented by the Ca
2+
current produced by MF (HH
magnetic (HHM) equation) as we shall discuss below. We will solve eq.[1] in the relaxation
time,
, approximation for the HH functions, where e.g. we assume that
K
τtndtdn
(2)
where n(t) is assumed to be proportional to the number of K
+
-channels which remain closed
at time t. Integration of [2] taking t = 0 at the beginning of R process plus H process, yields
K0
τtexpntn . Similarly taking t = 0 at the beginning of D process we obtain that
function
Na0
τtexpmtm . Otherwise the inhibition function at D process follows the
equation
inh
τthdtdh , of integral
inh0
τtexphth . We will now obtain the
membrane voltage V (t) dependence, partitioning the impulse in the mentioned regimes.
Repolarization and hyperpolarization: these two processes follow one after other and it is well
known that in the R+H process only K
+
-channels are open and therefore [1] becomes,
dtdVC
m
K
4
K
EVtng
0t,BI
effCa
,which integration after substitution of n(t)
yields
t
0
K
'
K
'
effCa
'
τ4t
mK
4
0KKNaKK
EtVt,BIdte14Cτng expEEEtV
K
, (3)
which is an integral equation in V
K
(t) with kernel
t,BI
effCa
. We will show below (from [8]
and [10]) that
t,BI
effCa
Ca
2
effCaCaeff
τtexpαBexpτq0Bf0N
, where N(0) is the
initial Ca
2+
ion number in a burst and
Ca
the Ca
2+
relaxation time (diffusion time in the
cytoplasm) (t origin in [3] is taken at
Na
EtV
, origin of R). For comparison with
experimental results in single neurons, it is useful to work in frequency domain, so that we
will obtain the frequency spectrum of the spontaneous impulse
tV
K
. Fourier transform (FT)
of [3] exp[…] function is unknown, but for t <
K
first exponential can be series expanded, so
obtaining
t
0
K
'
K
'
effCa
'
τ4t
mK
4
0KKNaKK
EtVt,BIdte14Cτng1EEEtV
K
. (4)
The spectrum of [4] spontaneous
tV
K
(
0I
Ca
) is obtained by Fourier transforming
tV
K
around a central frequency
0
, characteristic of the impulse, yielding (except for a
Dirac
0
*
artefact introduced by the exponential series cut-off)
2
2
V ω A ω ω Δω 2
K 0
, (5)
where
4
K 0 K m
A g n τ 4C
and
K
τ22Δω
the HMHW, which provides
K
.
Therefore the impulse spectrum is the familiar Lorentzian function, taking its maximum
value at
0
ω ω . Eqs. [4] and [5] can be easily extended to the real situation of having
different types of K
+
-channels (up to seven in Helix aspersa neurons (Azanza et al., 2008)),
but this extension is not very suitable for comparison with the impulse because of the too
large number of parameters involved.
Depolarization: this process follows after the refractory time and threshold voltage
establishment, and since involved Na
+
channels are operated by voltage, inclusion of Ca
2+
current sums only a term to
tV
Na
. But also retarded in time K
+
channels are opened,
although being in small number during D tram their current can be neglected. The HHM
relevant equation is then
0t,BIEVthtmgdtdVC
effCaNa
3
Nam
, which in
presence of MF yields another integral equation. Integration followed by the first
exponential expansion as before yields
t
0
Na
'
Na
'
effCa
'
effmeff0
3
0NaNaNa
EtVt,BIdtτtexp3Cτhmg1EtV
, (6)
where the relaxation time is given by 3τττ
1
inh
1
Na
1
eff
, since the inhibition and activation
are independent processes. As before the -spectrum of spontaneous
tV
Na
is Lorentzian
of
eff
Δω 2 2 τ
, and
3
Na 0 0 eff m
A g m h τ 3C
. Extension to different kinds of Na
+
-
channels is not worthwhile because of above mentioned reason. Ca
2+
and Cl
-
channels
operated by voltage as well would be treated in the same way to Na
+
ones, but as mentioned
before their associated currents can be safely neglected.
2. Biophysical experiments.
2.1 Experiments made on single unit neurons from Helix aspersa (mollusc) brain
ganglia by applying static (SMF) and alternating (ELF) magnetic fields .
Since experiments under low intensity SMF and alternating AC-ELF MF ones are intimately
related in their interpretation with the ones carried out under modulated MW fields it is
important to present them, in order to fully understand the neuron behaviour under the
BioelectricEffectsOfLow-FrequencyModulatedMicrowaveFieldsOnNervousSystemCells 593
The D and H main trams of bioelectric impulse in neurons (Fig. 2) are controlled by the well
known Hodgkin & Huxley (HH) equation (Hodgkin and Huxley, 1952). This equation has
been usually referred to an equivalent electric circuit of in parallel conductances, membrane
capacitance,
C
m
and DC generators, the latter being mainly the Nernst equilibrium Na
+
and
K
+
e.m.f., E
Na
and E
K
, due to the ions electrochemical gradients (other e.m.f. are due to Ca
2+
and Cl
-
ions). Consideration of this network by meshes does not allow its easy solution, and
we will consider the membrane as a Kirchoff knot where the currents concur (Fig. 3).
Therefore HH equation in the presence of an applied magnetic field, B
eff
,
takes the knot law
of charge conservation (no charge accumulation in membrane),
0t,BIVVgEVtngEVthtmgdtdVC
effCaLLK
4
KNa
3
Nam
, (1)
where V is the transmembrane voltage, g
i
(i =Na, K, L) the channels conductances. m and n
are the HH channel excitatory and h inhibitory functions, of microscopic origin not yet well
known, although the phenomenological needed powers four, point out to four independent
processes, acting for the opening (m, n) and closing (h) of corresponding channels. Leakage
channels and voltage/ligand operated ones are probably responsible for the setting of the
threshold voltage, V
s
but current through them is weak and here neglected. Finally, for our
purpose, HH currents have been supplemented by the Ca
2+
current produced by MF (HH
magnetic (HHM) equation) as we shall discuss below. We will solve eq.[1] in the relaxation
time,
, approximation for the HH functions, where e.g. we assume that
K
τtndtdn
(2)
where n(t) is assumed to be proportional to the number of K
+
-channels which remain closed
at time t. Integration of [2] taking t = 0 at the beginning of R process plus H process, yields
K0
τtexpntn . Similarly taking t = 0 at the beginning of D process we obtain that
function
Na0
τtexpmtm
. Otherwise the inhibition function at D process follows the
equation
inh
τthdtdh
, of integral
inh0
τtexphth
. We will now obtain the
membrane voltage V (t) dependence, partitioning the impulse in the mentioned regimes.
Repolarization and hyperpolarization: these two processes follow one after other and it is well
known that in the R+H process only K
+
-channels are open and therefore [1] becomes,
dtdVC
m
K
4
K
EVtng
0t,BI
effCa
,which integration after substitution of n(t)
yields
t
0
K
'
K
'
effCa
'
τ4t
mK
4
0KKNaKK
EtVt,BIdte14Cτng expEEEtV
K
, (3)
which is an integral equation in V
K
(t) with kernel
t,BI
effCa
. We will show below (from [8]
and [10]) that
t,BI
effCa
Ca
2
effCaCaeff
τtexpαBexpτq0Bf0N
, where N(0) is the
initial Ca
2+
ion number in a burst and
Ca
the Ca
2+
relaxation time (diffusion time in the
cytoplasm) (t origin in [3] is taken at
Na
EtV
, origin of R). For comparison with
experimental results in single neurons, it is useful to work in frequency domain, so that we
will obtain the frequency spectrum of the spontaneous impulse
tV
K
. Fourier transform (FT)
of [3] exp[…] function is unknown, but for t <
K
first exponential can be series expanded, so
obtaining
t
0
K
'
K
'
effCa
'
τ4t
mK
4
0KKNaKK
EtVt,BIdte14Cτng1EEEtV
K
. (4)
The spectrum of [4] spontaneous
tV
K
(
0I
Ca
) is obtained by Fourier transforming
tV
K
around a central frequency
0
, characteristic of the impulse, yielding (except for a
Dirac
0
*
artefact introduced by the exponential series cut-off)
2
2
V ω A ω ω Δω 2
K 0
, (5)
where
4
K 0 K m
A g n τ 4C
and
K
τ22Δω
the HMHW, which provides
K
.
Therefore the impulse spectrum is the familiar Lorentzian function, taking its maximum
value at
0
ω ω . Eqs. [4] and [5] can be easily extended to the real situation of having
different types of K
+
-channels (up to seven in Helix aspersa neurons (Azanza et al., 2008)),
but this extension is not very suitable for comparison with the impulse because of the too
large number of parameters involved.
Depolarization: this process follows after the refractory time and threshold voltage
establishment, and since involved Na
+
channels are operated by voltage, inclusion of Ca
2+
current sums only a term to
tV
Na
. But also retarded in time K
+
channels are opened,
although being in small number during D tram their current can be neglected. The HHM
relevant equation is then
0t,BIEVthtmgdtdVC
effCaNa
3
Nam
, which in
presence of MF yields another integral equation. Integration followed by the first
exponential expansion as before yields
t
0
Na
'
Na
'
effCa
'
effmeff0
3
0NaNaNa
EtVt,BIdtτtexp3Cτhmg1EtV
, (6)
where the relaxation time is given by 3τττ
1
inh
1
Na
1
eff
, since the inhibition and activation
are independent processes. As before the -spectrum of spontaneous
tV
Na
is Lorentzian
of
eff
Δω 2 2 τ
, and
3
Na 0 0 eff m
A g m h τ 3C
. Extension to different kinds of Na
+
-
channels is not worthwhile because of above mentioned reason. Ca
2+
and Cl
-
channels
operated by voltage as well would be treated in the same way to Na
+
ones, but as mentioned
before their associated currents can be safely neglected.
2. Biophysical experiments.
2.1 Experiments made on single unit neurons from Helix aspersa (mollusc) brain
ganglia by applying static (SMF) and alternating (ELF) magnetic fields .
Since experiments under low intensity SMF and alternating AC-ELF MF ones are intimately
related in their interpretation with the ones carried out under modulated MW fields it is
important to present them, in order to fully understand the neuron behaviour under the
AdvancedMicrowaveandMillimeterWave
Technologies:SemiconductorDevices,CircuitsandSystems594
latter. We will briefly describe the experimental set-ups for the three kinds of experiments,
as follows.
2.1.1 Experimental set-up for exposure to SMF.
Brain ganglia (about 6 mm
3
of volume) (Fig. 4) were placed in the centre of an electromagnet
polar pieces (Fig. 5). Nervous ganglia were immersed in molluscs Ringer solution.
Fig. 4. Microelectrode inside neuron F1. (from Kerkut et al., 1975).
Fig. 5. SMF application. 1: Power supply and electromagnet polar pieces. 2: Microscope. 3:
Cold light. 4. Brain ganglia in the centre of polar pieces. 5. Microelectrode.
Intracellular electrophysiological activity from single neurons was recorded in real time
with glass microelectrodes (tip diameter < 0.5 μm, tip resistance 2-20 M), filled with a
conducting 1M potassium acetate solution (pH 6.8) (Fig.5). Intensities of applied SMF were
in the range of 1.0 mT up to 0.7 T (Azanza, 1988; 1989; 1990; Azanza and del Moral, 1994
1995; 1996). Applied MF -either static or alternating- were perpendicular to local
geomagnetic field (GMF) lines. Set-up was disposed inside a Faraday cage.
2.1.2 Experimental set-up for exposure to ELF-MF.
Brain ganglia samples, were disposed between a pair of Helmholtz coils as above described
for exposure to SMF (Fig. 6). Applied ELF-MF were of: frequencies between 0.1 and 217 Hz
and AC amplitude between 0.2 µT up to 15 mT. Experiments at AC, µT amplitude, were
performed
inside a Mumetal chamber (Fig. 7). The screening was of 100 times, relative to the
values of local geomagnetic field (GMF). The AC amplitude inside the Mumetal chamber,
was of 0.1T with respect to the ambient AC field of 0.2 T (Azanza and del Moral, 1998;
Azanza et al., 2001, 2002; Calvo et al., 1999a, b; Pérez-Bruzón, 2006).
Fig. 6. Experimental set-up for application of ELF-MF. The neuron sample is placed between
a pair of Helmholtz coils.
Fig. 7. Exposure to ELF-MF of 0.2 μT, 2µT and 12 µT were performed inside a Mumetal
screening chamber (4). (3) Cold light. (2) Helmholtz coils. (1) Brain sample.
2.2 Experiments made on single unit neurons from Helix aspersa (mollusc) brain
ganglia by applying 13.6 GHz microwaves, modulated by ELF-EMF.
2.2.1 Experimental set-up and dosimetry
Helix aspersa brain ganglia were maintained as described above for SMF and ELF-MF
experiments. For exposure to EMF of 13.6 GHz the ganglion bath was placed within a
resonant, open, toroidal cavity (Fig. 8). The resonant cavity (Figs. 8 and 9) is made of a 1 mm
thickness dielectric ring of FR4, cooper metallized on both surfaces, which are in turn
aluminium short-circuited in their external edge for forming the cavity. The MW field was
generated by a home made Gunn diode oscillator, which modulates in amplitude the high
frequency voltage by an ELF frequency signal voltage between 2-100 Hz. The MW–MF is
homogeneous within an area of about 4 mm
2
around the cavity centre, where the ganglion is
accurately positioned. The MW EF (E
0
3.5 V/m) is polarized along Oz axis (Figs. 8 and 9)
and is homogeneous within the cavity height.
BioelectricEffectsOfLow-FrequencyModulatedMicrowaveFieldsOnNervousSystemCells 595
latter. We will briefly describe the experimental set-ups for the three kinds of experiments,
as follows.
2.1.1 Experimental set-up for exposure to SMF.
Brain ganglia (about 6 mm
3
of volume) (Fig. 4) were placed in the centre of an electromagnet
polar pieces (Fig. 5). Nervous ganglia were immersed in molluscs Ringer solution.
Fig. 4. Microelectrode inside neuron F1. (from Kerkut et al., 1975).
Fig. 5. SMF application. 1: Power supply and electromagnet polar pieces. 2: Microscope. 3:
Cold light. 4. Brain ganglia in the centre of polar pieces. 5. Microelectrode.
Intracellular electrophysiological activity from single neurons was recorded in real time
with glass microelectrodes (tip diameter < 0.5 μm, tip resistance 2-20 M), filled with a
conducting 1M potassium acetate solution (pH 6.8) (Fig.5). Intensities of applied SMF were
in the range of 1.0 mT up to 0.7 T (Azanza, 1988; 1989; 1990; Azanza and del Moral, 1994
1995; 1996). Applied MF -either static or alternating- were perpendicular to local
geomagnetic field (GMF) lines. Set-up was disposed inside a Faraday cage.
2.1.2 Experimental set-up for exposure to ELF-MF.
Brain ganglia samples, were disposed between a pair of Helmholtz coils as above described
for exposure to SMF (Fig. 6). Applied ELF-MF were of: frequencies between 0.1 and 217 Hz
and AC amplitude between 0.2 µT up to 15 mT. Experiments at AC, µT amplitude, were
performed
inside a Mumetal chamber (Fig. 7). The screening was of 100 times, relative to the
values of local geomagnetic field (GMF). The AC amplitude inside the Mumetal chamber,
was of 0.1T with respect to the ambient AC field of 0.2 T (Azanza and del Moral, 1998;
Azanza et al., 2001, 2002; Calvo et al., 1999a, b; Pérez-Bruzón, 2006).
Fig. 6. Experimental set-up for application of ELF-MF. The neuron sample is placed between
a pair of Helmholtz coils.
Fig. 7. Exposure to ELF-MF of 0.2 μT, 2µT and 12 µT were performed inside a Mumetal
screening chamber (4). (3) Cold light. (2) Helmholtz coils. (1) Brain sample.
2.2 Experiments made on single unit neurons from Helix aspersa (mollusc) brain
ganglia by applying 13.6 GHz microwaves, modulated by ELF-EMF.
2.2.1 Experimental set-up and dosimetry
Helix aspersa brain ganglia were maintained as described above for SMF and ELF-MF
experiments. For exposure to EMF of 13.6 GHz the ganglion bath was placed within a
resonant, open, toroidal cavity (Fig. 8). The resonant cavity (Figs. 8 and 9) is made of a 1 mm
thickness dielectric ring of FR4, cooper metallized on both surfaces, which are in turn
aluminium short-circuited in their external edge for forming the cavity. The MW field was
generated by a home made Gunn diode oscillator, which modulates in amplitude the high
frequency voltage by an ELF frequency signal voltage between 2-100 Hz. The MW–MF is
homogeneous within an area of about 4 mm
2
around the cavity centre, where the ganglion is
accurately positioned. The MW EF (E
0
3.5 V/m) is polarized along Oz axis (Figs. 8 and 9)
and is homogeneous within the cavity height.
AdvancedMicrowaveandMillimeterWave
Technologies:SemiconductorDevices,CircuitsandSystems596
(a) (b)
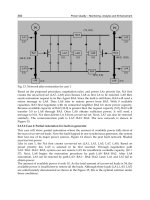
Fig. 8. (a) Set-up for MW-MF exposure and schematic diagram of the set-up. Nervous
ganglion was accurately positioned at the cavity centre, where the field is quite
homogeneous. b) Idealized set-up for dosimetry calculations.
Fig. 9 Toroidal cavity (mode TEM): external radius r
e
= 2.5 cm; internal r
i
= 2cm; h=1 mm.
Magnetic field H is polarized in the cavity plane (the one of the biological sample), along the
coaxial cable to the MW generator (P=5mW) waveguide. On Ox axis containing the feeding
port. Electric field, E is normal to plane.
The MW signal was extracted using a rectangular waveguide, working in a dominant TE
10
mode, followed by a coaxial cable (50 ), so that the mode becomes TEM, the cable being
connected to the cavity by BNC gold plated connector. Modulation depth was fixed at 90%.
MW frequency of 13.6 GHz was measured using a MW spectrum analyzer E4407B (Agilent)
and the generator output power of 5 mW was measured using a power meter 4231A
(Boonton). Typical Poynting vector at the cavity center was S 0.35 W/m
2
. Typical peak
value of H
o
0.10 Am
-1
(= 1.25 mOe) at the Helix brain ganglia position (cavity centre) (note
this intensity is close to the lowest one applied in our ELF alone experiments). The
bioelectric impulses were Fourier spectrum analysed using computer standard methods
(Chart v 4.1.2 program for Windows, ADInstruments). It is also worthwhile to mention that
the applied MF in the electrophysiological experiments was of the same order of magnitude
that the applied to astrocytes in our experiments of irradiation performed within the GTEM
anechoic chamber (Fig. 21B).
Oy
Ox
Oz
Coaxial cable to the MW generator
(P=5mW) waveguide
The values of SAR (Fig. 10) and measured temperature increase of sample, between 0.0258
and 0.0261 ºC show that the experiments have been carried out under non thermal
conditions. Therefore measurable thermal effects are not expected. Dosimetry calculations
Fig. 10. SAR in the surface of the sphere (nervous ganglion). The mean value of SAR in the
volume occupied by the sphere is 2.02x10
-3
W/Kg.
were made by using the method of finite elements in frequency domain implemented in
commercial package ANSOFT HFSS.
Although the open cavity radiates some of the injected electromagnetic power
(5 mW) to the
exterior it has been shown that it keeps an EMF distribution similar to the closed cavity one
(field distribution is only perturbed within the metallic ring). As the chamber with Ringer
solution and nervous ganglia is introduced inside the toroid some field attenuation is
expected due to the conductivity of the saline solution. Also dominant polarizations in the
centre of the applicator are perturbed with respect to the empty applicator. Calculated
temperature variations, T, in the Ringer bath solution under applied MW are similar to the
values measured with respect to a control Ringer solution not illuminated with MW. The
measurements were made with a calibrated R
0
= 100 (0ºC) Pt-resistor thermometer (0.01ºC
precision, resistance temperature
coefficient =0.03.850 x10
-2
/ºC between 0-100ºC) and a
multimeter (0.0001 ohms resolution) using the four point technique for temperature
dependent resistance measurement. Temperature was obtained from linear interpolation,
t=(R
t
- R
0)
)/ R
0.
2.3 Experimental Results
2.3.1 Main experimental observations by application of SMF and ELF (0.1-50 Hz)
magnetic fields.
We have observed that the behaviour of an individual neuron, against an applied MF, either
static or alternating, is not random but fixed for a mapped neuron: stimulation, decrease of
the activity and eventual inhibition and slow response or no response. Magnetic fields,
either SMF or ELF-MF, induce effects which reproduce normal, spontaneous, activities of
neurons. Applied MF seem to work as switchers, they switch on/switch off the spontaneous
activities. Responses of excitation/inhibition are shortened under applied MF.
BioelectricEffectsOfLow-FrequencyModulatedMicrowaveFieldsOnNervousSystemCells 597
(a) (b)
Fig. 8. (a) Set-up for MW-MF exposure and schematic diagram of the set-up. Nervous
ganglion was accurately positioned at the cavity centre, where the field is quite
homogeneous. b) Idealized set-up for dosimetry calculations.
Fig. 9 Toroidal cavity (mode TEM): external radius r
e
= 2.5 cm; internal r
i
= 2cm; h=1 mm.
Magnetic field H is polarized in the cavity plane (the one of the biological sample), along the
coaxial cable to the MW generator (P=5mW) waveguide. On Ox axis containing the feeding
port. Electric field, E is normal to plane.
The MW signal was extracted using a rectangular waveguide, working in a dominant TE
10
mode, followed by a coaxial cable (50 ), so that the mode becomes TEM, the cable being
connected to the cavity by BNC gold plated connector. Modulation depth was fixed at 90%.
MW frequency of 13.6 GHz was measured using a MW spectrum analyzer E4407B (Agilent)
and the generator output power of 5 mW was measured using a power meter 4231A
(Boonton). Typical Poynting vector at the cavity center was S 0.35 W/m
2
. Typical peak
value of H
o
0.10 Am
-1
(= 1.25 mOe) at the Helix brain ganglia position (cavity centre) (note
this intensity is close to the lowest one applied in our ELF alone experiments). The
bioelectric impulses were Fourier spectrum analysed using computer standard methods
(Chart v 4.1.2 program for Windows, ADInstruments). It is also worthwhile to mention that
the applied MF in the electrophysiological experiments was of the same order of magnitude
that the applied to astrocytes in our experiments of irradiation performed within the GTEM
anechoic chamber (Fig. 21B).
Oy
Ox
Oz
Coaxial cable to the MW generator
(P=5mW) waveguide
The values of SAR (Fig. 10) and measured temperature increase of sample, between 0.0258
and 0.0261 ºC show that the experiments have been carried out under non thermal
conditions. Therefore measurable thermal effects are not expected. Dosimetry calculations
Fig. 10. SAR in the surface of the sphere (nervous ganglion). The mean value of SAR in the
volume occupied by the sphere is 2.02x10
-3
W/Kg.
were made by using the method of finite elements in frequency domain implemented in
commercial package ANSOFT HFSS.
Although the open cavity radiates some of the injected electromagnetic power
(5 mW) to the
exterior it has been shown that it keeps an EMF distribution similar to the closed cavity one
(field distribution is only perturbed within the metallic ring). As the chamber with Ringer
solution and nervous ganglia is introduced inside the toroid some field attenuation is
expected due to the conductivity of the saline solution. Also dominant polarizations in the
centre of the applicator are perturbed with respect to the empty applicator. Calculated
temperature variations, T, in the Ringer bath solution under applied MW are similar to the
values measured with respect to a control Ringer solution not illuminated with MW. The
measurements were made with a calibrated R
0
= 100 (0ºC) Pt-resistor thermometer (0.01ºC
precision, resistance temperature
coefficient =0.03.850 x10
-2
/ºC between 0-100ºC) and a
multimeter (0.0001 ohms resolution) using the four point technique for temperature
dependent resistance measurement. Temperature was obtained from linear interpolation,
t=(R
t
- R
0)
)/ R
0.
2.3 Experimental Results
2.3.1 Main experimental observations by application of SMF and ELF (0.1-50 Hz)
magnetic fields.
We have observed that the behaviour of an individual neuron, against an applied MF, either
static or alternating, is not random but fixed for a mapped neuron: stimulation, decrease of
the activity and eventual inhibition and slow response or no response. Magnetic fields,
either SMF or ELF-MF, induce effects which reproduce normal, spontaneous, activities of
neurons. Applied MF seem to work as switchers, they switch on/switch off the spontaneous
activities. Responses of excitation/inhibition are shortened under applied MF.
AdvancedMicrowaveandMillimeterWave
Technologies:SemiconductorDevices,CircuitsandSystems598
Under applied SMF, about the 70% of neurons show a Ca
2+
-dependent modification of the
spikes-frequency (see spike in Fig. 2), with non appreciable modification of spike shape. For
the 50 % of neurons the frequency decreases and eventually are inhibited. For the 20 % of
neurons the frequency increases, being stimulated. For the remainder 30 % of neurons very
slow or no responses are observed. After long time exposures, spikes-amplitude decrease
through a mechanism dependent on the progressive inactivation of the 3Na
+
-2K
+
-ATP-ase
pump (Azanza and del Moral, 1996). We have observed higher neurons sensitivity under
applied ELF-MF. For the 56% of neurons they are inhibited. About the 26% of neurons are
stimulated and about 18 % of neurons show slow or no responses. Spikes frequency
responses are more frequent than spikes amplitude responses. Also neurons show a much
higher sensitivity to frequency variations than to amplitude variations of applied MF (Pérez-
Bruzón, 2006).
Searching for the origin of stimulation/inhibition induced effects on neurons, we were able
to experimentally show that MF somehow induces the liberation of Ca
2+
ions in the cytosol.
Depending on neuron type the increased free cytosolic calcium concentration ([Ca
2+
]
i
)
produces: i) the increase of neuron membrane conductance for K
+
ions (g
k
) through Ca
2+
-
dependent-K
+
-channels in turn promotes the sorting out of K
+
ions to the extracellular fluid,
hence the hyperpolarization and so inhibition of neuron activity; ii) the increase of positive
charge directly induces the Ca
2+
-dependent-membrane depolarization, promoting in turn
the neuron stimulation. We have shown mimic effects between the induced ones by MF and
the induced by increased [Ca
2+
]
i
, after a set of key experiments: i) by promoting the entrance
of Ca
2+
ions
into the cytoplasm
increasing by seven times the Ringer Ca
2+
concentration
(Azanza and del Moral, 1988, 1994); ii) by promoting the liberation of Ca
2+
ions from the
endoplasmic reticulum into the citosol with caffeine –agonist of ryanodine receptors-
(Azanza, 1989, 1990; Azanza and del Moral, 1994) and iii) by promoting the entrance of Ca
2+
into the citosol through NMDA-receptors activated by glutamate (Calvo, 2003; Azanza et al.
2009). The most important conclusion is that inhibition and stimulation are Ca
2+
-dependent
processes, neuron-specific and are the result of membrane molecular structure expressed in
terms of: kind, localization and relative density of ionic channels in plasma neuron, as we
have shown by the characterization of Helix channels by immunocytochemistry (Azanza et
al. 2008).
Main observations under exposure to ELF-MF were as follows:
2.3.1.1 - Synchronization of at least pairs of neurons activity defined as a coincidence in spikes
frequency and firing rhythm in time (Azanza et al., 2002, 2009). One of the most striking
behaviour was oscillatory and recruitment activities observed after some time under
exposure to sinusoidal ELF-MF. These characteristics of neuron activity are the expression of
a kind of synchronizing activity of neurons relatively
far away one each other but integrated
in a small network (Fig. 11). Connexin proteins which make gap contacts between neuron-
neuron and neuron-glia cells are the main responsible for synchronization in mammals
brain. In our studies by simultaneously recording the bioelectric activity from pairs of
neurons we have observed that synchronization occurs in the 27 % of pairs of neurons
studied (Azanza et al., 2002). We have studied the expression of connexin 26 by
immunocytochemistry methods and shown that it is expressed in only the 4% of neurons in
all the Helix suboesophagic ganglia (Azanza et al., 2007). These results plus the comparison
of synchronization recordings with the ones mediated by neurotransmitters in synapsis are
a strong support in favour of the participation of MF in the synchronization process (Azanza
et al., 2009). The synchronization encompasses clusters of e.g. 7 and 13 neurons,
surrounding a central one. The calculated neuron number in the cluster using the model of §
3.2 agrees remarkably with the experimentally inferred number (Azanza et al. 2002).
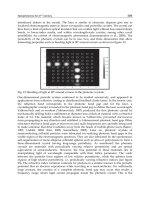
Fig. 11. Experiments were made by simultaneously recording the activity from neuron pair
V44 (□, blue) and V20 (, red). Under exposure to 50 Hz, 0.5-15 mT EMF (◊), frequency
increases reaching the same value in 2 min. As the applied ELF-MF amplitude increases the
frequency of V44 did no change, but frequency for V20 goes down to its initial value. For
15 mT the frequency decreases sharply in parallel for both neurons, reaching a minimum
value. As ELF-MF amplitude decreases the frequency for both neurons increases in parallel
reaching the initial, spontaneous, value. At min. 35 the MF is switched off, no changes in the
firing frequencies are observed. After 6 min (min. 41), the frequencies for both neurons start
approaching, reaching same value at min 50. Synchronizing activity remained for about 32
min., disappearing when the applied field goes down. (Calvo et al., 2002; Calvo 2003).
2.3.1.2 - Frequency window effect: the neuron firing frequency, f , decreases with the
applied MF frequency, f
M
, as a Lorentzian, centred at about the spontaneous, f
0
, one (Figs. 12
and 13) (Pérez-Bruzón et al., 2004; Pérez-Bruzón, 2006; Azanza et al., 2007b).
Fig. 12. Neuron F1. Lorentzian (line) fits the variation of neuron f (expressed in spikes/s) vs.
field frequency, f
M
.
f
0
=2.5 Hz, f
1/2
= 9.9 Hz.
0 10 20 30 40 50 60 70 80
0,0
0,5
1,0
1,5
2,0
2,5
Neuron F1
f (spikes/s)
f
M
(H z)
BioelectricEffectsOfLow-FrequencyModulatedMicrowaveFieldsOnNervousSystemCells 599
Under applied SMF, about the 70% of neurons show a Ca
2+
-dependent modification of the
spikes-frequency (see spike in Fig. 2), with non appreciable modification of spike shape. For
the 50 % of neurons the frequency decreases and eventually are inhibited. For the 20 % of
neurons the frequency increases, being stimulated. For the remainder 30 % of neurons very
slow or no responses are observed. After long time exposures, spikes-amplitude decrease
through a mechanism dependent on the progressive inactivation of the 3Na
+
-2K
+
-ATP-ase
pump (Azanza and del Moral, 1996). We have observed higher neurons sensitivity under
applied ELF-MF. For the 56% of neurons they are inhibited. About the 26% of neurons are
stimulated and about 18 % of neurons show slow or no responses. Spikes frequency
responses are more frequent than spikes amplitude responses. Also neurons show a much
higher sensitivity to frequency variations than to amplitude variations of applied MF (Pérez-
Bruzón, 2006).
Searching for the origin of stimulation/inhibition induced effects on neurons, we were able
to experimentally show that MF somehow induces the liberation of Ca
2+
ions in the cytosol.
Depending on neuron type the increased free cytosolic calcium concentration ([Ca
2+
]
i
)
produces: i) the increase of neuron membrane conductance for K
+
ions (g
k
) through Ca
2+
-
dependent-K
+
-channels in turn promotes the sorting out of K
+
ions to the extracellular fluid,
hence the hyperpolarization and so inhibition of neuron activity; ii) the increase of positive
charge directly induces the Ca
2+
-dependent-membrane depolarization, promoting in turn
the neuron stimulation. We have shown mimic effects between the induced ones by MF and
the induced by increased [Ca
2+
]
i
, after a set of key experiments: i) by promoting the entrance
of Ca
2+
ions
into the cytoplasm
increasing by seven times the Ringer Ca
2+
concentration
(Azanza and del Moral, 1988, 1994); ii) by promoting the liberation of Ca
2+
ions from the
endoplasmic reticulum into the citosol with caffeine –agonist of ryanodine receptors-
(Azanza, 1989, 1990; Azanza and del Moral, 1994) and iii) by promoting the entrance of Ca
2+
into the citosol through NMDA-receptors activated by glutamate (Calvo, 2003; Azanza et al.
2009). The most important conclusion is that inhibition and stimulation are Ca
2+
-dependent
processes, neuron-specific and are the result of membrane molecular structure expressed in
terms of: kind, localization and relative density of ionic channels in plasma neuron, as we
have shown by the characterization of Helix channels by immunocytochemistry (Azanza et
al. 2008).
Main observations under exposure to ELF-MF were as follows:
2.3.1.1 - Synchronization of at least pairs of neurons activity defined as a coincidence in spikes
frequency and firing rhythm in time (Azanza et al., 2002, 2009). One of the most striking
behaviour was oscillatory and recruitment activities observed after some time under
exposure to sinusoidal ELF-MF. These characteristics of neuron activity are the expression of
a kind of synchronizing activity of neurons relatively
far away one each other but integrated
in a small network (Fig. 11). Connexin proteins which make gap contacts between neuron-
neuron and neuron-glia cells are the main responsible for synchronization in mammals
brain. In our studies by simultaneously recording the bioelectric activity from pairs of
neurons we have observed that synchronization occurs in the 27 % of pairs of neurons
studied (Azanza et al., 2002). We have studied the expression of connexin 26 by
immunocytochemistry methods and shown that it is expressed in only the 4% of neurons in
all the Helix suboesophagic ganglia (Azanza et al., 2007). These results plus the comparison
of synchronization recordings with the ones mediated by neurotransmitters in synapsis are
a strong support in favour of the participation of MF in the synchronization process (Azanza
et al., 2009). The synchronization encompasses clusters of e.g. 7 and 13 neurons,
surrounding a central one. The calculated neuron number in the cluster using the model of §
3.2 agrees remarkably with the experimentally inferred number (Azanza et al. 2002).
Fig. 11. Experiments were made by simultaneously recording the activity from neuron pair
V44 (□, blue) and V20 (, red). Under exposure to 50 Hz, 0.5-15 mT EMF (◊), frequency
increases reaching the same value in 2 min. As the applied ELF-MF amplitude increases the
frequency of V44 did no change, but frequency for V20 goes down to its initial value. For
15 mT the frequency decreases sharply in parallel for both neurons, reaching a minimum
value. As ELF-MF amplitude decreases the frequency for both neurons increases in parallel
reaching the initial, spontaneous, value. At min. 35 the MF is switched off, no changes in the
firing frequencies are observed. After 6 min (min. 41), the frequencies for both neurons start
approaching, reaching same value at min 50. Synchronizing activity remained for about 32
min., disappearing when the applied field goes down. (Calvo et al., 2002; Calvo 2003).
2.3.1.2 - Frequency window effect: the neuron firing frequency, f , decreases with the
applied MF frequency, f
M
, as a Lorentzian, centred at about the spontaneous, f
0
, one (Figs. 12
and 13) (Pérez-Bruzón et al., 2004; Pérez-Bruzón, 2006; Azanza et al., 2007b).
Fig. 12. Neuron F1. Lorentzian (line) fits the variation of neuron f (expressed in spikes/s) vs.
field frequency, f
M
.
f
0
=2.5 Hz, f
1/2
= 9.9 Hz.
0 10 20 30 40 50 60 70 80
0,0
0,5
1,0
1,5
2,0
2,5
Neuron F1
f (spikes/s)
f
M
(H z)
AdvancedMicrowaveandMillimeterWave
Technologies:SemiconductorDevices,CircuitsandSystems600
0 5 10 15 20 25 30 35 40
0,0
0,2
0,4
0,6
0,8
1,0
1,2
1,4
1,6
1,8
Neuron V14
f (spikes/s)
f
M
(H z)
Fig. 13. Neuron V14. Lorentzian (line), fits the variation of neuron f (expressed in spikes/s)
vs. field frequency, f
M
. f
0
=2.0 Hz, f
1/2
= 2.7 Hz.
2.3.1.3 - Resonance effect: we have experimentally shown in molluscan brain single neurons
that as the frequency of the applied MF, f
M
, was coincident with the main frequency, f
0
of the
Fourier spectrum of the spontaneous bioelectric activity voltage impulse, the neuron firing
frequency showed a maximum, an effect so called frequency resonance (Fig. 14) (Pérez-Bruzón
et al., 2004; Pérez-Bruzón, 2006; Azanza et al., 2007b).
Fig. 14. Neurone V19. A): Spontaneous f = 2.4 spikes/s, frequency and amplitude
progressively decrease, being the neuron activity completely inhibited after 6 min. of
recording. B): ELF-MF of 1 mT-2 Hz, was applied for 10 min. With 4 min delay the neuron
activity (frequency) was stimulated, spikes amplitude also increasing. C): ELF-MF of 1 mT-2
Hz was applied, the frequency and amplitude increased for a second time. As 1 mT-1 Hz
was applied, the neuron frequency was progressively decreasing and neuron activity
completely inhibited. Experiment duration: was of (Pérez-Bruzón, 2006).
2.3.1.4 - Demodulation effect: the purpose of our research by applying MW electromagnetic
fields (EMF) amplitude modulated (90%) by ELF-EMF was to separate out the possible effect
of the MW from the one induced by modulated ELF-EMF within a wider range of
frequencies, i.e. 2-100 Hz.
The exposure of neurons to MW modulated by ELF-MF MF between 2 and 20 Hz and 20 Hz
have shown that are the ELF-MF the responsible for the elicited responses (Figs. 15a and 16),
a so called demodulation effect. Main observation was no effect under the carrier, f
c
=13.6 GHz,
but “frequency resonances” at low frequencies, e.g. f
M
=16 Hz (Figs. 15a, 16), similar to the case
of only ELF application, i.e. also with Lorentzian profiles (Fig. 17) (Azanza et al., 2007b; del
Moral et al., 2008). The effect is a “frequency resonance” of Lorentzian shape, when the MF
frequency matches the characteristic frequency (-ies) of the neurone impulse Fourier spectrum (Figs.
15b and 18b). We should stress that a “frequency resonance” is a maximum in the spectrum f =
f (f
M
), where f is the bioelectric or spike frequency repetition. In neuron V14 two frequency
resonances are observed at f
M
= 4 and 16 Hz (Fig. 16). On Fig. 17 we can see Lorentzian fits to
the f
M
= 4 and 16 Hz resonances in neuron V14 (Fig. 16). As we will see this is an important
observation upon which to base the model proposed in § 3.4 for the effect of ELF amplitude
modulated MW upon neuron bioelectric activity. Note that the resonance observed in not an
amplitude one (“spring” resonance).
SA SA SA SA SA 2 4 8 12 16 20
0,6
0,8
1,0
1,2
1,4
1,6
1,8
f (spikes/s)
f
M
(Hz)
a)
Neurone V15
f
0
= 16Hz
Fig. 15. a) SA, spontaneous activity. The carrier was modulated at 2, 4, 8, 12, 16, 20 Hz.
Neuron V15 shows a resonance effect at 16 Hz. b) Spontaneous activity Fourier spectrum
gives a maximum for 16.4 Hz.
BioelectricEffectsOfLow-FrequencyModulatedMicrowaveFieldsOnNervousSystemCells 601
0 5 10 15 20 25 30 35 40
0,0
0,2
0,4
0,6
0,8
1,0
1,2
1,4
1,6
1,8
Neuron V14
f (spikes/s)
f
M
(H z)
Fig. 13. Neuron V14. Lorentzian (line), fits the variation of neuron f (expressed in spikes/s)
vs. field frequency, f
M
. f
0
=2.0 Hz, f
1/2
= 2.7 Hz.
2.3.1.3 - Resonance effect: we have experimentally shown in molluscan brain single neurons
that as the frequency of the applied MF, f
M
, was coincident with the main frequency, f
0
of the
Fourier spectrum of the spontaneous bioelectric activity voltage impulse, the neuron firing
frequency showed a maximum, an effect so called frequency resonance (Fig. 14) (Pérez-Bruzón
et al., 2004; Pérez-Bruzón, 2006; Azanza et al., 2007b).
Fig. 14. Neurone V19. A): Spontaneous f = 2.4 spikes/s, frequency and amplitude
progressively decrease, being the neuron activity completely inhibited after 6 min. of
recording. B): ELF-MF of 1 mT-2 Hz, was applied for 10 min. With 4 min delay the neuron
activity (frequency) was stimulated, spikes amplitude also increasing. C): ELF-MF of 1 mT-2
Hz was applied, the frequency and amplitude increased for a second time. As 1 mT-1 Hz
was applied, the neuron frequency was progressively decreasing and neuron activity
completely inhibited. Experiment duration: was of (Pérez-Bruzón, 2006).
2.3.1.4 - Demodulation effect: the purpose of our research by applying MW electromagnetic
fields (EMF) amplitude modulated (90%) by ELF-EMF was to separate out the possible effect
of the MW from the one induced by modulated ELF-EMF within a wider range of
frequencies, i.e. 2-100 Hz.
The exposure of neurons to MW modulated by ELF-MF MF between 2 and 20 Hz and 20 Hz
have shown that are the ELF-MF the responsible for the elicited responses (Figs. 15a and 16),
a so called demodulation effect. Main observation was no effect under the carrier, f
c
=13.6 GHz,
but “frequency resonances” at low frequencies, e.g. f
M
=16 Hz (Figs. 15a, 16), similar to the case
of only ELF application, i.e. also with Lorentzian profiles (Fig. 17) (Azanza et al., 2007b; del
Moral et al., 2008). The effect is a “frequency resonance” of Lorentzian shape, when the MF
frequency matches the characteristic frequency (-ies) of the neurone impulse Fourier spectrum (Figs.
15b and 18b). We should stress that a “frequency resonance” is a maximum in the spectrum f =
f (f
M
), where f is the bioelectric or spike frequency repetition. In neuron V14 two frequency
resonances are observed at f
M
= 4 and 16 Hz (Fig. 16). On Fig. 17 we can see Lorentzian fits to
the f
M
= 4 and 16 Hz resonances in neuron V14 (Fig. 16). As we will see this is an important
observation upon which to base the model proposed in § 3.4 for the effect of ELF amplitude
modulated MW upon neuron bioelectric activity. Note that the resonance observed in not an
amplitude one (“spring” resonance).
SA SA SA SA SA 2 4 8 12 16 20
0,6
0,8
1,0
1,2
1,4
1,6
1,8
f (spikes/s)
f
M
(Hz)
a)
Neurone V15
f
0
= 16Hz
Fig. 15. a) SA, spontaneous activity. The carrier was modulated at 2, 4, 8, 12, 16, 20 Hz.
Neuron V15 shows a resonance effect at 16 Hz. b) Spontaneous activity Fourier spectrum
gives a maximum for 16.4 Hz.
AdvancedMicrowaveandMillimeterWave
Technologies:SemiconductorDevices,CircuitsandSystems602
SA SA SA SA SA 2 4 8 12 16 20
1,30
1,35
1,40
1,45
1,50
1,55
1,60
f (spikes/s)
f
M
(Hz)
Neurone V14
f
0
= 4 Hz, 16 Hz
Fig. 16. Frequency resonance effect showing maxima at 4 and 16 Hz from neuron V14:
frequency window effect.
2 3 4 5 6 7 8 9
1.50
1.52
1.54
1.56
1.58
1.60
11 12 13 14 15 16 17 18 19 20 21
1.34
1.35
1.36
1.37
1.38
1.39
1.40
1.41
f (spikes/s)
f
M
(Hz)
f (spikes/s)
f
M
(Hz)
f
0
= 16 Hz
Neurone V14
f
0
= 4 Hz
Fig. 17. Lorentzian fits (continuous line) to the resonances shown in Fig 16. The HMHWs are
respectively 1.4 and 1.6 Hz.
The resonance effect seems to be neuron specific. In the experiment on neuron F32 (Fig. 18a),
caffeine (3mM) does not induce any Ca
2+
-dependent activity (Azanza, 1989). When Ringer
solution is added in order to remove caffeine, we observe a small increment in neurone
bioelectric activity. This increment is not relevant from the statistical point of view. MW
carrier alone (C) was applied and then the carrier modulated by ELF from 2 to 100 Hz
frequencies. Resonances at 4 Hz and 50 Hz are observed. Fourier spectrum (Fig. 18b) gives a
maximum for 4.2 Hz which is coincident with a maximum neurone frequency (4 Hz) (Fig.
18a). Resonances at 12 and 50 Hz are observed for other kinds of neurons (Fig. 19).
Fig. 18a. SA, spontaneous activity. Cf, caffeine. Ri, Ringer solution. C, MW carrier, induces a
non significant modification of bioelectric activity. Resonances at 4 Hz and 50 Hz are
observed.
Fig. 18b. Fourier spectrum give one maximun value at 4.2 Hz which is coincident with
maximum neurone frequency. A filter to avoid 50Hz noise prevents getting the
correspondent maximum.
SA Cf Ri C 2 4 8 12 16 20 40 50 60 70 100
0,0
0,2
0,4
0,6
0,8
1,0
f (spikes/s)
f
M
(Hz)
Neurone F32
f
0
= 4Hz, 50 Hz
a)
BioelectricEffectsOfLow-FrequencyModulatedMicrowaveFieldsOnNervousSystemCells 603
SA SA SA SA SA 2 4 8 12 16 20
1,30
1,35
1,40
1,45
1,50
1,55
1,60
f (spikes/s)
f
M
(Hz)
Neurone V14
f
0
= 4 Hz, 16 Hz
Fig. 16. Frequency resonance effect showing maxima at 4 and 16 Hz from neuron V14:
frequency window effect.
2 3 4 5 6 7 8 9
1.50
1.52
1.54
1.56
1.58
1.60
11 12 13 14 15 16 17 18 19 20 21
1.34
1.35
1.36
1.37
1.38
1.39
1.40
1.41
f (spikes/s)
f
M
(Hz)
f (spikes/s)
f
M
(Hz)
f
0
= 16 Hz
Neurone V14
f
0
= 4 Hz
Fig. 17. Lorentzian fits (continuous line) to the resonances shown in Fig 16. The HMHWs are
respectively 1.4 and 1.6 Hz.
The resonance effect seems to be neuron specific. In the experiment on neuron F32 (Fig. 18a),
caffeine (3mM) does not induce any Ca
2+
-dependent activity (Azanza, 1989). When Ringer
solution is added in order to remove caffeine, we observe a small increment in neurone
bioelectric activity. This increment is not relevant from the statistical point of view. MW
carrier alone (C) was applied and then the carrier modulated by ELF from 2 to 100 Hz
frequencies. Resonances at 4 Hz and 50 Hz are observed. Fourier spectrum (Fig. 18b) gives a
maximum for 4.2 Hz which is coincident with a maximum neurone frequency (4 Hz) (Fig.
18a). Resonances at 12 and 50 Hz are observed for other kinds of neurons (Fig. 19).
Fig. 18a. SA, spontaneous activity. Cf, caffeine. Ri, Ringer solution. C, MW carrier, induces a
non significant modification of bioelectric activity. Resonances at 4 Hz and 50 Hz are
observed.
Fig. 18b. Fourier spectrum give one maximun value at 4.2 Hz which is coincident with
maximum neurone frequency. A filter to avoid 50Hz noise prevents getting the
correspondent maximum.
SA Cf Ri C 2 4 8 12 16 20 40 50 60 70 100
0,0
0,2
0,4
0,6
0,8
1,0
f (spikes/s)
f
M
(Hz)
Neurone F32
f
0
= 4Hz, 50 Hz
a)
AdvancedMicrowaveandMillimeterWave
Technologies:SemiconductorDevices,CircuitsandSystems604
Fig. 19. Resonances at 12 Hz (neuron V17) and 8 and 50 Hz (Neuron F8).
Two conclusions can be summarized from the above experiments:
i) Neurone plasma membrane (see § 3.4) seems to behave as a physical system able to
resonate as the MF frequency matches some characteristic one of the bioelectric impulse
other than the spontaneous neurone frequency (Azanza et al., 2007b). An approach has been
made for the interpretation of our resonance results
consistent in a membrane
depolarization due to the increase of cytosolic Ca
2+
concentration. Ca
2+
is detached from
plasma neurone membrane through the superdiamagnetism (SD) and Ca
2+
Coulomb
explosion (CE) as explained in § 3.4 (del Moral and Azanza, 1992; Azanza and del Moral,
1994).
ii) Neurone bioelectric activity is highly sensitive to low frequency applied alternating MF
modulating a MW carrier in the ten of GHz range. Extremely low frequency modulated MW
radiation at non-thermal level of field power density (T increase in bath lower than 0.01ºC)
modifies neurons bioelectric firing frequency, in a resonant way. The resonance appears when
the ELF applied MF is close to a characteristic frequency of the impulse train Fourier spectrum
(not to the firing frequency, del Moral et al., 2008).
Stimulatory effects by MW modulated by ELF-EMF have been described on human
volunteers electroencephalogram recordings (EEG). 400 MHz 100 % modulated in the EEG
physiological spectrum, at frequencies of 7, 14 and 21 Hz showed increased alpha (8-13 Hz),
and beta (13-30 Hz) rhythms. Alpha and beta rhythms were also activated by MW
modulation at 40 Hz and 70 Hz (Hinrikus et al., 2005).
Similarly to observations on humans
EEG we have got resonances at frequencies in the alpha and beta rhythms, values much
higher than the spontaneous Helix neurons frequency (0.1-8.0 spikes/s). Our
conclusion is
that the frequency resonant effect must be the expression of an intrinsic biophysical property
common to molluscan and human plasma membrane neurons which appears when the ELF
applied MF is close to a characteristic frequency of the bioelectric impulse train Fourier spectrum.
These observations could explain the effects observed on human EEG.
2.4 Experiments made on astrocytes from human astrocytoma tumour submitted to
9.6 GHz amplitude modulated by low power ELF-MF of 100 and 800 Hz.
Another kind of experiments has been performed consisting in the study of glia cell (human
astrocytes) proliferation process under also ELF amplitude modulated MW EMF, that we
SA C R 2 R 4 R 8 R 12 R 16 R 20 R 40
0,0
0,2
0,4
0,6
0,8
1,0
1,2
1,4
1,6
1,8
2,0
2,2
2,4
2,6
f (spikes/s)
f
M
(Hz)
Neurone V17
f
0
= 12 Hz
SA SA SA SA SA C 2 4 8 12 16 20 40 50 60 70 100
0,0
0,2
0,4
0,6
f (spikes/s)
f
M
(Hz)
Neurone F8
f
0
= 8 Hz, 50 Hz
will briefly discuss. The underlying mechanism to explain them may be also the Ca
2+
detaching from membranes.
Brain neurons and astrocytes are cells of crucial interest for the research of potential effects
of MW produced by communication systems. Astrocytes are a physical support for neurons
in human brain; they feed neurons by supplying metabolites from blood; they provide a
neurotransmitters and ions buffer system to the brain, and with endothelial brain vessels
membrane makes the blood brain barrier (BBB) and are able to proliferate, being the
responsible for more than 90% of human cellular brain tumours (gliomas). Any modification
in any of their activities will potentially produce negative effects on brain function and
human health.
The aim of our work has been to characterise the effects of short MW pulses upon the
physiology of astrocytes in culture by means of cellular and biochemical studies trying to
characterize any possible toxic effect by comparing the results obtained on non-exposed,
standard sham-control conditions, with the ones obtained under exposure to MW.
2.4.1 Experimental set-up and dosimetry.
Experiments were performed on astrocytes from human astrocytoma (Clonetics line
1321N1). Cells were maintained in culture as an adherent monolayer in a humidified
atmosphere of 5% CO
2
at 37ºC in a standard incubator. After 6 days cultured, cells were
transferred to the GTEM-incubator for exposure to MW inside a horn shape GTEM cell,
where the TEM radiated MW is from a flat strip line along a border. MW were produced
with a solid state MW generator (100 KHz-20 GHz range), provided with a versatile
modulator of different wave profiles (modulation depth 90%), followed by a high power
(50W maximum output) MW travelling-wave tube amplifier, followed by a directional
coupler, which injects the MW signal into the GTEM chamber through a 50 ohm coaxial
cable (Fig. 20). ELF modulation was kept for all irradiations at 90%. Direct and reflected
from chamber powers were monitorized via a diode bridge. GTEM chamber is provided
with anechoic walls to reduce unwanted reflections. The EMF-MW mode was the TEM one,
same as usually in wireless telecommunication.
Fig. 20. A. (1) Microwave generator (GIGATRONICS 2520A). (2) Medium Power Wide band
amplifier (T186-50). (3) RF Power meter (BOONTON 51013). (4) Directional coupler:
frequency range: 4-18GHz (COU-BD418 G 50W-35). B. (1) Electronic equipment connected
to the GTEM - Cell (2). Olympus - incubator regulators: (3) CO
2
regulator; (4) Temperature
regulator; (5) CO
2
container.
(1)
(3)
(2)
(4)
(3)
(2)
(4)
(1)
(1)
(3)
(2)
(4)
(3)
(2)
(4)
(1)
(3)
(2)
(4)
(1)
A
(
1
)
(
2
)
(
4
)
(
3
)
(
5
)
B
BioelectricEffectsOfLow-FrequencyModulatedMicrowaveFieldsOnNervousSystemCells 605
Fig. 19. Resonances at 12 Hz (neuron V17) and 8 and 50 Hz (Neuron F8).
Two conclusions can be summarized from the above experiments:
i) Neurone plasma membrane (see § 3.4) seems to behave as a physical system able to
resonate as the MF frequency matches some characteristic one of the bioelectric impulse
other than the spontaneous neurone frequency (Azanza et al., 2007b). An approach has been
made for the interpretation of our resonance results
consistent in a membrane
depolarization due to the increase of cytosolic Ca
2+
concentration. Ca
2+
is detached from
plasma neurone membrane through the superdiamagnetism (SD) and Ca
2+
Coulomb
explosion (CE) as explained in § 3.4 (del Moral and Azanza, 1992; Azanza and del Moral,
1994).
ii) Neurone bioelectric activity is highly sensitive to low frequency applied alternating MF
modulating a MW carrier in the ten of GHz range. Extremely low frequency modulated MW
radiation at non-thermal level of field power density (T increase in bath lower than 0.01ºC)
modifies neurons bioelectric firing frequency, in a resonant way. The resonance appears when
the ELF applied MF is close to a characteristic frequency of the impulse train Fourier spectrum
(not to the firing frequency, del Moral et al., 2008).
Stimulatory effects by MW modulated by ELF-EMF have been described on human
volunteers electroencephalogram recordings (EEG). 400 MHz 100 % modulated in the EEG
physiological spectrum, at frequencies of 7, 14 and 21 Hz showed increased alpha (8-13 Hz),
and beta (13-30 Hz) rhythms. Alpha and beta rhythms were also activated by MW
modulation at 40 Hz and 70 Hz (Hinrikus et al., 2005).
Similarly to observations on humans
EEG we have got resonances at frequencies in the alpha and beta rhythms, values much
higher than the spontaneous Helix neurons frequency (0.1-8.0 spikes/s). Our
conclusion is
that the frequency resonant effect must be the expression of an intrinsic biophysical property
common to molluscan and human plasma membrane neurons which appears when the ELF
applied MF is close to a characteristic frequency of the bioelectric impulse train Fourier spectrum.
These observations could explain the effects observed on human EEG.
2.4 Experiments made on astrocytes from human astrocytoma tumour submitted to
9.6 GHz amplitude modulated by low power ELF-MF of 100 and 800 Hz.
Another kind of experiments has been performed consisting in the study of glia cell (human
astrocytes) proliferation process under also ELF amplitude modulated MW EMF, that we
SA C R 2 R 4 R 8 R 12 R 16 R 20 R 40
0,0
0,2
0,4
0,6
0,8
1,0
1,2
1,4
1,6
1,8
2,0
2,2
2,4
2,6
f (spikes/s)
f
M
(Hz)
Neurone V17
f
0
= 12 Hz
SA SA SA SA SA C 2 4 8 12 16 20 40 50 60 70 100
0,0
0,2
0,4
0,6
f (spikes/s)
f
M
(Hz)
Neurone F8
f
0
= 8 Hz, 50 Hz
will briefly discuss. The underlying mechanism to explain them may be also the Ca
2+
detaching from membranes.
Brain neurons and astrocytes are cells of crucial interest for the research of potential effects
of MW produced by communication systems. Astrocytes are a physical support for neurons
in human brain; they feed neurons by supplying metabolites from blood; they provide a
neurotransmitters and ions buffer system to the brain, and with endothelial brain vessels
membrane makes the blood brain barrier (BBB) and are able to proliferate, being the
responsible for more than 90% of human cellular brain tumours (gliomas). Any modification
in any of their activities will potentially produce negative effects on brain function and
human health.
The aim of our work has been to characterise the effects of short MW pulses upon the
physiology of astrocytes in culture by means of cellular and biochemical studies trying to
characterize any possible toxic effect by comparing the results obtained on non-exposed,
standard sham-control conditions, with the ones obtained under exposure to MW.
2.4.1 Experimental set-up and dosimetry.
Experiments were performed on astrocytes from human astrocytoma (Clonetics line
1321N1). Cells were maintained in culture as an adherent monolayer in a humidified
atmosphere of 5% CO
2
at 37ºC in a standard incubator. After 6 days cultured, cells were
transferred to the GTEM-incubator for exposure to MW inside a horn shape GTEM cell,
where the TEM radiated MW is from a flat strip line along a border. MW were produced
with a solid state MW generator (100 KHz-20 GHz range), provided with a versatile
modulator of different wave profiles (modulation depth 90%), followed by a high power
(50W maximum output) MW travelling-wave tube amplifier, followed by a directional
coupler, which injects the MW signal into the GTEM chamber through a 50 ohm coaxial
cable (Fig. 20). ELF modulation was kept for all irradiations at 90%. Direct and reflected
from chamber powers were monitorized via a diode bridge. GTEM chamber is provided
with anechoic walls to reduce unwanted reflections. The EMF-MW mode was the TEM one,
same as usually in wireless telecommunication.
Fig. 20. A. (1) Microwave generator (GIGATRONICS 2520A). (2) Medium Power Wide band
amplifier (T186-50). (3) RF Power meter (BOONTON 51013). (4) Directional coupler:
frequency range: 4-18GHz (COU-BD418 G 50W-35). B. (1) Electronic equipment connected
to the GTEM - Cell (2). Olympus - incubator regulators: (3) CO
2
regulator; (4) Temperature
regulator; (5) CO
2
container.
(1)
(3)
(2)
(4)
(3)
(2)
(4)
(1)
(1)
(3)
(2)
(4)
(3)
(2)
(4)
(1)
(3)
(2)
(4)
(1)
A
(
1
)
(
2
)
(
4
)
(
3
)
(
5
)
B
AdvancedMicrowaveandMillimeterWave
Technologies:SemiconductorDevices,CircuitsandSystems606
Two cells culture flaks were placed into the GTEM-cell where the EMF is rather
homogeneous, with their longitudinal axis in the same direction of EM wave incidence. In
Fig. 21 are shown the simulation layout for the dosimetry calculation for the whole system
and SAR calculation along an observation line at 50 m height from the bottom of the flask
(the estimated cell layer thickness). EF calculated values were: 0.05-0.25 and 0.10- 0.35 V/m
for the two flaks respectively. The calculated MF were: 4.6-8.8 A/m, and 4.8-9.1 A/m for the
two flaks. MF and EF intensities measured, are of the same order of magnitude to the ones that
we are applying in our electrophysiology studies on neurons. The EF was normal to the plane
of the cells monolayer and the incident MF in the horizontal plane of the monolayer.
Calculated temperature increases due to MW power exposure were below 3x10
-5
ºC.
Therefore we can assume negligible thermal effects in the cells (for detailed descriptions of
dosimetry see Pérez-Bruzón et al., 2009).
Fig. 21. A) Transversal section of 2 Falcon flasks inside the GTEM- incubator system. B) SAR
simulation in a plane at 50 μm height from incubator base. The mean SAR value from left to
right was 3.99x10
-4
W/Kg and 4.08x10
-4
W/Kg (incidence direction +X).
2.4.2 Experimental results
In our experiments we have observed an statistics significant increased cell proliferation rate
of about 43%under 24h exposure to pulsed MW in
two experimental conditions: 9.6 GHz
carrier frequency, pulse width 100 and 120 ns, pulse repetition frequency 100 and 800 Hz,
pulse repetition interval, 1.25 and 10 ms, power 0.34 and 0.60 mW, EF strength 1.25 and 1.64
V/m, MF strength 3.3x10
-3
A/m (41.4 Oe) and 4.35x10
-3
A/m (54.6 Oe). Searching for
biomarker proteins of astrocytes cell cycle and apoptosis, we found that Hsp-70 and Bcl-2
antiapoptotic proteins were expressed in control and treated samples while an increased
expression for connexin 43 proteins was found in exposed samples.
These results open the Ca
2+
pathway for an explanation of increased proliferation. Signal
cascade of astrocyte apoptosis may enclose modifications of intracellular calcium
concentration ([Ca
2+
]
i
), an interesting confluence of molecular pathways to explain the
effects under exposure to EMF in two kind of cells of the nervous system: of nervous:
neurons and astrocytes. By considering the mechanisms that initiate cell cycle reactions, the
induction of cell stress could be related to an increased release of hsp (heat-shock) proteins,
which need not to be induced by heat production only. Hsps proteins play a critical role in
the regulation of the cell cycle, proliferation and apoptosis. The synthesis of Hsp can be
produced under several stress conditions: alcohol, oxidative stress, osmotic pressure change,
toxic chemicals and exposure to low-frequency EMF (Pipkin et al., 1999; Leszczynski et al.,
2002). Our future research will be devoted to study the quantification of Hsp-70, Bcl-2 and
Cx43 proteins, in control and irradiated samples, possible increased [Ca
2+
]
i
concentration
process and the implication of the anti-apoptotic increase of Bcl-2 protein promoting cell
survival (Takuma et al., 2004).
3. Biophysical models.
3.1 Cell membrane as target for electromagnetic field interactions.
The EMF, in the frequency range we are applying, i.e. ELF of 0.1-217 Hz, and 100 and 800
Hz modulating MW carrier and, MW of 9.6 and 13.6 GHz, of low power (SAR induced on
biological samples of 4.00 x 10
-1
mW/Kg and 2.02x10
-3
W/Kg respectively), do not posses
sufficient EM-energy density to cause ionization (as in the X-ray, U.V and ranges of the EM
spectrum) or appreciable thermal effects (see dosimetry data). In fact in the range of ELF, the
heating effects are eventually due to the production of eddy currents and to the water
dielectric relaxation, mainly of α-type, operating at frequencies between ≈ 0 Hz and ≈ 100
Hz (see Azanza and del Moral, 2004 for details). According to the Poynting theorem the
maximum average EM energy deposition (i.e. without radiation losses) in a living system is
limited by the time average EM density energy, i.e.
2
rms
2
rmsm
μHH
2
1
e
(7)
where
rms
E is the EF and
rms
H the MF r.m.s intensities respectively, and ε and µ, the
dielectric constant and magnetic permeability of the biological medium, respectively. Then
for an ELF field with a MF amplitude of say ≈ 0.3% Oe, e
m
≈ 2 x 10
-15
eV/m
3
, and e.g. for a
neurone of Helix aspersa, with diameter ≈ 100 µm, this means that the energy available to the
entire cell is only of ≈ 3 x 10
-3
eV if whole energy were deposited in the cell. This energy is
really negligible either against the atomic ionization energy for the whole cell atoms (of the
order of 10 eV/atom, the Van der Waals binding energies of ≈ 0.06 eV/molecule or the
BioelectricEffectsOfLow-FrequencyModulatedMicrowaveFieldsOnNervousSystemCells 607
Two cells culture flaks were placed into the GTEM-cell where the EMF is rather
homogeneous, with their longitudinal axis in the same direction of EM wave incidence. In
Fig. 21 are shown the simulation layout for the dosimetry calculation for the whole system
and SAR calculation along an observation line at 50 m height from the bottom of the flask
(the estimated cell layer thickness). EF calculated values were: 0.05-0.25 and 0.10- 0.35 V/m
for the two flaks respectively. The calculated MF were: 4.6-8.8 A/m, and 4.8-9.1 A/m for the
two flaks. MF and EF intensities measured, are of the same order of magnitude to the ones that
we are applying in our electrophysiology studies on neurons. The EF was normal to the plane
of the cells monolayer and the incident MF in the horizontal plane of the monolayer.
Calculated temperature increases due to MW power exposure were below 3x10
-5
ºC.
Therefore we can assume negligible thermal effects in the cells (for detailed descriptions of
dosimetry see Pérez-Bruzón et al., 2009).
Fig. 21. A) Transversal section of 2 Falcon flasks inside the GTEM- incubator system. B) SAR
simulation in a plane at 50 μm height from incubator base. The mean SAR value from left to
right was 3.99x10
-4
W/Kg and 4.08x10
-4
W/Kg (incidence direction +X).
2.4.2 Experimental results
In our experiments we have observed an statistics significant increased cell proliferation rate
of about 43%under 24h exposure to pulsed MW in
two experimental conditions: 9.6 GHz
carrier frequency, pulse width 100 and 120 ns, pulse repetition frequency 100 and 800 Hz,
pulse repetition interval, 1.25 and 10 ms, power 0.34 and 0.60 mW, EF strength 1.25 and 1.64
V/m, MF strength 3.3x10
-3
A/m (41.4 Oe) and 4.35x10
-3
A/m (54.6 Oe). Searching for
biomarker proteins of astrocytes cell cycle and apoptosis, we found that Hsp-70 and Bcl-2
antiapoptotic proteins were expressed in control and treated samples while an increased
expression for connexin 43 proteins was found in exposed samples.
These results open the Ca
2+
pathway for an explanation of increased proliferation. Signal
cascade of astrocyte apoptosis may enclose modifications of intracellular calcium
concentration ([Ca
2+
]
i
), an interesting confluence of molecular pathways to explain the
effects under exposure to EMF in two kind of cells of the nervous system: of nervous:
neurons and astrocytes. By considering the mechanisms that initiate cell cycle reactions, the
induction of cell stress could be related to an increased release of hsp (heat-shock) proteins,
which need not to be induced by heat production only. Hsps proteins play a critical role in
the regulation of the cell cycle, proliferation and apoptosis. The synthesis of Hsp can be
produced under several stress conditions: alcohol, oxidative stress, osmotic pressure change,
toxic chemicals and exposure to low-frequency EMF (Pipkin et al., 1999; Leszczynski et al.,
2002). Our future research will be devoted to study the quantification of Hsp-70, Bcl-2 and
Cx43 proteins, in control and irradiated samples, possible increased [Ca
2+
]
i
concentration
process and the implication of the anti-apoptotic increase of Bcl-2 protein promoting cell
survival (Takuma et al., 2004).
3. Biophysical models.
3.1 Cell membrane as target for electromagnetic field interactions.
The EMF, in the frequency range we are applying, i.e. ELF of 0.1-217 Hz, and 100 and 800
Hz modulating MW carrier and, MW of 9.6 and 13.6 GHz, of low power (SAR induced on
biological samples of 4.00 x 10
-1
mW/Kg and 2.02x10
-3
W/Kg respectively), do not posses
sufficient EM-energy density to cause ionization (as in the X-ray, U.V and ranges of the EM
spectrum) or appreciable thermal effects (see dosimetry data). In fact in the range of ELF, the
heating effects are eventually due to the production of eddy currents and to the water
dielectric relaxation, mainly of α-type, operating at frequencies between ≈ 0 Hz and ≈ 100
Hz (see Azanza and del Moral, 2004 for details). According to the Poynting theorem the
maximum average EM energy deposition (i.e. without radiation losses) in a living system is
limited by the time average EM density energy, i.e.
2
rms
2
rmsm
μHH
2
1
e
(7)
where
rms
E is the EF and
rms
H the MF r.m.s intensities respectively, and ε and µ, the
dielectric constant and magnetic permeability of the biological medium, respectively. Then
for an ELF field with a MF amplitude of say ≈ 0.3% Oe, e
m
≈ 2 x 10
-15
eV/m
3
, and e.g. for a
neurone of Helix aspersa, with diameter ≈ 100 µm, this means that the energy available to the
entire cell is only of ≈ 3 x 10
-3
eV if whole energy were deposited in the cell. This energy is
really negligible either against the atomic ionization energy for the whole cell atoms (of the
order of 10 eV/atom, the Van der Waals binding energies of ≈ 0.06 eV/molecule or the
AdvancedMicrowaveandMillimeterWave
Technologies:SemiconductorDevices,CircuitsandSystems608
hydrogen bond energies of ≈ 0.16 eV/molecule), or the specific heat (1cal/mole K) for the
water within the cell, to produce any noticeable thermal effects (the above energy is around
10
-8
times smaller than that needed one to rise the temperature of the cell by 1K at room
temperature).
An ELF-EMF, both through the EF and through the MF by means of the Faraday induction
effect, will produce electric currents in the ionic aqueous solution surrounding the cell.
However, the cell membrane is a strong dielectric (ε
r
≈ 6) barrier for the passage of those
currents to the intracellular medium, except for a small reduced fraction. Therefore if the
ELF-EMFs have to produce any effects inside the living cells perhaps they must be through
subtle alterations at the membrane level which in turn should convey signals across the
membrane body to produce any eventual biochemical and physiological response. The
unique characteristics of biological membranes make them the first candidates when
searching for EMF interaction sites. Membranes from specialized cells couple the stimuli,
carried out by chemical mediators as
hormones and neurotransmitters, with the cytosolic
machinery inducing in turn physiological responses. Those transduction complexes enclose
specific receptor proteins, transductive proteins (i.e. G-proteins) and enzymes (i.e. adenylate
cyclase or phospolipase C), which enormously amplify the initial weak impact promoted by
the binding of the signalling molecules to their specific receptors. In this sense we can talk
about the cell membranes as powerful “amplifiers” of electrochemical or biochemical events
occurring in their surroundings. As a consequence of the chemical mediator- receptor
interaction, effector molecules at cytosolic levels are triggered -the so called “second
messengers”- inducing in turn specific metabolic changes. The best known second
messenger molecules are: cyclic-adenosine-monophosphate (cAMP) (Sutherland, 1972);
diacylglycerol and inositol trisphosphate (Downes, 1983; Berridge and Irvine, 1984;
Nishizuka, 1984); Ca
2+
ions, central to our model presented in § 3.4 (Nahorski, 1988;
Eberhard and Holz, 1988); arachidonate (Irvine, 1982; Loeb and Gross, 1986; Axelrod et al.,
1988) and free fatty acids (Ordway et al., 1991).
Therefore in considering the mechanisms of interaction between ELF-EMF and cell
membranes we have to take into account the possibility of a direct effect of ELF-EMF on
receptor- and transductive-proteins and enzymes and interaction mechanisms. We cannot
ignore either the phospholipid bilayer, which mainly constitutes the physical support of the
membrane or the glycocalyx, which is an extracellular plasma membrane component
essential in the interactions between the cell and its extracellular surroundings. Same can be
said about the inner surface molecules, which capture free positive ions, e. g. Ca
2+
.
Non-linear-non-equilibrium processes have been considered as essential ones, at critical steps
in the transmembrane signal coupling (Adey 1986, 1988 a, b), for the “amplification” of the
weak EM energy conveyed by the ELF-EMF interacting with the plasma membrane in order
to produce e.g. Ca
2+
liberation from their membrane stores (as discussed in § 3.4) (del Moral
and Azanza, 1992). The mechanism here proposed actually is not an energy amplification
one but nevertheless a cooperative mechanism within PP clusters (see below). The assumption
of having the cell membrane in a non-equilibrium or metastable state of potential energy
provides for the possibility that a weak energy EMF stimulus can produce a significant
perturbation of the membrane. On the other hand a physical or physicochemical non-linear
“device” produces upon a “small” input signal S
i
, a sort of amplification giving as output a
“small” signal S
0
= GS
i
, with G>1 only if the “characteristic” curve output vs input is non-
linear (Bleaney and Bleaney, 1965). However, an alternative or concomitant way for
amplification is cooperativism among the molecular components of the membrane surface.
Through a cooperative mechanism, the release of ELF-EM energy at a point in the
membrane can be enlarged by the interaction of such a point with another one receiving the
released energy and feeding back to the first point part of such energy output plus the one
received by itself, within a closed-cycle loop (feedback). It is worthwhile to say that studies
on the electrical properties of the squid giant axon (Cole and Curtis, 1939), which led to the
well-known Hodgkin-Huxley equations, already showed clearly the non-linear
characteristics of excitable biological membranes (Hodgkin and Huxley, 1952).
We should also clearly distinguish between two different ways of interpreting the action of
EMF on cell membranes: through the electric field action or through the magnetic one,
although when this is time varying (EMF), most theories attach cell effects to the electric one,
directly impressed by the EMF and the one induced by the accompanying time-dependent
MF (Faraday induction). Nevertheless it is noteworthy that when applying EMF of ELF to
cells and tissues, the devices used to apply the quasistationary fields are such that the field
is an electric one, except for few cases where the EMF was applied with coils, fed by AC
currents, and then it is only
when we can talk about the application of a quasistationary MF.
In either situation the accompanying field, magnetic in the former case and electric in the
latter, is negligible.
We have experimentally shown that increased free intracellular Ca
2+
ions concentration
promoted under static (Azanza and del Moral, 1994) and ELF-MF (Pérez-Bruzón et al., 2004)
induces modification of the bioelectric activity on neurons. MF of the order of magnitude
used in our experiments ( ≈ 1mT-0.7 T in experiments applying static MF and 0.2 μT-15 mT
in experiments applying ELF-MF) are incapable of opening Ca
2+
-membrane channels or
producing by ionization the liberation of Ca
2+
from the binding sites on the neurone
membrane. Nevertheless if we consider the combined effect of superdiamagnetism and
Coulomb explosion upon Ca
2+
ions, they can be liberated on both sides of the membrane (del
Moral and Azanza, 1992). The model is based upon the strong repulsion that the Ca
2+
ions,
attached to both sides of the membrane phospholipids (Fig.1), suffer when the nearest
neighbour (N.N.) opposite extremes of such diamagnetic dipoles (Fig.22) come close enough to
suffer Coulombic repulsion forces with a energy higher than the ionic binding energy to the
membrane surface, ε
b
. According to the described membrane structure, such electrostatic
interaction can only occur between PS-GL pairs. These charged heads are immersed in water
with a very high dielectric constant (
r
ε
80), giving to this structure low electrostatic
repulsive energy, and therefore great stability at its ground state (GS), i.e. without EMF
application or against thermal fluctuations.
BioelectricEffectsOfLow-FrequencyModulatedMicrowaveFieldsOnNervousSystemCells 609
hydrogen bond energies of ≈ 0.16 eV/molecule), or the specific heat (1cal/mole K) for the
water within the cell, to produce any noticeable thermal effects (the above energy is around
10
-8
times smaller than that needed one to rise the temperature of the cell by 1K at room
temperature).
An ELF-EMF, both through the EF and through the MF by means of the Faraday induction
effect, will produce electric currents in the ionic aqueous solution surrounding the cell.
However, the cell membrane is a strong dielectric (ε
r
≈ 6) barrier for the passage of those
currents to the intracellular medium, except for a small reduced fraction. Therefore if the
ELF-EMFs have to produce any effects inside the living cells perhaps they must be through
subtle alterations at the membrane level which in turn should convey signals across the
membrane body to produce any eventual biochemical and physiological response. The
unique characteristics of biological membranes make them the first candidates when
searching for EMF interaction sites. Membranes from specialized cells couple the stimuli,
carried out by chemical mediators as
hormones and neurotransmitters, with the cytosolic
machinery inducing in turn physiological responses. Those transduction complexes enclose
specific receptor proteins, transductive proteins (i.e. G-proteins) and enzymes (i.e. adenylate
cyclase or phospolipase C), which enormously amplify the initial weak impact promoted by
the binding of the signalling molecules to their specific receptors. In this sense we can talk
about the cell membranes as powerful “amplifiers” of electrochemical or biochemical events
occurring in their surroundings. As a consequence of the chemical mediator- receptor
interaction, effector molecules at cytosolic levels are triggered -the so called “second
messengers”- inducing in turn specific metabolic changes. The best known second
messenger molecules are: cyclic-adenosine-monophosphate (cAMP) (Sutherland, 1972);
diacylglycerol and inositol trisphosphate (Downes, 1983; Berridge and Irvine, 1984;
Nishizuka, 1984); Ca
2+
ions, central to our model presented in § 3.4 (Nahorski, 1988;
Eberhard and Holz, 1988); arachidonate (Irvine, 1982; Loeb and Gross, 1986; Axelrod et al.,
1988) and free fatty acids (Ordway et al., 1991).
Therefore in considering the mechanisms of interaction between ELF-EMF and cell
membranes we have to take into account the possibility of a direct effect of ELF-EMF on
receptor- and transductive-proteins and enzymes and interaction mechanisms. We cannot
ignore either the phospholipid bilayer, which mainly constitutes the physical support of the
membrane or the glycocalyx, which is an extracellular plasma membrane component
essential in the interactions between the cell and its extracellular surroundings. Same can be
said about the inner surface molecules, which capture free positive ions, e. g. Ca
2+
.
Non-linear-non-equilibrium processes have been considered as essential ones, at critical steps
in the transmembrane signal coupling (Adey 1986, 1988 a, b), for the “amplification” of the
weak EM energy conveyed by the ELF-EMF interacting with the plasma membrane in order
to produce e.g. Ca
2+
liberation from their membrane stores (as discussed in § 3.4) (del Moral
and Azanza, 1992). The mechanism here proposed actually is not an energy amplification
one but nevertheless a cooperative mechanism within PP clusters (see below). The assumption
of having the cell membrane in a non-equilibrium or metastable state of potential energy
provides for the possibility that a weak energy EMF stimulus can produce a significant
perturbation of the membrane. On the other hand a physical or physicochemical non-linear
“device” produces upon a “small” input signal S
i
, a sort of amplification giving as output a
“small” signal S
0
= GS
i
, with G>1 only if the “characteristic” curve output vs input is non-
linear (Bleaney and Bleaney, 1965). However, an alternative or concomitant way for
amplification is cooperativism among the molecular components of the membrane surface.
Through a cooperative mechanism, the release of ELF-EM energy at a point in the
membrane can be enlarged by the interaction of such a point with another one receiving the
released energy and feeding back to the first point part of such energy output plus the one
received by itself, within a closed-cycle loop (feedback). It is worthwhile to say that studies
on the electrical properties of the squid giant axon (Cole and Curtis, 1939), which led to the
well-known Hodgkin-Huxley equations, already showed clearly the non-linear
characteristics of excitable biological membranes (Hodgkin and Huxley, 1952).
We should also clearly distinguish between two different ways of interpreting the action of
EMF on cell membranes: through the electric field action or through the magnetic one,
although when this is time varying (EMF), most theories attach cell effects to the electric one,
directly impressed by the EMF and the one induced by the accompanying time-dependent
MF (Faraday induction). Nevertheless it is noteworthy that when applying EMF of ELF to
cells and tissues, the devices used to apply the quasistationary fields are such that the field
is an electric one, except for few cases where the EMF was applied with coils, fed by AC
currents, and then it is only
when we can talk about the application of a quasistationary MF.
In either situation the accompanying field, magnetic in the former case and electric in the
latter, is negligible.
We have experimentally shown that increased free intracellular Ca
2+
ions concentration
promoted under static (Azanza and del Moral, 1994) and ELF-MF (Pérez-Bruzón et al., 2004)
induces modification of the bioelectric activity on neurons. MF of the order of magnitude
used in our experiments ( ≈ 1mT-0.7 T in experiments applying static MF and 0.2 μT-15 mT
in experiments applying ELF-MF) are incapable of opening Ca
2+
-membrane channels or
producing by ionization the liberation of Ca
2+
from the binding sites on the neurone
membrane. Nevertheless if we consider the combined effect of superdiamagnetism and
Coulomb explosion upon Ca
2+
ions, they can be liberated on both sides of the membrane (del
Moral and Azanza, 1992). The model is based upon the strong repulsion that the Ca
2+
ions,
attached to both sides of the membrane phospholipids (Fig.1), suffer when the nearest
neighbour (N.N.) opposite extremes of such diamagnetic dipoles (Fig.22) come close enough to
suffer Coulombic repulsion forces with a energy higher than the ionic binding energy to the
membrane surface, ε
b
. According to the described membrane structure, such electrostatic
interaction can only occur between PS-GL pairs. These charged heads are immersed in water
with a very high dielectric constant (
r
ε
80), giving to this structure low electrostatic
repulsive energy, and therefore great stability at its ground state (GS), i.e. without EMF
application or against thermal fluctuations.
AdvancedMicrowaveandMillimeterWave
Technologies:SemiconductorDevices,CircuitsandSystems610
Fig. 22. (a) Schematic layout (not at scale) for the neuron membrane model, showing the
lipid molecules (sticks). Some (N.N.)PP ( 2% in our model), with attached Ca
2+
ions are
shown. The direction of the applied MF B, as well as the polar angle,, of the radial PP
molecules phospholipids (PP) molecules molecules and the angle
0
below which there is
not possible Ca
2+
liberation are also shown. (b) The same membrane under an applied
magnetic field B, where diamagnetic PP have fully rotated becoming with their long axes
orthogonal to B and the Ca
2+
charged heads approach, for a field stronger than a saturation
one, B
0
(Azanza and del Moral, 1994).
3.2 Superdiamagnetism (SD) and Ca
2
coulomb explosion (CE) model under AC
magnetic fields.
This model has been widely tested in single neurons and simple neurone networks under
static and ELF MF respectively, where in the latter the MF also induces a synchronized
bioelectric activity within those networks, as mentioned before (Azanza et al. 2002; Azanza
et al., 2005).
The model explains well the neuron bioelectric activity inhibition, i.e. the decrease of firing
frequency under applied MF due to Ca
2+
ions liberation from inner membrane surface.
Neuron excitation under applied MF is also thought to be due to increase of Ca
2+
in the
cytosol, that increases the voltage difference across membrane and opens the voltage
operated Na
+
(and Ca
2+
too) channels, giving rise to depolarization, due to the entrance of
such ions. The model inhibition contemplates three ingredients: i) The anisotropy of the
diamagnetic susceptibility tensor components,
χ
~
(< 0) of the long PP “rods”, or
difference
, between the directions parallel () and perpendicular ( ) to the PP
axis (the same applies for protein channels). ii) The well proved cluster formation in the
membrane liquid crystal of correlated PP long axes through their electric quadrupolar
moments,
˜
Q
i
interaction, of pair (i, j) correlation function
jijiQ
QQQQ=C
~
~
~
~
, by
Fig. 23. Two nearest-neighbour Ca
2+
-charged phospholipids (rods) rotate under their
assumed opposite magnetic torques, approaching the Ca
2+
ions (black circles), attached to
the PP negatively charged heads (lozenges). The ions become simultaneously detached from
the membrane surfaces when their weak ionic bonds to the heads are broken due to Ca
2+
-
Ca
2+
Coulomb repulsion. Within the cytosol the Ca
2+
ions diffuse towards the K
+
-protein
channels, which are opened when Ca
2+
is captured (within the Debye shielding length,
D
)
by the “gate” molecule (calmodulin), giving rise to the
K
outwards current
(hyperpolarization) (del Moral et al., 2008).
which the PPs cooperatively rotate out from the MF B axis (PP electric dipolar moment is
very weak). is the ensemble thermal average. The correlation length,
usually exceeds
a single neurone, via the PPs of the interposed glia membranes between neurons, and
through the gap junctions (Azanza et al. 2007a). This phenomenon is called
superdiamagnetism (SD). iii) When the Ca
2+
ions attached to their PP bilayer inner and outer
binding sites (polar heads) happen to be nearest-neighbours (NN, in number N
nn
per cluster
face, with estimated
c
N0.007
nn
N , N
c
being the PP number per cluster), and the NN PPs
suffer opposite (with clearly 1/2 probability) magnetic torques
m
mx B
, the weak ionic
bindings are broken by their mutual Coulomb repulsion, of energy
coul
. This produces a
simultaneous detaching (Coulomb explosion, CE) of
Ca
2
pairs (Fig.23 for a view of the
mechanisms involved). Note that the Ca
2+
water solvating and dielectric membrane negative
electric images formation reduce the Ca
2+
effective charge) (for more details see Azanza and
del Moral, 1994; del Moral et al. 2008).
The main result from the SD-CE model is the field intensity dependence of the neurone
bioelectric frequency,
f B
eff
,T
. This frequency is controlled by chemistry mass action law
between Ca
2+
and membrane binder radical, R
-
(sialic acid outside and phosphatidylserine
inside), i.e.
CaRBT,kRCa
eff
2
, where k is the kinetics constant. Thus f
R
becomes
inversely proportional to the number of Ca
2+
ions detached per cluster,
N
Ca
2
c
N
nn
exp E
c
k
B
T
, where
E
c
N
c
m
N
nn
coul
is the dynamic Peierls’s energy barrier
(i.e. changing with the PP rotation) to be overcome by the Ca
2+
ion in order for the PP to
steadily rotate. Moreover under AC MF the cell impulse H process (where the cytosol
BioelectricEffectsOfLow-FrequencyModulatedMicrowaveFieldsOnNervousSystemCells 611
Fig. 22. (a) Schematic layout (not at scale) for the neuron membrane model, showing the
lipid molecules (sticks). Some (N.N.)PP ( 2% in our model), with attached Ca
2+
ions are
shown. The direction of the applied MF B, as well as the polar angle,, of the radial PP
molecules phospholipids (PP) molecules molecules and the angle
0
below which there is
not possible Ca
2+
liberation are also shown. (b) The same membrane under an applied
magnetic field B, where diamagnetic PP have fully rotated becoming with their long axes
orthogonal to B and the Ca
2+
charged heads approach, for a field stronger than a saturation
one, B
0
(Azanza and del Moral, 1994).
3.2 Superdiamagnetism (SD) and Ca
2
coulomb explosion (CE) model under AC
magnetic fields.
This model has been widely tested in single neurons and simple neurone networks under
static and ELF MF respectively, where in the latter the MF also induces a synchronized
bioelectric activity within those networks, as mentioned before (Azanza et al. 2002; Azanza
et al., 2005).
The model explains well the neuron bioelectric activity inhibition, i.e. the decrease of firing
frequency under applied MF due to Ca
2+
ions liberation from inner membrane surface.
Neuron excitation under applied MF is also thought to be due to increase of Ca
2+
in the
cytosol, that increases the voltage difference across membrane and opens the voltage
operated Na
+
(and Ca
2+
too) channels, giving rise to depolarization, due to the entrance of
such ions. The model inhibition contemplates three ingredients: i) The anisotropy of the
diamagnetic susceptibility tensor components,
χ
~
(< 0) of the long PP “rods”, or
difference
, between the directions parallel () and perpendicular ( ) to the PP
axis (the same applies for protein channels). ii) The well proved cluster formation in the
membrane liquid crystal of correlated PP long axes through their electric quadrupolar
moments,
˜
Q
i
interaction, of pair (i, j) correlation function
jijiQ
QQQQ=C
~
~
~
~
, by
Fig. 23. Two nearest-neighbour Ca
2+
-charged phospholipids (rods) rotate under their
assumed opposite magnetic torques, approaching the Ca
2+
ions (black circles), attached to
the PP negatively charged heads (lozenges). The ions become simultaneously detached from
the membrane surfaces when their weak ionic bonds to the heads are broken due to Ca
2+
-
Ca
2+
Coulomb repulsion. Within the cytosol the Ca
2+
ions diffuse towards the K
+
-protein
channels, which are opened when Ca
2+
is captured (within the Debye shielding length,
D
)
by the “gate” molecule (calmodulin), giving rise to the
K
outwards current
(hyperpolarization) (del Moral et al., 2008).
which the PPs cooperatively rotate out from the MF B axis (PP electric dipolar moment is
very weak). is the ensemble thermal average. The correlation length,
usually exceeds
a single neurone, via the PPs of the interposed glia membranes between neurons, and
through the gap junctions (Azanza et al. 2007a). This phenomenon is called
superdiamagnetism (SD). iii) When the Ca
2+
ions attached to their PP bilayer inner and outer
binding sites (polar heads) happen to be nearest-neighbours (NN, in number N
nn
per cluster
face, with estimated
c
N0.007
nn
N , N
c
being the PP number per cluster), and the NN PPs
suffer opposite (with clearly 1/2 probability) magnetic torques
m
mx B
, the weak ionic
bindings are broken by their mutual Coulomb repulsion, of energy
coul
. This produces a
simultaneous detaching (Coulomb explosion, CE) of
Ca
2
pairs (Fig.23 for a view of the
mechanisms involved). Note that the Ca
2+
water solvating and dielectric membrane negative
electric images formation reduce the Ca
2+
effective charge) (for more details see Azanza and
del Moral, 1994; del Moral et al. 2008).
The main result from the SD-CE model is the field intensity dependence of the neurone
bioelectric frequency,
f B
eff
,T
. This frequency is controlled by chemistry mass action law
between Ca
2+
and membrane binder radical, R
-
(sialic acid outside and phosphatidylserine
inside), i.e.
CaRBT,kRCa
eff
2
, where k is the kinetics constant. Thus f
R
becomes
inversely proportional to the number of Ca
2+
ions detached per cluster,
N
Ca
2
c
N
nn
exp E
c
k
B
T
, where
E
c
N
c
m
N
nn
coul
is the dynamic Peierls’s energy barrier
(i.e. changing with the PP rotation) to be overcome by the Ca
2+
ion in order for the PP to
steadily rotate. Moreover under AC MF the cell impulse H process (where the cytosol
AdvancedMicrowaveandMillimeterWave
Technologies:SemiconductorDevices,CircuitsandSystems612
becomes more negative due the K
+
ions sorting out, Fig.2) is modified by the Ca
2+
ions (in
number of four) binding to the K
+
protein-channel (more specifically to the calmodulin
“gate” molecule) and opening it due to the calmodulin electrical unfolding (Babu et al.,
1985). Therefore it should be
f 1 N
Ca
2
, to first order. Summing now
N
Ca
2
c
from all the PP
clusters in membrane(s), the final result is that the neurone bioelectric frequency varies with
the RMS MF as
f B
eff
,T
f 0,T
exp B
eff
2
, (8)
where
f 0, T
is the spontaneous frequency and the important parameter model
c
V 2
0
k
B
T
, that encompasses the PP cluster physical properties and membrane
temperature, T, and allows the experimental determination of N
c
, or PP number in a
membrane(s) cluster (del Moral and Azanza 1992; Azanza and del Moral 1994). As
mentioned before for ELF AC MF (quasistatic) we have introduced in [8] the RMS B
eff
, since
magnetic energy density stored in the membrane is
0
2
2tB
, of time average
0
2
eff
2B
.
Eq.[8] has been widely and firmly tested in single neurons of Helix aspersa for static (del
Moral and Azanza 1992) and ELF weak MF (Azanza and del Moral 1998) and for
temperature, T modification (Pérez-Bruzón, 2006). The exponential law [8] has been tested
for static MF application and in Fig. 24 we plot the logarithm of f against B
2
for several
mapped neurons, for B between 0 and 0.7 T and where we distinguish two linear regimes,
with different slopes, due to the different N
c
(at the higher fields the clusters are likely
fractured and N
c
decreases). If we assume N
c
= 5 x 10
6
PP/cluster (as deduced from SQUID
magnetization measurements in erythrocyte membranes (Azanza et al., 1993)) we obtain a
value of
rather close to the measured value, giving good selfconsistence to the model
(Azanza and del Moral, 1994). Note that at a critical field all activity is abolished through a
first order transition. Now for weak ELF MF the observed firing frequency, f, in Helix
neurons follows a dependence
f B
eff
f 0
1 B
eff
2
, which precisely is the obtained one
by performing a series expansion of [8] for
eff
2
1
(Azanza and del Moral., 1996).
Regarding to f (T) dependence, observations in mapped Helix neuron F47 show that f first
decreases with increasing T at fixed
B
eff
, in disagreement with eq.[8] (see Fig.25). The reason
is that those neurons belong to the
26% of studied ones where f increases with increasing
Fig. 24. The logarithm of the firing frequency for several Helix neurons vs. the square of the
applied magnetic field, B. The slope of the linear portions gives
Tk2VN
B0c
, with Nc
underlying a sudden change at 0.05T (Azanza and del Moral, 1994).
Fig. 25. Temperature effect for neurone F47 bioelectric activity. Transitions at 30ºC and 37ºC
within the membrane liquid crystal are observed.
B
eff
(Azanza and del Moral 1994). The responsible mechanism is that the by MF detached
Ca
2
ions depolarize the membrane, cytosol becoming more positive, so opening Na
+
and/or Ca
2+
channels operated by voltage (bioelectric activity stimulation mechanism). Also
D amplitude V
d
decreases, the calculated variation in V
d
being
effd
BV
4 N
c
E
p
exp B
eff
2
, where E
p
is the pump e.m.f., due to opposite to PP protein pump
rotation (since
χχ
), where PP partially hidden the protein pump, desactiving it (Azanza
and del Moral 1996) (see Fig. 26). Also observed are two transitions in the form of increasing
Fig. 26. Semilog plot of depolarization voltage decrease versus B
2
; n corresponds to several
studied neurons (Azanza and del Moral, 1996.
BioelectricEffectsOfLow-FrequencyModulatedMicrowaveFieldsOnNervousSystemCells 613
becomes more negative due the K
+
ions sorting out, Fig.2) is modified by the Ca
2+
ions (in
number of four) binding to the K
+
protein-channel (more specifically to the calmodulin
“gate” molecule) and opening it due to the calmodulin electrical unfolding (Babu et al.,
1985). Therefore it should be
f
1 N
Ca
2
, to first order. Summing now
N
Ca
2
c
from all the PP
clusters in membrane(s), the final result is that the neurone bioelectric frequency varies with
the RMS MF as
f B
eff
,T
f 0,T
exp B
eff
2
, (8)
where
f 0, T
is the spontaneous frequency and the important parameter model
c
V 2
0
k
B
T
, that encompasses the PP cluster physical properties and membrane
temperature, T, and allows the experimental determination of N
c
, or PP number in a
membrane(s) cluster (del Moral and Azanza 1992; Azanza and del Moral 1994). As
mentioned before for ELF AC MF (quasistatic) we have introduced in [8] the RMS B
eff
, since
magnetic energy density stored in the membrane is
0
2
2tB
, of time average
0
2
eff
2B
.
Eq.[8] has been widely and firmly tested in single neurons of Helix aspersa for static (del
Moral and Azanza 1992) and ELF weak MF (Azanza and del Moral 1998) and for
temperature, T modification (Pérez-Bruzón, 2006). The exponential law [8] has been tested
for static MF application and in Fig. 24 we plot the logarithm of f against B
2
for several
mapped neurons, for B between 0 and 0.7 T and where we distinguish two linear regimes,
with different slopes, due to the different N
c
(at the higher fields the clusters are likely
fractured and N
c
decreases). If we assume N
c
= 5 x 10
6
PP/cluster (as deduced from SQUID
magnetization measurements in erythrocyte membranes (Azanza et al., 1993)) we obtain a
value of
rather close to the measured value, giving good selfconsistence to the model
(Azanza and del Moral, 1994). Note that at a critical field all activity is abolished through a
first order transition. Now for weak ELF MF the observed firing frequency, f, in Helix
neurons follows a dependence
f B
eff
f 0
1 B
eff
2
, which precisely is the obtained one
by performing a series expansion of [8] for
eff
2
1
(Azanza and del Moral., 1996).
Regarding to f (T) dependence, observations in mapped Helix neuron F47 show that f first
decreases with increasing T at fixed
B
eff
, in disagreement with eq.[8] (see Fig.25). The reason
is that those neurons belong to the
26% of studied ones where f increases with increasing
Fig. 24. The logarithm of the firing frequency for several Helix neurons vs. the square of the
applied magnetic field, B. The slope of the linear portions gives
Tk2VN
B0c
, with Nc
underlying a sudden change at 0.05T (Azanza and del Moral, 1994).
Fig. 25. Temperature effect for neurone F47 bioelectric activity. Transitions at 30ºC and 37ºC
within the membrane liquid crystal are observed.
B
eff
(Azanza and del Moral 1994). The responsible mechanism is that the by MF detached
Ca
2
ions depolarize the membrane, cytosol becoming more positive, so opening Na
+
and/or Ca
2+
channels operated by voltage (bioelectric activity stimulation mechanism). Also
D amplitude V
d
decreases, the calculated variation in V
d
being
effd
BV
4 N
c
E
p
exp B
eff
2
, where E
p
is the pump e.m.f., due to opposite to PP protein pump
rotation (since
χχ
), where PP partially hidden the protein pump, desactiving it (Azanza
and del Moral 1996) (see Fig. 26). Also observed are two transitions in the form of increasing
Fig. 26. Semilog plot of depolarization voltage decrease versus B
2
; n corresponds to several
studied neurons (Azanza and del Moral, 1996.
AdvancedMicrowaveandMillimeterWave
Technologies:SemiconductorDevices,CircuitsandSystems614
a T small interval, at T
f1
30º C and C37ºT
f2
, corresponding to phase transitions
within the membrane liquid crystal. After the second transition f decreases with T increase,
now in agreement with (8), although f temperature behaviour requires a deeper
investigation, and PP liquid crystal viscosity energy dissipation,
v
r
T
t
introduction
in the SD -CE model (
r
is the membrane viscosity coefficient).
3.3 Bioelectric impulse shape and frequency spectrum.
Comparison with experiments in single neurons: we will now compare our HHM model of
impulse shape (§ 1.2) with the electrophysiological experiments performed on Helix aspersa
single unit neurons, a good bench for present studies as we have already noticed. Thus in
Fig.27 we present the spontaneous (
B
eff
0
) R+H voltage time time variation for two
mapped neurons, fitted by the approximate solution eq. (4), the agreement being reasonable,
but where we do not reproduced the sigmoidal variation at the ends, due to the series cut-
off in eq. (3). The more “accurate” frequency used “sigmoidal” fit by
1 e
t
K
4
is also
shown, but its basis is purely phenomenological. We took
E
K
75 mV
,
E
Na
50 mV
(this
e.m.f. rectified by the delayed K
+
channels),
g
K
1.6 10
7
m
2
2
and
C
m
4 10
2
F
m
2
,
and from the fits we obtained the
n
0
and
K
values quoted in Table 1. Clearly we can not
identify parameters
n
0
with the number of K-protein channels (KP), with a density of
7
KP/
m
2
, which for a neurone of 100 m diameter yields
2x10
4
KP. In Fig.28 we show the
frequency spectrum of a bioelectric impulse of neurone V19, together with the fitted
theoretical one by eq. (5), using the parameter values of Table 1, the agreement being
excellent, the same happening for other neurons (not shown). Under applied AC MF we
have observed that the shape of the impulse becomes unmodified, which means that the
solution of full integral eq. (3) with I
Ca
inclusion is not needed. Integral eqs. (3) and (6) can be
easily transformed into second order linear differential equations of well known solutions,
not given here. In Fig. 28 is shown the Fourier frequency spectrum of R+H neuron impulse
tram, fitted by a Lorentzian fuction as our model predicts (see § 3.4 below).
Fig. 27. Experimental (o) and model (thick line) R+H voltage time variations for neurons F2
and V19; thin line, phenomenological sigmoidal variation.
0 5 10 15 20 25
2
3
4
5
6
7
8
9
Amplitude (mV)
time (ms)
Neurone F2
-5 0 5 10 15 20 25 30 35
-1
0
1
2
3
4
5
6
Amplitude (mV)
time (ms)
Neurone V19
Fig. 28. Frequency Fourier spectrum of R+H impulse tram. Experiment (■) and Lorentzian,
L(f), model fit L(f) (full line).
Table 1. Initial values of n, m, and h HH functions and K
+
,
K
, and Na
+
,
eff
, relaxation times.
Similarly in Figs. 29 we show the D voltages for the same neurons impulses, fitted by
eq. (6), using the above parameter values and
g
Na
1.9
10
7
m
2
2
, from the fits obtaining
the values of
m
0
3
h
0
1 4
and
eff
also quoted in Table 1. Values of
m
0
3
h
0
1 4
are larger than n
0
ones, and same above consideration apply to them. Also Na
+
relaxation times,
eff
are larger
than
K
, although in the impulse times
t
S
t
b
(Fig.27) because V
Na
t
is interrupted at the
smaller (abs.value)
E
Na
than
E
K
for V
K
t
. In Fig.30 is again shown the frequency spectrum
of
V
Na
t
for neurone V-19, and the fit by the corresponding Lorentzian. D voltage is
unmodified by applied AC MF and again solving of R+D equation under MF with
I
Ca
term
is not needed.
-2 0 2 4 6 8 10 12 14 16
-1
0
1
2
3
4
5
Amplitude (mV)
time (ms)
Neurone F2
0 5 10 15 20 25
0
1
2
3
4
5
6
Amplitude (mV)
time (ms)
Neurone V19
Fig. 29. Ibidem Fig. 27 for the depolarisation (D) process; lines: thick, model fit; thin,
phenomenological sigmoid.
0,0 0,1 0,2
0
2
4
6
8
10
Frequency (Hz)
Neurone V19
Neurone n
0
)ms(
K
m
0
3
h
0
1 4
)ms(
eff
F1 200 33.0 51 92.7
F2 188
49.4 45 149.9
V3 202 45.0 49 109.6
V14 272 12.4 58 57.0
V19 155 156.7 41 222.8
BioelectricEffectsOfLow-FrequencyModulatedMicrowaveFieldsOnNervousSystemCells 615
a T small interval, at T
f1
30º C and C37ºT
f2
, corresponding to phase transitions
within the membrane liquid crystal. After the second transition f decreases with T increase,
now in agreement with (8), although f temperature behaviour requires a deeper
investigation, and PP liquid crystal viscosity energy dissipation,
v
r
T
t
introduction
in the SD -CE model (
r
is the membrane viscosity coefficient).
3.3 Bioelectric impulse shape and frequency spectrum.
Comparison with experiments in single neurons: we will now compare our HHM model of
impulse shape (§ 1.2) with the electrophysiological experiments performed on Helix aspersa
single unit neurons, a good bench for present studies as we have already noticed. Thus in
Fig.27 we present the spontaneous (
B
eff
0
) R+H voltage time time variation for two
mapped neurons, fitted by the approximate solution eq. (4), the agreement being reasonable,
but where we do not reproduced the sigmoidal variation at the ends, due to the series cut-
off in eq. (3). The more “accurate” frequency used “sigmoidal” fit by
1 e
t
K
4
is also
shown, but its basis is purely phenomenological. We took
E
K
75 mV
,
E
Na
50 mV
(this
e.m.f. rectified by the delayed K
+
channels),
g
K
1.6
10
7
m
2
2
and
C
m
4 10
2
F
m
2
,
and from the fits we obtained the
n
0
and
K
values quoted in Table 1. Clearly we can not
identify parameters
n
0
with the number of K-protein channels (KP), with a density of
7
KP/
m
2
, which for a neurone of 100 m diameter yields
2x10
4
KP. In Fig.28 we show the
frequency spectrum of a bioelectric impulse of neurone V19, together with the fitted
theoretical one by eq. (5), using the parameter values of Table 1, the agreement being
excellent, the same happening for other neurons (not shown). Under applied AC MF we
have observed that the shape of the impulse becomes unmodified, which means that the
solution of full integral eq. (3) with I
Ca
inclusion is not needed. Integral eqs. (3) and (6) can be
easily transformed into second order linear differential equations of well known solutions,
not given here. In Fig. 28 is shown the Fourier frequency spectrum of R+H neuron impulse
tram, fitted by a Lorentzian fuction as our model predicts (see § 3.4 below).
Fig. 27. Experimental (o) and model (thick line) R+H voltage time variations for neurons F2
and V19; thin line, phenomenological sigmoidal variation.
0 5 10 15 20 25
2
3
4
5
6
7
8
9
Amplitude (mV)
time (ms)
Neurone F2
-5 0 5 10 15 20 25 30 35
-1
0
1
2
3
4
5
6
Amplitude (mV)
time (ms)
Neurone V19
Fig. 28. Frequency Fourier spectrum of R+H impulse tram. Experiment (■) and Lorentzian,
L(f), model fit L(f) (full line).
Table 1. Initial values of n, m, and h HH functions and K
+
,
K
, and Na
+
,
eff
, relaxation times.
Similarly in Figs. 29 we show the D voltages for the same neurons impulses, fitted by
eq. (6), using the above parameter values and
g
Na
1.9 10
7
m
2
2
, from the fits obtaining
the values of
m
0
3
h
0
1 4
and
eff
also quoted in Table 1. Values of
m
0
3
h
0
1 4
are larger than n
0
ones, and same above consideration apply to them. Also Na
+
relaxation times,
eff
are larger
than
K
, although in the impulse times
t
S
t
b
(Fig.27) because V
Na
t
is interrupted at the
smaller (abs.value)
E
Na
than
E
K
for V
K
t
. In Fig.30 is again shown the frequency spectrum
of
V
Na
t
for neurone V-19, and the fit by the corresponding Lorentzian. D voltage is
unmodified by applied AC MF and again solving of R+D equation under MF with
I
Ca
term
is not needed.
-2 0 2 4 6 8 10 12 14 16
-1
0
1
2
3
4
5
Amplitude (mV)
time (ms)
Neurone F2
0 5 10 15 20 25
0
1
2
3
4
5
6
Amplitude (mV)
time (ms)
Neurone V19
Fig. 29. Ibidem Fig. 27 for the depolarisation (D) process; lines: thick, model fit; thin,
phenomenological sigmoid.
0,0 0,1 0,2
0
2
4
6
8
10
Frequency (Hz)
Neurone V19
Neurone n
0
)ms(
K
m
0
3
h
0
1 4
)ms(
eff
F1 200 33.0 51 92.7
F2 188
49.4 45 149.9
V3 202 45.0 49 109.6
V14 272 12.4 58 57.0
V19 155 156.7 41 222.8