Ministry of Agriculture and Rural Development: Analysis of Technical, Economic and Social Indicators and Assessment of Technical Adoption Rate in Clam Aquaculture Households - MS10 " pot
Bạn đang xem bản rút gọn của tài liệu. Xem và tải ngay bản đầy đủ của tài liệu tại đây (280.82 KB, 46 trang )
Ministry of Agriculture and Rural Development
COLLABORATION FOR AGRICULTURE AND RURAL DEVELOPMENT (CARD)
027/05 VIE project
Development of clam culture for improvement and diversification of livelihoods of the
poor coastal communities in Central Vietnam
MS 10: Project Validation Report
Analysis of Technical, Economic and Social
Indicators and Assessment of Technical Adoption
Rate in Clam Aquaculture Households
Nguyen Xuan Suc
1
, Dinh Van Thanh
1
, Chu Chi Thiet
2
, and Martin S Kumar
3
1
Center for Aquaculture Engineering and Technology Transfer
Dinh Bang - Tu Son - Bac Ninh, Vietnam
2
Aquaculture Research Sub Institute for North Central Vietnam
Cua Lo - Nghe An, Vietnam
3
South Australia Research and Development Institute
PO Box 120, Henley Beach, South Australia 5022
4 March 2010
Aquaculture Research Sub Institute for North Central Vietnam South Australia Research and Development Institute
Milestone Report Project Validation
2
Table of Contents
List of tables 3
List of figures 4
Acknowledgment 4
I. INTRODUCTION 4
1.1 Introduction 4
1.2 Objective of this study 5
1.2.1 General objective
5
1.2.2 Specific objectives
5
II. STUDY METHODOLOGY 6
2.1 Study location 6
2.2 Data collection 6
2.3 Data analysis 7
III. RESULT AND DISCUSION 7
3.1. Household information 7
3.1.1 Information of respondent
7
3.1.2 Information of household
8
3.2 Clam culture activities 12
3.2.1 Clam culture technical indicators
12
3.2.2. Clam culture economic indicator
17
3.3. Factors influencing and being influenced by clam culture 24
3.3.1 Social impact of clam culture development
24
3.3.2 Influence of clam culture development on other production activities
25
3.3.3 Influence of other activities on clam culture production
25
3.3.4 Effect of clam culture on the environment
26
3.3.5 Effect from the environment on clam culture
26
3.3.6 Constraints to clam culture development
27
3.4. Technical adoption rate of trained households of pond clam culture 28
3.4.1 Pond selection
28
3.4.2 Pond preparation
29
3.4.3 Seed stocking
29
3.4.4 Algal production (live feed) and pond management
30
3.4.5 Harvesting and preservations
30
3.5 Technical adoption rate of trained farmers of inter-tidal clam culture 31
3.5.1 Site selection
31
3.5.2 Site preparation
31
3.5.3 Seed stocking
32
3.5.4 Monitoring and management
33
3.5.6 Harvesting and preservations
33
5. PROJECT IMPACT 34
6. CONCLUSION 36
7. RECOMMENDATIONS 36
8. REFERENCES 37
Appendix A: 38
Appendix B: 42
Appendix C 45
Aquaculture Research Sub Institute for North Central Vietnam South Australia Research and Development Institute
Milestone Report Project Validation
3
List of tables
Table 1: Age, gender and education information of survey respondent in the project site 8
Table 2: Household size and gender of household member in the study provinces 8
Table 3: Labor force of clam culture farm and labor involve in clam aquaculture 9
Table 4: Information on household occupation in the study area 10
Table 5: Clam aquaculture experience of household in the project area 10
Table 6: Clam culture technical training, quality and rate of applying in the study area 11
Table 7: Type and area of land holding of farmers in the study region 12
Table 8: Land used in clam aquaculture and water sources status in the research provinces .12
Table 9: Clam aquaculture area of clam farmers and tidal effect depth in the region 13
Table 10: Clam seed sources of household in the study provinces 14
Table 11: Seed stocking size and stocking density 15
Table 12: Harvesting size and productivity of clam culture 16
Table 13: Clam selling type and clam for family consumption 16
Table 14: Cost of area repair, fencing and watch tower, casting/stocking, watch/guard from
pouching, and land tax/fee 18
Table 15: Seed, fertilizer and lime costs of clam culture in the project provinces 19
Table 16: Hire labor and harvesting costs 20
Table 17: Total cost, total income, benefit and benefit-cost ratio of clam farms 22
Table 18: Capital sources, amount of borrowed capital and interest rate 22
Table 19: Household income sources of farmers in the study area 23
Table 20: The social impact of clam aquaculture development (%) 24
Table 21: Influence of clam aquaculture development on other production activities (%) 25
Table 22: Influence of other activities on clam aquaculture production (%) 26
Table 23: The effect of clam aquaculture on the environment (%) 26
Table 24: The effect from the environment on clam aquaculture (%) 27
Table 25: Constraints to clam aquaculture development (%) 28
Table 26: Adoption rate of pond clam farmers on pond selection parameters 29
Table 27: Adoption rate of pond clam farmers on pond preparation parameters 29
Table 28: Adoption rate of pond clam farmers on seed stocking parameters 29
Table 29: Adoption rate of pond clam farmers on algal production and clam pond
management parameters 30
Table 30: Adoption rate of tidal clam farmers on tidal site selection parameters 31
Table 31: Adoption rate of tidal clam farmers on tidal preparation parameters 32
Table 32: Adoption
rate of tidal clam farmers on seed stocking parameters
32
Table 33: Adoption rate of tidal clam farmers on tidal area monitoring and management 33
Table 34: Adoption rate of tidal clam farmers on harvesting and product preservation 34
Aquaculture Research Sub Institute for North Central Vietnam South Australia Research and Development Institute
Milestone Report Project Validation
4
List of figures
Figure 1: Vietnamese provincial map indicating the location of the six project provinces 6
Figure 2: Diagram of clam seed marketing channel 14
Figure 3: Diagram of clam marketing channel in the study area 17
Figure 4: Diagram indicating rate of input contribution of tidal clam culture 20
Figure 5: Diagram indicating rate of input contribution of pond clam culture 20
Acknowledgment
Authors would like to thank the following organizations and persons helped the research
team during study conducted:
•
Collaboration for Agriculture and Rural Development (CARD), which supported
financial for this study.
•
The Aquaculture Departments and the Agriculture and Fisheries Extension Centers
of Thanh Hoa, Nghe An, Ha Tinh, Quang Binh, Quang Tri and Thua Thien Hue
provinces, which provided the secondary data for this research.
•
The clam demonstration farms and the clam culture households in the project
provinces who are respondents of the survey, who were supplied the data for this
study.
I. INTRODUCTION
1.1 Introduction
Vietnam’s fisheries sector has grown rapidly over the last 20 years since the adoption of the
innovation age in the late 1980’s which implemented market oriented reforms. Foreign
investment and trade liberalisation facilitated an eight-fold increase in the volume of exports
of fisheries products between 1990 and 2002, which was supported by changes in policies
and attitudes towards the private sector and reforms in the management and operations of
state enterprises (Dung 2003). In 2002, fisheries was Vietnam’s third largest sector in terms
of total export revenue at just over US$2 billion – a 13% increase from the previous year and
contributing 11% of Vietnam’s national export earnings (MoFI 2003). It is estimated that 3.4
million people (approximately 4% of the population) derive their income directly from
aquaculture and capture fisheries (MoFI 2006). However, the total number of people whose
livelihood is dependent on the fisheries and other aquatic resources for subsistence is larger.
Aquaculture has grown rapidly in Vietnam in the past two decades and contributing for
greater than 40% in volume of total seafood export. Aquaculture in Vietnam is generally
performed as family-scale operations characterized by low-input use and requirements (Dung
2003). Growth in export value and diversification is having a positive and stabilizing effect
Aquaculture Research Sub Institute for North Central Vietnam South Australia Research and Development Institute
Milestone Report Project Validation
5
on Vietnamese households, especially in terms of employment, income and skills growth.
However, due to disease outbreak resulting from a consequence of water deterioration,
especially in the shrimp farming system, this is resulting in a reduction in aquaculture
production. In this context, a trend to diversity culture species needs to be considered.
Expansion and diversification of culture system areas can surely boost production and market
value. This re-enforces the Vietnamese government’s plan for a total production of 50,000
tones of mollusk to be produced annually by the year 2010 (MoFI master plan, 2006).
Mollusk is a promising activity as it has a high total value despite a low production rate.
Clam culture being the most profitable consideration. However, clam culture has the
disadvantage that it relies mainly on the capture of seed from nature. Seed production and
integration culture systems have been poorly investigated. Currently, farmers are making
total use of a flat tidal zone for clam culture. In some north and central provinces, stocking of
hard clam seed in shallow inshore waters has provided a low cost alternative income to the
poor fisher households. Under the financial support from Vietnamese government and
Australian Agency for International Development, a project titled “Development of clam
culture for improvement and diversification of livelihoods of the poor coastal communities in
Central Vietnam” was jointly undertaken by Aquaculture Research Sub Institute for North
Central Vietnam (ARSINC) and South Australian Research and Development Institute
(SARDI). This report is one of the outputs which validate the project by presenting the
socio-economic, technical evaluation, clam culture influence, and technical adoption rate of
clam households. In addition, the results of this report were also compared with the “Baseline
Survey” report wherever it was possible.
1.2 Objective of this study
1.2.1 General objective
The overall objective of this study is to assess the technological, social and economic impacts
and technical adoption rate of clam aquaculture households in the six north central provinces
of Vietnam.
1.2.2 Specific objectives
• To compare production performance of clam trials and trained households with the
Baseline study conducted at the beginning of the project;
• To evaluate the economic and social impacts of project at the household level in the
six project’s provinces; and
• To assess the technical adoption rates of tidal and pond clam culture households in the
project areas.
Aquaculture Research Sub Institute for North Central Vietnam South Australia Research and Development Institute
Milestone Report Project Validation
6
II. STUDY METHODOLOGY
2.1 Study location
This investigation was conducted in six provinces situated in North Central Vietnam,
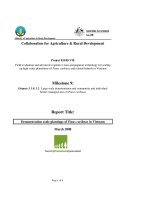
includes: Thanh Hoa, Nghe An, Ha Tinh, Quang Binh, Quang Tri and Thua Thien - Hue (Fig.
1).
Figure 1: Vietnamese provincial map indicating the project locations
2.2 Data collection
Primary and secondary data collections were carried out for the preparation of this report.
Two semi-structured standardized questionnaires (appendices A and B) were used for
collecting the primary data. The first questionnaire ((appendices A) was used for the
collection of data on technical, socio-economic status of clam households in the six provinces
where project implementation (clam culture development) was carried out. Two types of
clam farming systems were surveyed including inter-tidal clam aquaculture and pond clam
aquaculture households. The questionnaire focused on five sections: information about the
household, land and water holding by households, information of clam culture, information
on family income sources, and factors influencing and being influenced by clam culture.
The second questionnaire was used to survey data on technical adoption rate. This
questionnaire was used for both types of tidal and pond clam culture farms. This
Thanh Hoa
N g h e
An
H a
Tinh
Q
uan
g
Binh
Q
uan
g
T
ri
Travel rout during
20-25
August
2005 for the project developmentand
stakeholder/ beneficiary analysis
Thanh Hoa
Nghe An
Ha Tinh
Quang Binh
Quang Tri
Thua Thien-Hue
PROJECT PROVINCES
Aquaculture Research Sub Institute for North Central Vietnam South Australia Research and Development Institute
Milestone Report Project Validation
7
questionnaire had two main parts. Part one was used to collect information on clam culture
pond households with seven subsections indicating pond selection criteria; pond cleaning;
seed selection and stocking; algal production and pond management; harvesting and
preservation; preparing production plan, data recording and financial analysis; and household
suggestions. Part two was used for the collection of information on clam culture by tidal
households involving seven subsections which include: site selection; site preparation; seed
stocking; monitoring and management; harvesting and preservation; production plan making,
data recording and financial analysis; and household suggestions
Secondary in formations were collected from published and unpublished reports and data
gathered from fisheries departments.
2.3 Data analysis
Collected data and information were validated and assessed. Data was also classified and
analyzed based on types of clam culture (tidal and pond clam culture) in all provinces at the
project location.
EXCEL software was used to analysis data. Descriptive statistics on the
variables of mean, min., max., percentage were calculated to describe the clam farming
systems and assesses technical adoption rate of trained clam households.
III. RESULT AND DISCUSION
This section is divided into five sub-sections; general household information (Section 3.1),
clam culture activities (Section 3.2), factors influencing and being influenced by clam culture
(Section 3.3), technical adoption rate of trained households of pond clam culture (Section
3.4), and technical adoption rate of trained households of inter-tidal clam culture (Section
3.5). Data of this survey is compared with the data given in the Baseline report at the
beginning of the project stage; however, the comparison is only made wherever it was
possible.
3.1. Household information
3.1.1 Information of respondent
The information about age, gender and education of clam culture farmers in the project site
are presented in the Table 1. The tidal and pond clam culture respondents were from a wide
age group. The average age of respondents in whole region was 47.9 years and ranged
between 28 to 56 years. There was not much difference in average age noticed from the
Baseline survey (45.2 years). The difference in respondents age of tidal (48.2 years) and pond
(47.7 years) clam culture groups are not significant. The pond clam culture is relatively a new
activity which was taken-up after this CARD project implementation.
Male respondent occupied a major proportion of both tidal and pond clam culture groups
accounting for 95.9 and 94.2 %, respectively. Only 4.7% of respondents are female and this
percentage ranged between 4.1% (tidal culture group) and 5.8% (pond culture group).
Aquaculture Research Sub Institute for North Central Vietnam South Australia Research and Development Institute
Milestone Report Project Validation
8
In the study area, the entire clam culture respondents (farmers) were literate. In general, there
were 57.9% of respondents that had completed a secondary school level of education. The
figures of tidal and pond clam culture group were 59.8 and 55.1%, respectively. Respondents
with a high school level of education were the second largest proportion with an average of
34.2% in all provinces and farming systems ranged between 33.1% and 38.1% of tidal and
pond clam culture groups respectively. With regard to other respondent education levels such
as primary school and vocational levels were low in percentage.
Table 1: Age, gender and education information of survey respondent in the project site
Indicator Tidal culture Pond culture Total
Mean
48.2 47.7 47.9
Min
32.0 28.0 28.0
Age (year)
Max
54.0 56.0 56.0
Male
95.9 94.2 95.3
Gender (%)
Female
4.1 5.8 4.7
Primary school
6.5 5.5 6.3
Secondary school
59.8 55.1 57.9
High school
33.1 38.1 34.2
Vocational
2.6 1.2 1.6
University
0.0 0.0 0.0
Education (%)
Illiterate
0.0 0.0 0.0
3.1.2 Information of household
3.1.2.1 Household members
The data about household size and household member’s gender are presented in the Table 2.
The household size averaged 5.6 persons per farm. There was no significant difference in
household size between tidal culture and pond culture groups (5.4 compared to 4.9 persons
per household, respectively). Numbers of male and female averaged 2.7 and 2.9 persons per
farm for the project area respectively.
Table 2: Household size and gender of household member in the study provinces
Indicator Tidal culture Pond culture Total
Mean
5.4 5.9 5.6
Min.
2.0 3.0 2.0
Total (person)
Max.
6.0 7.0 7.0
Mean
2.5 2.8 2.7
Min
1.0 2.0 1.0
Male (person)
Max
4.0 4.0 4.0
Mean
2.9 3.1 2.9
Min
1.0 3.0 1.0
Female (person)
Max
3.0 4.0 4.0
Aquaculture Research Sub Institute for North Central Vietnam South Australia Research and Development Institute
Milestone Report Project Validation
9
3.1.2.2 Household labor
The information on the household labor force and labor required in clam aquaculture is
presented in the Table 3. There was no significant difference in the total labor force of
households, or gender for the labor member ratio between tidal and pond clam culture. On
average for all six study provinces, the number of laborers per household was 3.4, of which
male and female laborers were 2.2 and 1.2 persons, respectively.
For clam aquaculture labor, the numbers of family members involved in tidal clam
aquaculture was higher than that in pond culture (2.8 compared to 1.8 labors per farm).
Calculated labor of both tidal and pond clam culture was 2.3 persons per household, ranging
between 1 and 4 laborers per household. This is less than the Baseline survey (2.7 labors per
farm). However, at the time of the Baseline survey, only tidal clam culture was being
practiced in the project area. This report is prepared based on the information collected on
both pond and tidal clam culture. The numbers of laborers involved in tidal culture system
were similar between this study and the Baseline survey (2.8 and 2.7 laborers per household,
respectively).
Table 3: Labor force of clam culture farm and laborers involved in clam aquaculture
Indicator Tidal culture Pond culture Total
Mean
3.3 3.6 3.4
Min
1.0 1.0 1.0
Total labor
(person)
Max
4.0 5.0 5.0
Mean
2.1 2.3 2.2
Min
1.0 1.0 1.0
Male labor
(person)
Max
4.0 3.0 4.0
Mean
1.2 1.3 1.2
Min
1.0 1.0 1.0
Female labor
(person)
Max
3.0 3.0 3.0
Mean
2.8 1.8 2.3
Min
1.0 1.0 1.0
Aquaculture
labor (person)
Max
4.0 3.0 4.0
3.1.2.3 Household occupation
Table 4 shows the information on occupational status of studied household in the project
area. The two occupations indicated as the main job for the households include aquaculture
and agriculture activities. Aquaculture was found to be the main occupation with a very high
proportion (95.2%); in general, only 4.8% of farmers believed that agriculture was the main
occupation for their families. There was not much difference in the percentages of main
occupation for aquaculture and agriculture between tidal and pond clam aquaculture groups
(97.0% compare to 91.5% and 3% compare to 6.5%, respectively).
Aquaculture Research Sub Institute for North Central Vietnam South Australia Research and Development Institute
Milestone Report Project Validation
10
The respondents indicated six activities as supplementary occupations for households in the
study area. These activities include: aquaculture, agriculture, fisheries capture, fish
processing, trade, and labor services. Aquaculture as a sup-occupation percentage was low in
both tidal and pond culture groups and occupied only 4.8%, in general. Other activities of
sup-occupation ranged between 13.1% and 21.7% respectively. Many families had no
supplementary occupation.
Table 4: Information on household occupations in the study area
Indicator Tidal culture Pond culture Total
Aquaculture
97.0 91.5 95.2
Main occupation
(%)
Agriculture
3.0 6.5 4.8
Aquaculture 3.0 6.5 4.8
Agriculture 18.5 21.7 19.6
Fisheries capture 13.6 16.1 15.2
Fisheries processing 17.0 18.3 18.0
Trade/services 15.7 11.6 13.1
Supplementary
occupations (%)
Labor 20.3 15.8 18.4
3.1.2.4 Household clam aquaculture experiences
Clam aquaculture experiences for households in the project area were presented in the Table
5. In general, the average experience of clam culture households was 4.7 years and widely
ranged from 1 to 10 years. Farmers who practiced tidal clam aquaculture had more
experience than that of pond clam culture (6.5 compare to 1.7 years). Please note that before
the implementation of this CARD project there was no commercial pond clam culture
existing in Vietnam. The ranking of culture experience for the two groups was also different,
tidal culture ranged between 2 and 10 years, but pond culture ranged between 1 and 2.5 years.
In the Baseline report, the experience of tidal clam culture for households was 7.3 years, this
is a comparatively longer time than that of the estimated period in this study. This may be due
to the fact that more farms practiced tidal clam culture in recent years and this project
contributed to the increase in clam culture. Therefore, the average years of clam farming
experience was lower.
Table 5: Clam aquaculture experience of households in the project area
Indicator Tidal culture Pond culture Total
Mean 6.5 1.7 4.6
Min 2.0 1.0 1.0
Clam
aquaculture
experience
(year)
Max 10.0 2.5 10.0
Aquaculture Research Sub Institute for North Central Vietnam South Australia Research and Development Institute
Milestone Report Project Validation
11
3.1.2.4 Household clam culture training
The information about technical training, training quality and rate of technical application
were showed in the Table 6. 84.2% of households in the project area were trained in clam
culture techniques. More pond culture households were trained in technical aspects than tidal
culture households (95.3% compared to 75.4%, respectively). Most of the farmers indicated
that the quality of technical training courses was good (83.5%). More farmers in the pond
clam culture group appreciated the quality of the training course compared to farmers of tidal
clam culture group (86.3% compare to 76.2%). 13.5% of households rated the training
received as satisfactory. 12.5 % of the farmers undertaking pond clam culture and 20.2 % of
tidal culture groups reported receiving satisfactory levels of training. Some farmers thought
that the quality of the training courses were bad (1.2%) or others did not answer (1.8%).
It was estimated that 96.4% of clam farmers that had undertaken training courses applied the
new techniques. In the pond clam culture group, this proportion was 100%. However, a
slightly lower percentage (95.2%) was reported in the tidal clam culture group. Therefore, it
can be concluded that the training provided under this project has had a significant impact on
the application of advanced clam culture techniques.
Table 6: Clam culture technical training, quality and rate of application in the study
area
Indicator Tidal culture Pond culture Total
Yes
75.4 95.3 84.2
Technical
training (%)
No
24.6 4.7 15.3
Good
76.2 86.3 83.5
Satisfactory
20.2 12.5 13.5
Bad
1.2 0.0 1.2
Training
quality (%)
No answer
2.4 1.2 1.8
Yes
95.2 100.0 96.4
Technical
apply (%)
No
4.8 0.0 3.6
3.1.2.5. Land holding
Type and area of land holdings for household are presented in the Table 7. On average, the
total area of land holdings was about 1.53 ha per household. The land used as the project site
for aquaculture ranged widely between 0.25 and 15.72 ha per farm. Average tidal clam
culture land holdings was comparatively larger (1.75 ha per farm) than pond areas ranging
between 0.45 and 15.72 ha per farm. Pond clam households used 1.12 ha per farm to culture
clams and ranged between 0.25 and 4.20 ha per farm. In the Baseline survey, the average on
tidal farm area was 3.81 ha per household, much higher than this study. This may be
explained due to the fact that in recent years many more farmers practiced clam tidal culture
and many of them were small farms due to limited availability of tidal area.
Aquaculture Research Sub Institute for North Central Vietnam South Australia Research and Development Institute
Milestone Report Project Validation
12
Table 7 demonstrates that the agriculture land is only 0.27 ha per household, and ranged
between 0.05 and 0.53 ha per farm. Pond culture farmers owned more land area than the tidal
culture group (0.33 compare to 0.14 ha per farm, respectively). Other land uses such as
garden and house land is about 0.2 ha per family, and ranged between 0.18 and 0.21 ha per
farm.
Table 7: Type and area of land holding for farmers in the study region
Indicator Tidal culture Pond culture Average
Mean 1.75 1.12 1.53
Min 0.45 0.25 0.25
Aquaculture
area (ha)
Max 15.72 4.20 15.72
Mean 0.14 0.33 0.27
Min 0.05 0.14 0.05
Agriculture
area (ha)
Max 0.25 0.53 0.53
Mean 0.21 0.18 0.20
Min 0.05 0.04 0.04
Other (ha)
Max 0.50 0.35 0.50
3.2 Clam culture activities
3.2.1 Clam culture technical indicators
3.2.1.1 Pond/tidal area condition and clam culture system
The origin of land used in clam aquaculture and pond water sources statistics in the study
area are shown in the Table 8. Almost all the land (91.3%) used in aquaculture was converted
from unused land. All of the tidal culture households used bare land or tidal flats to culture
clams. There was 21.5% of the clam farming pond culture group converting agriculture land
into clam culture. Whereas the proportion of farmers who used unused land for the culture of
clams in ponds was 78.5%. It has appeared that almost all farmers in the study area used bare
land, tidal flats or less profitable agriculture land to do clam culture with the aim of increased
profit.
Table 8: Land used in clam aquaculture and water sources status in the research
provinces
Indicator Tidal culture Pond culture Total
Agriculture 0.0 21.5 8.7
Origin of land
used (%)
Unused land 100.0 78.5 91.3
Polluted 12.0 18.0 16.4
Water sources
status (%)
Unpolluted 88.0 82.0 83.6
83.6% of the surveyed farmers indicated that water sources used for clam culture were
unpolluted. In the overall study area, 16.4% of households answered that water sources were
Aquaculture Research Sub Institute for North Central Vietnam South Australia Research and Development Institute
Milestone Report Project Validation
13
polluted. Water pollution described here was only from agriculture and other farming
activities. This survey does not cover chemical pollution from industry.
3.2.1.2 Pond/tidal clam culture area
Table 9 presents the clam aquaculture area and water depth in the study provinces. On
average for both tidal and pond culture household groups, the clam aquaculture area is 1.05
ha per household. There clam culture area, ranged between 0.04 and 7.50 ha per house hold.
The area of the clam tidal farming farm is much higher than that of pond culture group
(1.45ha compare to 0.56 ha,).
The depth of clam culture in the tidal flats is totally depended on tidal regime, the
topographical and slope of the flats. In the survey region, the water depth reached up to 2.5
m, with an average of 1.56 m. While the depth of the average clam pond culture systems was
0.52 m, and ranged from 0 to 1 m.
Table 9: Clam aquaculture area for clam farmers and tidal effect depth in the region
Indicator Tidal culture Pond culture Total
Mean 1.45 0.56 1.05
Min 0.45 0.04 0.04
Area (ha)
Max 7.50 0.70 7.50
Mean 1.56 0.52 0.90
Min 0.00 0.00 0.00
Tidal effect
depth (m)
Max 2.50 1.00 2.50
3.2.1.3 Seed source
Clam seed used in the study area came from two sources which include (i) wild and (ii)
hatchery. Data of seed sources are shown in Table 10. Figure 2 indicated the clam seed
marketing channel in the study region. Clam seed production from hatcheries started 16
months ago from the first government hatchery established at ARSINC research facility
under this CARD project. Since then there are 4 other hatcheries established with a total
capacity of 18-20 million spat. These four hatcheries are:
(i) Hoang Thanh Fisheries Seed Production Centre (Thanh Hoa province);
(ii) Hai Tuan Fisheries Seed Production Hatchery (Ninh Binh province);
(iii) Van Xuan Fisheries Seed Production Hatchery (HCM City); and
(iv) Aquaculture Research Sub Institute for North Central Vietnam (ARSINC)
Therefore seed produced from recently established clam hatcheries has only been available
for the last 16 months. These hatcheries are not yet functioning at the full capacity . It will
take at least another 1-2 years for the hatcheries to be functioning at full capacity. Hopefully,
in accordance with plans these hatcheries would function at 100% of there potential and will
also expand in the next few years to produce more spat to meet the increasing clam seed
demand.
Aquaculture Research Sub Institute for North Central Vietnam South Australia Research and Development Institute
Milestone Report Project Validation
14
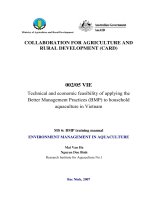
Figure 2: Clam seed marketing channel
Currently, the majority of clam seed is collected from the wild. The survey showed that the
clam spat is marketed through two channels which includes, wild seed directly collected by
farmers themselves and is also purchased from middlemen. 97% of seed source for the pond
culture group was supplied from middlemen, while this figure of tidal culture farmers was
84.3%.
Table 10: Clam seed sources of household in the study provinces
Indicator Tidal culture Pond culture Total
Collected from wild 15.7 0.0 8.9
Wild
collected (%)
From middleman 84.3 97.0 91.1
Gov. hatchery 0.0 3.0 1.2
From
hatchery (%)
Private hatchery 0.0 0.0 0.0
There is a parallel trade of advanced seed production using wild spat existing in some
provinces within the project command area. This type of clam seed production is relatively
slow and takes a few months to produce juvenile clam seed to stock in the grow-out farms.
This spat nursery activity is mainly carried out in tidal areas. The spat collected from the wild
is mainly from Ben Tre, Tien Giang provinces, in Southern Vietnam and a small percentage
from Thai Binh, Nam Dinh provinces in Northern Vietnam and is transported to the tidal
nursing centre. Currently with the technical assistance from this project, the spat are being
Seed collected from
wild (99%)
Seed sourced from
hatchery (1%)
Wholesaler (91%)
Seed collector (labor)
(
8%
)
Retailer
Clam farmer
This channel is
being developed)
16
%
75%
1%
0
%
8
%
Aquaculture Research Sub Institute for North Central Vietnam South Australia Research and Development Institute
Milestone Report Project Validation
15
nursed in ponds within a shorter time period and have become more available for the farm.
This is one of the key achievements of this project.
3.2.1.4 Seed stocking size and density
Table 11 presents the seed stocking size and stocking density in different clam culture
systems within the study area. There is a significant difference of seed stocking size between
tidal and pond culture systems. Seed stocking size in the pond culture groups was much
bigger than that of tidal culture farmers group (compared to 285.3 seeds per kg ponds to
785.7 seeds per kg in tidal area). The average stocking size of clams ranged between 240 and
1,000 seeds per kg and averaged 561.5 seeds per kg. It was noted that present seed stocking
sizes in the tidal culture was smaller compared to the Baseline data (before the project
implementation).
Table 11: Seed stocking size and stocking density
Indicator Tidal culture Pond culture Total
Mean 785.7 285.3 561.5
Min 320.0 240.0 240.0
Seed stocking
size (seed/kg)
Max 1,000.0 450.0 1,000.0
Mean 102.6 68.8 95.6
Min 50.0 25.0 25.0
Stocking
density
(seed/m
2
)
Max 150.0 85.0 150.0
The average stocking density for both the tidal and pond culture systems was 95.6 seeds per
m
2
and varied significantly ranging from 25 to 150 seeds per m
2
. Pond clam culture farmers
stocked a lower number of seed compared to tidal farmers (68.8 compare to 102.6 seed per
m
2
, respectively). The seed size and culture conditions were also taken into account while
deciding the stocking density. Tidal farmers stocked relatively smaller seed in high density
and natural feed for clams is generally more abundant in the tidal area compared to the pond
condition. Data in the baseline report showed that the clam stocking density was about
4,050.9 seed per m
2
, this is significantly higher than the density reported based on this
survey. However, the baseline survey calculated for both grow out and spat nursing systems,
whist this study concentrated more on grow out farming.
3.2.1.5 Clam harvesting size and productivity
Clam harvesting size and productivity are presented in the Table 12. The average clam
harvesting size of both pond and tidal culture types in the project area is about 52 clams per
kg and ranged from 35 to 60 clams per kg. This is not much different in terms of clam
harvesting size between this study and the Baseline survey (52 compare to 50 clams per kg,
respectively). A can be seen in Table 12, clam harvestable size of pond farmers was bigger
than that of tidal farmers (48.7 and 53.1 clams per kg, respectively).
Aquaculture Research Sub Institute for North Central Vietnam South Australia Research and Development Institute
Milestone Report Project Validation
16
The average clam productivity of both pond and tidal culture in the region is nearly 11.3
tones per ha, and varied between 4.2 and 41.4 tones per ha. There was a significant difference
in clam productivity between tidal (13 tones per ha) and pond culture (8.1 tones per ha,
respectively). In the Baseline survey report, the productivity of clam culture was found to be
about 12.7 tones per ha. Therefore, clam productivity of the Baseline survey is slightly lower
than the productivity of the tidal culture farms in this study. Clam productivity in the tidal
areas increased after the implementation of the CARD project.
Table 12: Harvesting size and productivity of clam cultures
Indicator Tidal culture Pond culture Total
Mean 53.1 48.7 51.9
Min 40.0 35.0 35.0
Harvesting
size (clam/kg)
Max 60.0 55.0 60.0
Mean 13,028.2 8,138.6 11,260.4
Min 6,876.0 4,250.0 4,250.0
Productivity
(kg/ha)
Max 41,380.0 15,560.0 41,380.0
3.2.1.6. Clam selling type and clam for family consumption
It can be seen in Table 13, that most of the clam production (79.1%) in the study area was
sold via a wholesale market for processing and consumption. This figure is not much
different from the data given in the Baseline report (82.6%). There was no notable difference
in terms of the wholesale selling method between tidal and pond culture households (82.3%
compare to 74.6%, respectively). The proportion of clams sold by retailers for both tidal and
pond culture was low, and accounted for 6.7% and 10.1%, respectively. Farmers who
indicated that they sold clams by both methods wholesale and retail is about 12% and ranged
from 11% to 15.3% of tidal and pond culture farmers, respectively. On average, the clams
used for family consumption was 113.3 kg per household per year and ranged between 40
and 180 kg. Tidal clam households used more clams for consumption than pond families
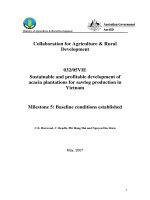
(121.8 compare to 97.4 kg per farm). The clam marketing channels in the study area is
presented in Figure 3.
Table 13: Clam selling type and clams for family consumption
Indicator Tidal culture Pond culture Total
Whole sale 82.3 74.6 79.1
Retail 6.7 10.1 8.8
Clam selling
type (%)
Both 11.0 15.3 12.1
Mean 121.8 97.4 113.3
Min 60.0 40.0 40.0
Family
consumption
(kg/hh/year)
Max 180.0 120.0 180.0
Aquaculture Research Sub Institute for North Central Vietnam South Australia Research and Development Institute
Milestone Report Project Validation
17
Figure 3: Clam marketing channel in the study area
3.2.2. Clam culture economic indicator
3.2.2.1. Pond/tidal area preparation cost
Table 14 presents the area preparation cost, fencing or watch tower costs, casting or stocking
costs, watch or guard costs and land tax costs of clam households in the study region. In
general cost of clam area preparation before stocking was about 2.5 million VND per ha,
ranging widely from around 0.6 to 3.5 million VND per ha. This cost represented 3.3% of the
total costs. Cost of land area repair of tidal culture and pond culture groups was 2.9% and
5.1% or 2.3 and 2.9 million VND per ha, respectively.
Average costs of fencing and watch towers was one million VND per ha equivalent to 1.3%
of the total cost, and ranged between 1% in the pond culture group and 1.6% in tidal culture
farmers. In regards to casting and stocking, the average cost was appropriately 5.8 million
VND per ha or equivalent to 7.6% of the total cost, this ranged widely from 1.5 to 8.5 million
VND per ha. There was no significant difference in term of percentage of casting and
stocking costs of tidal culture and pond culture clam households (7.8% and 7.4% of total cost
respectively).
Watch and guard of the clam area are important activities. The cost of this activity was about
5.8 million VND, on average (or equivalent 7.7% of total cost) and ranged from 0.8 to 11.5
million VND per ha. There was a remarkable difference of watch and guard costs of tidal and
Wholesaler (80%)
Clam Farmer
(Tidal and pond)
Vendor (5%) Retailer (10%)
Consumer
5%
Aquaculture Research Sub Institute for North Central Vietnam South Australia Research and Development Institute
Milestone Report Project Validation
18
pond clam culture groups. The costs of tidal and pond culture farmers were around 8.6 and
2.3 million VND per ha or equivalent 10.5% and 4.1% of total cost respectively.
As can be seen in Table 14, average land taxes and fees for land rent were 2.9 million VND
per ha, and ranged from 1.2 to 7 million VND per ha and accounted for 3.7% of the total
cost. Land taxes or fees of tidal and pond culture farms were not much different in term of
percentage (3.9% and 3.3%, respectively), but in the case of monetary value, they were
significantly different (3.2 compare to 1.8 million VND per ha respectively)
Table 14: Cost for area repair, fencing and watch tower, casting/stocking, watch/guard
from pouching, and land tax/fee
Indicator Tidal culture Pond culture Total
Mean 2,365.9
(2.9)
2,893.8
(5.1)
2,506.4
(3.3)
Min 653.3 925.5 653.3
Area repair cost
(.000’ VND/ha)
Max 3,510,4 3,282.1 3,510,4
Mean 1,346.6
(1.6)
549.0
(1.0)
1,003.5
(1.3)
Min 500.0 0.0 0.0
Fencing, watch
tower cost
(.000’ VND/ha)
Max 2,800.0 1,216.7 2,800.0
Mean 6,148.9
(7.8)
4,215.1
(7.4)
5,782.9
(7.6)
Min 2,518.0 1,546.5 1,546.5
Casting/stocking
cost
(.000’ VND/ha)
Max 8,517.5 5,584.0 8,517.5
Mean 8,670.5
(10.5)
2,312.1
(4.1)
5,813.2
(7.7)
Min 6,358.0 832.5 832.5
Watch and
guard from
pouching
(.000’ VND/ha)
Max 11,549.8 2,826.3 11,549.8
Mean 3,267.7
(3.9)
1,854.5
(3.3)
2,958.4
(3.7)
Min 1,200.0 1,500.0 1,200.0
Land tax/fee
(.000’ VND/ha)
Max 7,000.0 5,400.0 7,000.0
Notice:
numbers within bracket ( ) show % based on total cost
3.2.2.2. Seed, fertilizer and lime cost
Table 15 shows the costs of seed, fertilizers and lime associated with the culture of clams in
the project provinces. It is clear that a major expenditure in clam culture is the seed
purchasing. The mean value of clam seed cost of both tidal and pond culture farmers in the
study region was nearly 45.5 million VND per ha, and varied from 15.1 to 74.2 million VND
per ha, this accounted for 63.1% of the total cost. Famers in the tidal culture group invested
Aquaculture Research Sub Institute for North Central Vietnam South Australia Research and Development Institute
Milestone Report Project Validation
19
more money in the purchase of seed/ha compared to pond culture farmers (51.5 compare to
37.5 million VND per ha respectively). Contrary, in case of the proportion, seed cost
percentage of clam pond culture group was higher than that of tidal households (66.6% and
62.3%, respectively).
As can be seen in Table 15, clam tidal farmers did not use fertilizers, lime or dolomite;
therefore the costs of these materials were zero. However, clam pond culture households
spent about 2.2 million VND per ha for fertilizers (or 3.8% of total cost, equivalent) and 2.1
million VND per ha for lime/dolomite (or 3.5% of total cost, equivalent). This can be
explained as clam pond culture needs these materials to maintain the algal production for
clam feed in the ponds.
Table 15: Seed, fertilizer and lime costs of clam culture in the project provinces
Indicator Tidal culture Pond culture Total
Mean 51,489.1
(62.3)
37,545.6
(66.6)
45,558.7
(63.1)
Min 26,448.5 15,115.5 15,115.5
Seed cost
(.000’
VND/ha)
Max 74,281.0 62,050.6 74,281.0
Mean 0.0
(0.0)
2,164.0
(3.8)
1,461.7
(1.9)
Min 0.0 210.0 0.0
Fertilizer cost
(.000’
VND/ha)
Max 0.0 4,517.3 4,517.3
Mean 0.0
(0.0)
2,014.5
(3.5)
1,402.4
(1.8)
Min 0.0 510.0 0.0
Lime and
dolomite cost
(.000’ VND/ha)
Max 0.0 4,206.0 4,206.0
Notice:
numbers in bracket ( ) show % compare to total cost
3.2.2.3. Hire labor and harvesting costs
Labor hire and clam harvesting costs are presented in the Table 16. In general, clam farmers
in the project area spent around 3.1 million VND per ha to hire labor for doing clam culture
(constituted 4.1% of total cost). The range of minimum and maximum values of hiring labor
varied from 0.6 to 6.4 million VND per ha. Labor hiring costs of the tidal group was nearly
double compared to the pond clam culture group (4.3 compare to 2.2 million VND per ha,
respectively).
Cost of clam harvesting was the second largest total cost and accounted for 7.8% of the total
cost, with a monitory value of 5.6 million VND per ha this ranged from 1.6 to 11.5 million
VND per ha. Harvesting cost for tidal farmers was significantly higher than that of pond
culture households (7.1 and 3.4 million VND per ha, respectively).
Aquaculture Research Sub Institute for North Central Vietnam South Australia Research and Development Institute
Milestone Report Project Validation
20
Table 16: Labor hire and harvesting costs
Indicator Tidal culture Pond culture Total
Mean 4,365.2
(5.3)
2,214.6
(3.9)
3,112.0
(4.1)
Min 1,270.0 626.8 626.8
Hire labor cost
(.000’
VND/ha)
Max 6,468.5 3,550.5 6,468.5
Mean 7,153.6
(8.6)
3,427.7
(6.1)
5,629.7
(7.8)
Min 4,518.2 1,635.6 1,635.6
Harvesting
cost (.000’
VND/ha)
Max 11,505.8 5,728.4 11,505.8
Notice:
numbers in bracket ( ) show % compare to total cost
Area repair cost
2.9%
Havesting cost
8.6%
Fencing, watch
tower cost
1.6%
Casting/stocking
cost
7.8%
Watch and
guard from
pouching
10.5%
Land tax/fee
3.9%
Seed cost
62.3%
Hire labor cost
5.3%
Figure 4: Diagram indicating rate of input contribution of tidal clam culture
Area repair cost
5.1%
Fencing, w atch
tow er cost
1.0%
Casting/stocking
cost
7.4%
Watch and guard
from pouching
4.1%
Land tax/fee
3.3%
Havesting cost
6.1%
Hire labor cost
3.9%
Fertilizer cost
3.8%
Lime and dolomite
cost
3.5%
Seed cost
66.6%
Figure 5: Diagram indicating rate of input contribution of pond clam culture
Aquaculture Research Sub Institute for North Central Vietnam South Australia Research and Development Institute
Milestone Report Project Validation
21
3.2.2.4. Total cost, total income, benefit-cost ratio
Table 17 indicates the total costs, total income, benefit and benefit-cost ratio (BCR) for clam
culture in the six study provinces. Regarding the average total cost for clam culture required
an investment of about 75.2 million VND per ha and ranged from 28.2 to 109.5 million VND
per ha. As can be seen in Table 17, total cost of tidal clam culture was noticeably higher than
that of clam culture in the pond system (82.6 compare to 56.3 million VND per ha). In this
study, family labor was not included as it was very difficult to precisely estimate the cost due
to poor labor recording by clam farmers. The total production cost of clams in this study is
higher than that of the Baseline survey (66.9 million VND per ha). This may be due to a
number of factors including more investment of clam households and/or the increase price of
input materials, in particular clam seed which accounted for the highest proportion of the
production cost.
In general, the total average income of clam culture households of both tidal and pond culture
farming was about 129.6 million VND per ha, with a minimum of 32.2 million VND per ha.
and a maximum of 189 million VND per ha The difference in income levels in tidal and
pond culture groups was significant. The tidal culture farmers had an income about 1.5 times
higher than that of pond culture farmers. The average tidal and pond culture income is 148.4
and 90.7 million VND/ha respectively. Calculated data in the Baseline study showed that the
total income of clam households was 121.6 million VND per ha for tidal farming. Therefore,
at the time of the Baseline survey, the total income of tidal clam farmers was lower than that
of present farmers in this study. This increase in income could be attributed to the increased
knowledge in the farming practice. The current CARD project played an important and
essential role in increasing tidal clam productivity and introduced new calm culture
techniques in ponds. The pond culture practice at the initial stage started after the
implementation of this project. The income levels from pond cultures will further increase as
farmers gain more experience in this practice. In general, the income of clam farmers in this
study was higher than that of the Baseline survey. The income levels for tidal clam farmers
increased from 121.6 to 148.4 million VND per ha.
Based on the data from both tidal and pond culture farmers indicated that the average benefit
value was 51.0 million VND and ranged widely from 16.5 to 97.1 million VND per ha.
Benefit for the clam tidal culture group was nearly two times higher than that of pond culture
groups (65.8 compare to 34.4 million VND per ha respectively). Comparison with the
Baseline survey result, the benefit of clam culture for tidal farmers in this research was higher
than the benefit reported in the Baseline report. This project greatly assisted in improving the
income levels of the clam farmers.
Benefit cost ratio (BCR) is a very important indicator to assess the economic effect of clam
aquaculture. BCR is measured by the ratio between total income and total cost. Table 17
shows the BCR of different clam household groups (tidal culture and pond culture and both).
Aquaculture Research Sub Institute for North Central Vietnam South Australia Research and Development Institute
Milestone Report Project Validation
22
In general, average value of BCR of both farming types in all provinces was 1.72, this means
that if clam farms invest 1 VND it has an income 1.72 VND or benefit 0.72 VND.
Comparison among groups, the BCR of tidal farmers was higher than that of pond farmers
(1.79 and 1.61, respectively). There was a significant difference in minimum and maximum
BCR values, ranging from 1.3 to 2.15.
Table 17: Cost, income, benefit and benefit-cost ratio of clam farms
Indicator Tidal culture Pond culture Total
(average)
Mean 82,637.6 56,342.9 75,228.9
Min 43,278.0 28,230.8 28,230.8
Total cost
(.000’
VND/ha)
Max 109,567.5 73,248.0 109,567.5
Mean 148,438.8 90,750.9 129,668.9
Min 83,291.6 32,201.7 32,201.7
Total income
(.000’
VND/ha)
Max 189,003.1 123,210.5 189,003.1
Mean 65,801.2 34,408.0 51,012.4
Min 36,412.0 16,549.0 16,549.0
Benefit (.000’
VND/ha)
Max 97,130.3 61,017.8 97,130.3
Mean 1.79 1.61 1.72
Min 1.38 1.30 1.30
Benefit cost
ratio (BCR)
Max 2.15 1.92 2.15
3.2.2.5. Capital sources and interest rate
The capital sources, quantity of borrowed capital and interest rate are given in Table 18.
About 68.5% of interviewed farmers indicated that the capital was borrowed from both on-
farm and off-farm sources. The proportion of farmers answered that the capital borrowed
from on-farm or off-farm sources was similar (15.9% and 15.6% respectively of total
interviewed farmers). Sources of capital associated with tidal and pond culture groups were
also similar for all types (on-farm, off-farm and both).
Table 18: Capital sources, amount of borrowed capital and interest rate.
Indicator Tidal culture Pond culture Total
(average)
On-farm 12.8 18.4 15.9
Borrowed 16.9 14.2 15.6
Source of
capital (%)
Both 70.3 67.4 68.5
Mean 21,680.0 15,254.8 18,965.6
Min 5,000.0 3,000.0 3,000.0
Amount of
borrowed
capital
(000’VND/hh)
Max 60,000.0 25,000.0 60,000.0
Mean 0.8 0.7 0.8
Min 0.5 0.5 0.5
Interest rate
(%/month)
Max 1.2 1.0 1.2
Aquaculture Research Sub Institute for North Central Vietnam South Australia Research and Development Institute
Milestone Report Project Validation
23
As can be seen in Table 18, the amount of borrowed capital for clam farmers in the project
area was nearly 19 million VND per household, and on average, ranged from 3 to 60 million
VND. Tidal clam culture farmers borrowed larger capital amounts compared to pond clam
culture farmers (21.6 compare to 15.2 million VND per farm respectively). The average
interest rate was 0.8 percent per month. This interest rate ranged between 0.5 and 1.2% per
month. There was no significant difference in the interest rate between tidal and pond culture
farmers groups.
3.2.2.6. Household income sources
Table 19 shows the results of different income sources for households in the study areas. The
general average of total household income was around 180.5 million VND per household.
The highest income for households was in tidal clam group (about 248.5 million VND per
household). Pond clam culture households had a total income of approximately 91.6 million
VND per farm.
Table 19: Household income sources of farmers in the study area
Indicator Tidal culture Pond culture Total
Value (000’ VND) 215,236.3 51,653.6 142,542.7
Clam culture
Percentage (*) 87.6 56.4 78.9
Value (000’ VND) 26,142.5 21,806.7 24,172.6
Other
aquaculture
Percentage (*) 10.5 23.8 13.4
Value (000’ VND) 0.0 2,478.8 2,694.5
Rice culture
Percentage (*) 0.0 3.5 1.6
Value (000’ VND) 0.0 1,124.1 457.8
Horticulture
Percentage (*) 0.0 1.2 0.3
Value (000’ VND) 0.0 2,581.0 1,204.1
Livestock
Percentage (*) 0.0 2.8 0.7
Value (000’ VND) 2,147.2 2,562.4 2,253.5
Fish capture
Percentage (*) 0.9 2.7 1.3
Value (000’ VND) 916.4 1,790.7 1,314.3
Fish
processing
Percentage (*) 0.4 1.9 0.7
Value (000’ VND) 0.0 1,205.6 501.3
Labor
Percentage (*) 0.0 1.3 0.4
Value (000’ VND) 803.8 1,254.1 1,064.6
Salaries
Percentage (*) 0.0 1.3 0.6
Value (000’ VND) 2,216.2 3,108.4 2,694.5
Trading
Percentage (*) 0.9 3.3 1.4
Value (000’ VND) 1,035.4 2,015.6 1,617.9
Other
Percentage (*) 0.4 2.2 0.9
Value (000’ VND) 248,497.8 91,581.0 180,517.8
Total income
Percentage (*) 100.0 100.0 100.0
Aquaculture Research Sub Institute for North Central Vietnam South Australia Research and Development Institute
Milestone Report Project Validation
24
Notice (*): % based on the total income of household
Clam aquaculture was the main occupation for providing the highest share of household
income which contributes 78.9% of the total household income. This income varied between
56.4% and 87.6%. Income from other aquaculture activities was second place and
contributed about 13.4%. Other income sources were from rice culture, horticulture,
livestock, fisheries capture, processing, labor, salaries, and trading were very low compared
to total income (accounted less than 2%)
Some other activities refereed to here were applicable in the pond culture group but did not
apply in the tidal culture group. For example, rice culture, horticulture, livestock and labor
were found only in pond clam aquaculture group.
3.3. Factors influencing and being influenced by clam culture
This sub-section analyses the factors influencing and being influenced by clam culture within
the two groups (tidal and pond) of clam aquaculture farmers. The data presented in tables 20
to 26 are the percentages of respondents consisting of 120 in the tidal group (group or farmer
households) and 80 in the pond group. The range of influence is ranked from1 to 3, number 1
being high and 3 being the lowest.
3.3.1 Social impact of clam culture development
Results of the social impact from the clam aquaculture development project are presented in
Table 20, it consists of five positive and four negative impacts. The most important positive
impact of tidal clam aquaculture development was increased income for households (100% of
respondent), followed by increased employment, and associated development of local
infrastructure. While the most important impact for pond culture farmers was the increases in
employment (81% of respondent), followed by increased income for local farmers and the
associated development of infrastructure indicators.
Table 20: The social impact of clam aquaculture development (%)
Ranking
Tidal culture Pond culture
Impact
1 2 3 1 2 3
Increases employment
92 4 4 81 12 7
Increases income for local farmers
100 0 0 72 18 10
Associated with development of infrastructure
84 12 4 68 23 9
Associated with development of other activities
71 12 17 55 38 7
Positive
Other
26 39 35 33 17 50
Limits development of other production
16 32 52 27 41 32
N
eg
ativ
e
Increases in social and land use conflicts
31 23 46 24 37 39
Aquaculture Research Sub Institute for North Central Vietnam South Australia Research and Development Institute
Milestone Report Project Validation
25
Reduces local traditional jobs
12 25 63 12 24 64
Other
0 26 74 8 36 56
Otherwise, the most negative of the tidal clam culture development project was the increase
in social and land use conflicts (31% of respondent). This limited development of other crop
production and reduces local traditional jobs were also a negative impact of this group.
However, pond clam farmers indicated that the most negative was the limitation of
development in other crop production (27% of respondent), followed by increases in social
and land use conflicts and the reduction in local traditional jobs.
3.3.2 Influence of clam culture development on other production activities
The influence of clam aquaculture development on other production activities is given in
Table 21. The most positive and important impact of clam culture development on other
activities (both tidal and pond farmer groups) were to provide cash as capital for other
activities (84% and 78% of respondent, respectively). The most negative impact of tidal and
pond culture was reduction in time and labors for other activities (80% and 68% of
respondent, respectively). The reduction in time could be attributed to the increased
employment opportunity in pond culture.
Table 21: Influence of clam aquaculture development on other production activities (%)
Ranking
Tidal culture Pond culture
Impact
1 2 3 1 2 3
Uses product from other activities
0 16 84 12 19 69
Uses by-product from other activities
18 27 65 22 31 47
Provides cash as capital for other activities
84 12 4 78 11 11
Positive
Other
16 40 44 31 48 21
Reduces production area of other activities
12 27 61 18 25 57
Reduces water supply
18 26 66 42 31 27
Competes with other activities in feed/fertilizer use
20 37 43 61 29 10
Reduces time/labor for other activities
82 11 7 68 16 16
Negative
Other
33 21 46 41 24 35
3.3.3 Influence of other activities on clam culture production
Table 22 indicates the result and impact from other activities on clam aquaculture of tidal and
pond households. The important influence was to use earned cash to clam culture for the
investment in other activities (86% and 79% of interviewed farmers). The most negative
impact was the reduction in production area of clam aquaculture of tidal and pond clam
households (18% and 35% of respondent, respectively).