Estimation of Proper Strain Rate in the CRSC Test Using a Artificial Neural Networks
Bạn đang xem bản rút gọn của tài liệu. Xem và tải ngay bản đầy đủ của tài liệu tại đây (886.98 KB, 5 trang )
Estimation of Proper Strain Rate in the CRSC Test
Using a Artificial Neural Networks
Jum Sik Chae, Hyung Kyu Park, and Song Lee
University of Seoul
Seoul, Korea
ABSTRACT
The Constant rate of strain consolidation (CRSC) test, in which the
continuous loading is applied the sample has been developed to
overcome some of the problems associated with the incremental
loading consolidation (ILC) test. Therefore, it is able to reduce the test
time and provide a well defined the curve of effective stress versus
strain due to continuous Stress-strain points. Also, the CRSC test has
been accepted widely as a standard method in foreign countries because
of its many advantages. However, in Korea the CRSC test has not been
used in engineering practice and experimentally verified. Because there
is not a precise criterion of strain rate despite consolidation
characteristics are influenced on strain rate. Consequently, it is difficult
to apply in engineering practice.
In this study, artificial neural networks are applied to the estimation of
the proper strain rate of the CRSC test.
This study shows the possibility of utilizing the artificial neural
networks model for estimation of the strain rate in the CRSC test.
KEY WORDS: Constant rate of strain consolidation (CRSC);
incremental loading consolidation (ILC); preconsolidation
pressure; strain rate; artificial neural networks (ANN).
INTRODUCTION
Recently, a number of construction projects for obtaining industrial
areas have been increased in many coastal areas or soft ground though
these areas have a weak condition. The structure constructed on soft
ground are seriously damaged due to soft ground with a high water
content, low stress, and large strain undergoing large settlement.
Accordingly, the properties of consolidation must be precisely
perceived to solve these problems.
The ILC test has been used widely until now as most common method
for predicting the consolidation properties in softy clay. However, the
period of testing is required the time more than a week to finish the ILT
test. Also, It is difficult to determine the preconsolidation pressure due
to the curve of stress and strain is not appeared is to definitely.
Several types of continuous consolidation test have been introduced in
recent years to overcome some of the problems associated with the ILT
test. Among the continuous tests, the CRSC test has been accepted
widely as a standard method in foreign countries because of its many
advantages.
The CRSC test was first described by Hamilton and Crawford(1959) as
a rapid means of determining the preconsolidation pressure. In the
CRSC test, the imposed boundary conditions are similar to those in the
ILC test, but with one-way drainage. The specimen is loaded at a
constant rate of strain instead of incrementally. Therefore, new
interpretation methods were required for data obtained by the CRSC
test. The analysis method proposed by Wissa et al. (1971) has been
widely used in most countries. Their method is based on the
consolidation theory in which strain is assumed small and the
coefficient of consolidation is assumed constant in the vertical direction
at a time. They proposed some options for the analysis method by
assuming or not steadiness of the solution.
To perform the CRSC test, appropriate strain rate for the material tested
must be pre-selected. Because consolidation properties that calculated
using the CRSC test are influenced on strain rate. The methods that
generally recommended to select the strain rate in the CRSC test are
ASTM D 4186-82, Armour & Drnevich(1986) etc al.
However, the ASTM recommendation is not reasonable for soils with
high liquid limit. And Armour & Drnevich’s method is difficult to
apply because strain rate would depend on selection of the three
assumed values.
The purpose of this study is to examine the applicability of the ANN
model for the estimation of the proper strain rate.
This study was performed with strain rate that determined by various
estimate methods. Also, These results are compared to data calculated
using the CRSC test as well as the ILC test results on the same soil.
METHOD OF ANALYSIS
In this study, the nonlinear theory of Wissa et al. (1971) was used the
interpret the results of CRSC tests. Wissa et al. formulated a nonlinear
theory based on assuming a constant coefficient of consolidation
leading to a generalized, nonlinear equation for strain distribution
through the specimen. By assuming a constant ratio between
incremental ε and increments of log σ
v
, nonlinear theory equations
were developed to compute consolidation properties for steady state an
630
Proceedings of The Twelfth (2002) International Offshore and Polar Engineering Conference
Kitakyushu, Japan, May 26
–
31, 2002
Copyright © 2002 by The International Society of Offshore and Polar Engineers
ISBN 1-880653-58-3 (Set); ISSN 1098-6189 (Set)
transient conditions. If no transient conditions exist, average effective
stress and coefficient of consolidation are calculated as follows.
3/1223
)2(
bvbvvave
uu ∆+∆−=
σσσσ
(1)
−∆
−=
v
b
v
v
V
u
t
H
C
σ
σ
σ
1log2
log
1
2
2
(2)
where
H = current specimen height
21
,
vv
σσ
= total stresses at two times of difference
t∆
b
u
= excess pore pressure measured at the base of the specimen.
However, it is found that transient conditions that typically occur at the
start of loading and throughout higher strain rate tests in which large
excess pore pressures are generated. Also, assumption of a constant
coefficient of consolidation is reasonable in the normally consolidated
stress range, it is almost not valid in the overconsolidated stress range.
SELECTION OF STRAIN RATE
The CRSC tests are generally performed at much higher strain rates
than those typically encountered in the field. These strain rates
determine the pore pressures that will be generated in the testing and
thus the applicability of the theory. If a specimen is strained at too slow
a rate, little or no pore pressure will be generated and, the effect on the
determination of Coefficient of consolidation will be pronounced. On
the other hand, if pore pressures become excessive, assumptions made
in deriving the theory will again be rendered invalid because the pore
pressure distribution will not be parabolic.
In this study, the strain rates are determined from the ASTM
recommendation and Armour & Drnevich’s method. The ASTM
recommendation is relies on empirical correlation between the liquid
limit of the soil and assumed parameters. Also, Armour and
Drnevich(1986) proposed an empirical equation for calculating the
strain rate, as below
−
−
=
max
1log
)38exp(
v
b
ow
oa
u
H
kPLI
r
σγ
(3)
in which LI is the liquidity index with soil saturated,
a
P
is the
atmospheric pressure,
o
k
is the permeability at start of test, and
o
H
is
the initial thickness of specimen. In this study, the permeability of the
specimen is estimated using empirical equations. And the maximum
pore pressure ratio is used 30% that set by ASTM D4186.
DESIGN ARTIFICIAL NEURAL NETWORK MODEL
Neural networks are computer models that mimic the knowledge
acquisition and organization skills of the human brain. Since, the
characteristics of a neural network come from the activation
function
and connection weights, it is possible to realize complex
mapping
through its characteristics of distributed representations
.
ANN models
are efficient computing techniques that are widely used to solve
complex problems in many fields. In this study, a back-propagation
neural network model for estimating of proper strain rate form soil
parameter is proposed. The back-propagation neural network program
adopted in the present study essentially followed the formulations of
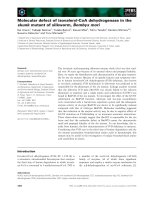
Eberhart(1990) as shown in Fig.1. The implementation of the back-
propagation neural network model for predicting proper strain rate
involved three phases
First, data collection phase involved gathering the data for use in
training and testing the neural network. A large training data reduces
the risk of under-sampling the nonlinear function, but increases the
training time. To improve training, preprocessing of the data to values
between 0 and 1 was carried out before presenting the patterns to the
neural network. The following normalization procedure (Master, 1993)
was used in this study.
minmax
min
VV
VV
A
−
−
=
(4)
Training was performed iteratively until the average of sum squared
error over all the training patterns was minimized. Experiment were
carried out using a number of combinations of input parameters to
determine the neural network model that gave the smallest average of
the sum square error. There is currently no rule for determining the
optimal number of neurons in the hidden layer other than by
experiment. In this study, the structure of neural network with one input
layer – two hidden layer – one output layer is used. ANN model was
designed to build and operate a database for the physical properties of
the soil and results of consolidation test, to learn the database, and to
predict the properties of consolidation.
Fig. 1 Flow chart for programming of the artificial neural network
VERIFICATIONS OF MANN MODEL
In order to verify the applicability of MANN model, a total of 46 data
of the consolidation test results are used. 43 learning data are used for
training the ANN model, and the others are used for the comparison
Data Collection
Data Normalization
Parametric Studies
Training and Testing ANN
Verify the reliance of the ANN
631
between the predicted value and the measured value.
The properties of the soil used for training of the MANN models are
shown in Table 1.
Table 1. Properties of the soil used for learning of the MANN models
Class
Range of values
Water content (%)
33.9 ~ 142.8
Liquid limit (%)
38.0 ~ 120.2
Plasticity index
16.6 ~ 74.2
Liquid index
0.47 ~ 1.81
Specific gravity 2.42 ~ 2.70
Initial void ratio 0.924 ~ 3.499
Dry unit eight
)/(
3
cmg
0.542 ~ 1.367
60% particle size subject to a grain size
distribution curve (mm)
0.0046 ~ 0.075
Passing the # 200 (%) 60.0 ~ 99.8
Clay fraction < 2µ
0 ~ 45.0
Present effective vertical pressure (
2
/ cmkg
)
0.04 ~3.86
Strain rates (%/min) 0.01 ~ 0.5
The number of neuron for each hidden layer is determined as 7 from
the results of consolidation test and the learning ratio is determined as
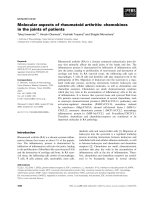
0.1 to optimize network learning. In this analysis, system error was
limited to 2.0E-5 after about 30,000 cycles of training as shown in Fig.
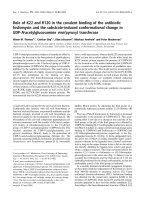
2. With the learning results, the most important factors on the
preconsolidation pressure ratio are LI and strain rate as shown in Fig. 3.
0 10000 20000 30000
Iteration Number (N)
1E-005
0.0001
0.001
0.01
0.1
Learning Error (Er)
Fig. 2 Variation of the learning error with Iteration Number
Factor
0
4
8
12
16
Relative Importance (%)
Wn
LL PI
LI Gs
e
o
r
d
D60 #200
2
µ
Po
r
Fig. 3 Relative importance of the input parameter on the pre-
consolidation pressure ratio
In order to verify the reliance of the ANN model, the measure value,
which have not been included in database, are also inferred to compare
with the predicted value.
Properties of the soil used for verification of the
ANN models are summarized in Table 2.
Table 2.
Properties of the soil used for verification of the MANN models
Class
A B C
Wn (%)
110.2
74.0 42.9
LL (%)
79.0 80.9 44.4
PI
47.4 44.8 22.9
LI
1.66 0.85 0.93
Gs 2.58 2.66 2.70
o
e
2.861 1.938 1.161
d
γ
)/(
3
cmg
0.668 0.891 1.249
60
D
(mm)
0.035 0.03 0.0115
Passing the # 200 (%) 89.0 82.9 99.1
Clay fraction < 2µ (%)
26.0 32.0 16.0
0
p
(
2
/ cmkg
)
0.28 1.46 0.19
Strain rates (%/min) 0.02 0.04 0.05
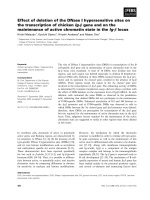
Fig. 4 shows the results of the preconsolidation pressure
ratio
( )
)()( ILCCCRSC
PP
and compression index ratio
( )
)()( ILCCCRSC
CC
. The
abscissa presents the measured values from the consolidation tests, the
ordinate shows the predict values using the ANN model. The results
show the high correlation between the measured value and predicted
value. This result implies that the ANN model can predict the
consolidation properties with high degree of confidence.
632
0 0.4 0.8 1.2 1.6 2
Measured Value
0
0.4
0.8
1.2
1.6
2
Predicted value
Preconsolidation Stress Ratio
Compression Index Ratio
Fig. 4 Comparison between the predicted and measured values
TEST PROGRAM
To investigate the applicability of MANN model, consolidation tests
were performed on undisturbed samples obtained in-situ by using both
ILC test equipment and CRSC test equipment. The CRSC test was
performed with strain rates that determined by various estimate
methods. The soil samples used in this study were obtained from
marine clayey soil deposit at the offshore area of Ha-dong in Korea.
The physical properties of this clay are presented in Table 3.
Table 3. Properties of the soil and strain rate used for the test
Class
D Range of value
Wn (%)
68.7 59.3 ~ 77.4
LL (%)
72.8 52.0 ~ 79.0
PI
47.1 28.3 ~ 47.1
LI
0.91 0.83 ~ 1.69
Gs 2.70 2.69 ~ 2.70
o
e
1.774 1.522 ~ 2.029
d
γ
)/(
3
cmg
0.970 0.891 ~ 1.067
60
D
(mm)
0.011 0.011 ~ 0.023
Passing the # 200 (%) 99.1 97.8 ~ 99.8
Clay fraction < 2µ (%)
29.7 10.5 ~ 38.0
0
p
(
2
/ cmkg
)
1.24 0.64 ~ 1.42
ASTM 0.004 0.004 ~ 0.010
Armour & Drnevich 0.086 0.008 ~ 0.086
Strain rates
(%/min)
MANN model 0.008 0.008 ~ 0.046
All tests were performed on specimens, 2 cm high with a diameter 6 cm,
taken with 76mm diameter piston sampler. ILC test were loaded in
steps using a load increment ratio of 1.0 which was maintained for 24
hours. The CRSC tests were carried out after confirming full saturation
using B value, and were performed with the strain rate selected as
illustrated in Table 3.
TEST RESULTS AND DISCUSSIONS
In Fig. 5 a comparison is made between the measured values from the
test and the predicted values using ANN model for the sample D.
There appeared to be an almost nonlinear relationship between
preconsolidation pressure ratio and strain rate, where the results show a
similar tendency. With the result, the preconsolidation pressure ratio
increases as the increase of strain rate and their trends are similar to
those of the previous research. In the case of sample D, the predicted
values of ANN model are slightly different from the field data. In
particular, these differences are increase at the high strain rate range.
The reason is that ANN model has not a lot of database on the high
strain rate. To eliminate this effect should be collected database.
0 0.04 0.08 0.12
Strain Rate (%/min)
0.4
0.6
0.8
1
1.2
1.4
1.6
1.8
2
Preconsolidation Pressure Ratio
Predicted Value
Measured Value
PR = 34.36 * r
2
+ 1.87 * r + 1.00
R
2
= 0.98
Fig. 5 Comparison between the predicted and measured values
for preconsolidation pressure ratio with strain rate
Fig. 6 shows the preconsolidation pressure ratio obtained from the
consolidation test performed with various strain rates. These strain rates
are determined by various estimate methods. As can be recognized
form Fig. 6, the ranges of strain rates obtained from ANN model were
between those from ASTM recommendation and those from Armour &
Drnevich’s method. Also, the preconsolidation pressures measured
from the CRSC test with strain rate determined by ANN Model were
close to those from the ILC test. This implies that the predicted strain
rates of ANN model are reasonable.
According to these results, ANN model can predict the proper strain
rate of the CRSC test with high reliability.
633
0.02 0.04 0.06 0.08 0.1
Strain Rate(%/min)
0.4
0.6
0.8
1
1.2
1.4
1.6
1.8
2
Preconsolidation Pressure Ratio
ASTM
Armour
ANN Model
Fig. 6 Preconsolidation pressure ratio with strain rate that
determined by various estimation methods
CONCLUSIONS
A rational approach has been developed to estimate the strain rate for
use in the CRSC test. The following conclusions have been derived
from this research
The main factors on the preconsolidation pressure ratio are liquid index
and strain rate from various parametric studies
The ranges of strain rates obtained from ANN model were between
those from ASTM recommendation and those from Armour &
Drnevich’s method.
In general, the preconsolidation pressures ratio measured from the
experiment was closed to that predicted from the ANN Model. This
implies that the predicted strain rates of ANN model are more
reasonable than those of other methods.
These limited results show the possibility of utilizing the Artificial
neural network model for prediction of the proper strain rate of the
CRSC test..
REFERENCES
Armour, DW, and Drnevich, VP (1986). "Improved Techniques for the
Constant Rate of Strain Consolidation Test," Consolidation of soils :
Testing and Evaluation. ASTM STP 892, Philadelphia, pp 170-183.
Bailey, D, and Thompson, D (1990). "How to develop neural network
application," AI Expert, 5(6), pp 38-47.
Crawford, CB (1988). "Importance of Rate of Strain in the Consolidation
Test," Geotechnical Testing Journal, Vol 11, No 1, pp 60-62.
Ellis, GW (1992). "Neural network modeling of the mechanical behavior
of sand," Proc. 9
th
Conf. ASCE, New York, pp 421-424.
Garson, GD (1991). "Interpreting neural-network connection weights," AI
Expert, 6(7), pp 47-51.
Gorman, CT, Hopkins, TC, Deen, RC, and Drnevich, VP (1978).
"Constant Rate of Strain and Comtrolled Gradient Consolidation
Testing," Geotechnical Testing Journal, Vol 1, No 1, pp 3-15.
Hamilton, JJ, and Crawford, CB (1959). "Improved Determination of
Preconsolidation Pressure of a Sensitive Clay," ASTM STP 254,
Philadelphia, pp 254-271.
Jingsheng, SJ, Ortigao, AR, and Junli, B (1998). "Modular Neural
Networks for Predicting Settlement during Tunneling," J. Geotech.
ASCE, Vol 124, No 5, pp 389-395.
Smith, RE, and Wahls, HE (1969). "Consolidation Under Constant Rates
of Strain," Journal of the Soil Mechanics and Foundations Division,
ASCE, Vol 95, No SM2, pp 519-539.
Wissa, AE, Christian, JT, Davis, EH, and Heilberg, S (1971).
"Consolidation at Constant Rate of Strain," Journal of the Soil
Mechanics and Foundations Division, ASCE, Vol 97, No SM10, pp
1393-1413.
634