Warnock et al. EJNMMI Research 2011, 1:13 http://www.ejnmmires.com/content/1/1/13 ORIGINAL potx
Bạn đang xem bản rút gọn của tài liệu. Xem và tải ngay bản đầy đủ của tài liệu tại đây (400.49 KB, 11 trang )
ORIGINAL RESEARCH Open Access
Use of a beta microprobe system to measure
arterial input function in PET via an arteriovenous
shunt in rats
Geoff Warnock
1*
, Mohamed-Ali Bahri
1
, David Goblet
1
, Fabrice Giacomelli
1
, Christian Lemaire
1
, Joel Aerts
1
,
Alain Seret
3
, Xavier Langlois
2
, Andre Luxen
1
and Alain Plenevaux
1
Abstract
Background: Kinetic modeling of physiological function using imaging techniques requires the accurate
measurement of the time-activity curve of the tracer in plasma, known as the arterial input function (IF). The
measurement of IF can be achieved through manual blood sampling, the use of small counting systems such as
beta microprobes, or by derivation from PET images. Previous studies using beta microprobe systems to
continuously measure IF have suffered from high background counts.
Methods: In the present study, a light-insensitive beta microprobe with a temporal resolution of up to 1 s was
used in combination with a pump-driven femoral arteriovenous shunt to measure IF in rats. The shunt apparatus
was designed such that the placement of the beta microprobe was highly reproducible. The probe-derived IF was
compared to that obtained from manual sampling at 5-s intervals and IF derived from a left ventricle VOI in a
dynamic PET image of the heart.
Results: Probe-derived IFs were very well matched to that obtained by “gold standard” manual blood sampling,
but with an increased temporal resolution of up to 1 s. The area under the curve (AUC) ratio between probe- and
manually derived IFs was 1.07 ± 0.05 with a coefficient of variation of 0.04. However, image-derived IFs were
significantly underestimated compared to the manually sampled IFs, with an AUC ratio of 0.76 ± 0.24 with a
coefficient of variation of 0.32.
Conclusions: IF derived from the beta microprobe accurately represented the IF as measured by blood sampling,
was reproducible, and was more accurate than an image-derived technique. The use of the shunt removed
problems of tissue-background activity, and the use of a light-tight probe with minimal gamma sensitivity refined
the system. The probe/shunt apparatus can be used in both microprobe and PET studies.
Keywords: beta microprobe, arterial input function, PET, rat
Background
With the increased popularity of positron emission
tomography (PET) imaging in small animals, the use of
kinetic modeling to study physiological function has
become widespread. Many kinetic models, for example
those used in the quantitative measurement of local cer-
ebral glucose metabolism or measurement of radiotracer
receptor binding, require the accurate measurement of
the time-activity curve of the tracer in plasma, known as
the input function (IF). In the case of the widely used
tracer
18
F-fluorodeoxyglucose (FDG), the time-activity
curve of tracer uptake in a specific brain region, com-
bined with the IF, can be used in a classical modeling
approach to calculate the kinetic rate constants govern-
ing passage from one compa rtment to another, and to
calculate the rate of glucose metabolism. In the case of
tracers used to image neurotransmitter receptors in the
brain, an accurate IF facilitates kinetic modeling avoid-
ing the assumptions of reference regio n models, namely
that the reference regio n is devoid of the receptors
* Correspondence:
1
University of Liège, Cyclotron Research Center (B30), Allée du 6 Août, 8,
4000 Liège, Belgium
Full list of author information is available at the end of the article
Warnock et al . EJNMMI Research 2011, 1:13
/>© 2011 Warnock et al; lice nsee Springer. This is an Open Access article distributed under the terms of the Creative Commons
Attribution License (http://creati vecommons.org/ licenses/by/2.0), which permits unrestricted use , distribution, and reproduction in
any medium, provided the original work is properly cited.
studied and that the non-specific di stribution volume is
identical between reference and target region.
A number of methods have been described for the
determination of IF in small animals. Manual blood
sampling techniques have been frequently used to esti-
mate IF. Indeed these techniques are considered as the
gold standard for IF determination, despite the fact t hat
these methods can limit the temporal resolution
between measurements, and through the reductio n of
blood volume, may influence the animal’ s physiology
[1]. Some groups have successfully impl emented micro-
blood sampling techniques to reduce the impact of
these problems [2,3]. Blood counter systems have also
been described for bo th humans and animals [4-8]
which allow continuous c ounting in a flowing catheter
to achieve h igh time resolution. Beta microprobe sys-
tems have also been used to continuously measure IF
without the need for blood sampling, in humans, pri-
mates, and rodents [ 9-13]. Non-invasive techniques
using a PET scan of the heart to determine IF in small
animals have also been developed [10,14-23]. These
methods use either a volume-of-interest (VOI) drawn in
the left ventricle or mathematical analysis to ext ract the
IF from the image. The use of a standardized IF
between animals, calibrated by one or two blood sam-
ples [24,25] and a combination of image-derived and
blood sampling methods have also been described
[26,27].
Here, we describe the use of a beta microprobe to
continuously measure IF in rats with minimal dead
volume and without the needtosubtractbackground
tissue activity, which was a problem in previous studies
using microprobes [12,13]. To achieve this, an arteriove-
nous shunt was placed between the femoral artery and
vein, in a manner similar to that described by Weber et
al. [28]. Similar shunt systems have also been reported
previously [29,30]. However, in contrast to the method
described by Weber et al. [28], a microprobe was placed
directly into the shunt blood flow instead of passing the
catheter through a separate coincidence counter. Pain et
al. [12] placed a microprobe directly into the femoral
artery to measure IF, which removes the need for a
shunt and the potential of extra cardiovascular load, but
due to the accumulation of tracer in adjacent tissues the
use of a second probe to subtract background activity
was required. This problem is also described by Laforest
et al. [10]. Seki e t al. [13] also used a two-probe shunt
system to measure IF in rhesus monkeys, with one
probe used specifically to subtract gamma radiation
from the overall (beta/gamma) signal. In the present
study, a single probe ( Swisstrace, Switzerland) was used,
and the shunt apparatus designed such that its place-
ment was highly r eproducible. A further advantage of
the Swisstrace probe used is the light-impermeable
coating. As the probe itself is insensitive to light, it is
possible to use clear materials in the shunt, allowing
visualization of the probe and confirmation of correct
positioning.
In the present study, the IF derived using the beta
microprobe shunt apparatus was compared to manual
blood sampling at 5-s interv als during t he peak phas e,
and to the IF derived from a left ventricle VOI in a
dynamic PET image of the heart to confirm its accuracy.
Materials and met hods
Animals
Male OFA (Oncins France souche A - Sprague Dawley)
rats were initially obtained at 5 weeks of a ge from
Charles River Laboratories (Bruxelles, Belgium) and sub-
sequently bred at the Animal Facility of the GIGA-Uni-
versity of Liege (BE-LA 2610359; Liege, Belgium). Mean
(±SD)bodyweightattestingwas273±46g.Theani-
mals were housed under standard 12 h:12 h light/dark
conditions with food and water available ad libitum.All
experimental procedures and protocols used in this
investigation were reviewed and approved by the Institu-
tional Animal Care and Use Committee of the Univer-
sity of Liege.
Beta microprobe system
A commercially av ailable beta microprobe system [31]
(Swisstrace, Zurich, Switzerland) was used for the mea-
surement of radioactivit y in the blood. PMO D software
version 2.95 (PMOD Technologies L td., Zurich, Switzer-
land) was used for the acquisition o f data from the
photomultiplier tubes. The system allows counting of
radioactivity with a temporal resolution of 1 s. The phy-
sical characteristics of the system and probes have been
described elsewhere [31]. The linearity of the system
was confirmed by measuring counts from a series of
solutions of known activity spanning a wide range to
encompass the range of experimental values.
Shunt apparatus and surgery
The animals were anesthetized using isoflurane in 30%
oxygen/70% nitrous oxide, and polyethylene cathet ers
(PE20; prefilled with 50 U/ml heparinized saline) were
implanted in femoral artery and vein. The catheters
were connected to an arteriovenous shunt driven by a
peristaltic pump (Watson-Marlow 403U/R1, with 0.8 ID
× 1.6 OD mm Pumpsil tubing, Wilmington, MA, USA)
at a standard flow rate of 28.60 ± 0.18 m l/h (mean ±
SD;atroompressure)inagreementwiththatreported
by Weber et al. [28]. The pump was activated 5-10 min
before PET measurements. T-connections in the shunt
allowed monitoring of blood pressure via a pressure
transducer, intravenous infusion and the insertion of a
probe tip into the blood. The arterial catheter was
Warnock et al . EJNMMI Research 2011, 1:13
/>Page 2 of 11
shortened such that the distance between artery and
probe was 10-15 cm. Distal to the probe the shunt was
37 cm in length (including the peristaltic pump tub ing)
and the venous catheter was also shortened to a length
of 10-15 cm. For the collection of blood samples for
manual counting, a second arterial catheter was
implanted in the second femoral artery.
The shunt apparatus consisted of silicone tubing
(0.040” ID × 0.085” OD Silclear tubing, Degania Sili-
cone, VWR International, Benelux) mounted on a Plexi-
glas stand with secure mounts for the T-connections
(Harvard Apparatus Standard tube T-connector #72-
9275 1.5 mm ID, Harvard University, Cambridge, MA,
USA) and a secure, adjustable, mounting point for a
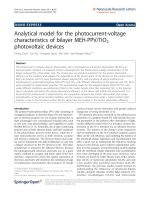
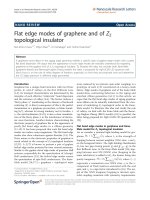
microprobe, as illustrated in Figure 1. Plexiglas was cho-
sen for the stand as it could readily be cleaned and
would not corrode after contact with saline. The T-con-
nections and microprobe are clamped in position with
custom machined Plexiglas clamps, such that the appa-
ratus can readily be dismantled for cleaning or replace-
ment of parts but with precise reassembly. The clamp
for the microprobe clamps at the solid base of the probe
and is height adjustable via two machined slo ts to
account for differences in probe lengths. The shunt was
prefilled with 250 U/ml heparinized saline (volume
approximately 400 μl). The probe connection was situ-
ated such that arterial blood first passed over the probe
tip for counting, followed by the peristaltic pump, to
prevent back-flow when infusing via the second T-con-
nection. Finally, the blood was pumped back into the
animal via the femoral vein. A probe was fixed with its
tip in the blood flow of the shunt for the measurement
of IF. In this position, the probe has a measured sensi-
tivity of 0.045 cps/kBq/ml (4.5%). The sensitivity of the
probe is a function of crystal size at the measuring tip
and detection volume. The detection volume is depen-
dent on the energy of the radioisotope used and is
approximately spherical around the probe tip [32]. In
the shunt apparatus, the detection volume is partially
filled with blood. Utilization of the full detection volume
would require larger T-connections and therefore sub-
stantially increase the dead volume.
For calibration of the shunt probe immediately after IF
measurement, the shunt was first flushed with distilled
water, followed by a solution of known radioactivity.
The activity of this solution was selected such that the
counts recorded were in the same range as the experi-
mental values. The positio n of th e probe was precise ly
maintained between IF measurement and calibration. In
this way, the system was calibrated in precisely the same
position as used for IF acquisition. The reproducibility
of the probe location in the apparatus was assessed by
comparing the calibration factors calculated between
individual studies. Cleaning and maintenance of the
shunt between studies was performed with an enzymatic
cleaning solution (Enzol, Advanced Sterilization Pro-
ducts, Irvine, CA, USA) and sterilizing solution (Cidex
OPA, Advanced Sterilization Products, Gargrave, UK).
Comparison of probe-derived, image-derived and
manually sampled input functions
To simultaneously compare the IF det ermined by either
microprobe, PET or manual sampling, Gluc otrace (
18
F-
fluorodeoxyglucose; FDG; 144.4 ± 10.7 MBq, Best Medi-
cal, Belgium) was injected as an intravenous bolus (0.5-
0.6 ml over 30 s) in eight rats, via the T-connection on
the intravenous side of the shunt apparatus. The animals
were not fasted prior to the study. Activity in the blood
was counted using the microprobe system, while blood
samples (100-150 μl) were collected every 5 s for 90 s,
then at 120, 180, 240, 300, and 600 s after FDG infusion
from the second arterial catheter. The samples were col-
lected in 1 ml of heparinized saline for manual counting
of the whole blood activity in a calibrated gamma spec-
trometer (high purity 30% germanium GR3020 Canberra
Industries, Meriden, CT, USA).
Cardiac IF was simultaneously derived from dynamic
PET images in the same eight rats using a Siemens
Focus 120 microPET scanner (Siemens, Munich, G er-
man y). The physical characteristics of this scanner have
been described elsewhere [33]. The heart was placed in
the center of the scanner field-of-view.
PET studies started with a 10-min transmission scan
carried out using a
57
Co point source with single event
acquisition mode using a 120-125-keV energy window.
FDG was injected following the transmission scan.
Emission data was then recorded in list mode for a
total of 30 min. Emission data was acquired with an
energy window of 350-65 0 keV and a coincidence-tim-
ing window of 6 ns. Data was reframed with a high
temporal resolution, especially for the first 3 min, in
order to accurately delineate peak activity in the blood
(30 × 2 s, 10 × 10 s, followed by 30-s frames). Images
were reconstructed with all corrections using Fourier
rebinning and filtered ba ckprojection with a ramp filter
cutoff at the Nyquist frequency. A total of 95 transaxial
slices were obtained in a 256 × 256 matrix. The slice
thickness was 0.796 mm, and the in-slice pixel size was
0.433 mm. To avoid spillover effects, a spherical
volume-of-interest (VOI) of 2 mm diameter was drawn
in the left ventricle of the heart for derivation of the IF.
This VOI diameter was selected after trials with varying
diameters. Two millimeters was selected as the best
compromise between increased noise in smaller VOIs
and obvious spillover (increasing counts in the tail of
the IF) in larger VOIs. The positioning of the 2 mm
VOI can be seen in Supplementary Figure 1 of see
Additional file 1.
Warnock et al . EJNMMI Research 2011, 1:13
/>Page 3 of 11
In addition to visual co mparison, the area under the
curve (AUC) determined via the three methods was
compared as a measure of the similarity between IF
obtained via either probe, PET or manual sampling.
AUC was determined for the first 10 min of data. For
AUC calculations, the probe-derived IF was adjusted for
delay and resampled with 2-s initial frames to match the
PET data (in separate studies t he delay introduced by
the s hunt apparatus has been measured at 10.3 ± 3.0 s
(mean±SD;n=7)usingfittinginPMODsoftware;
using brain time-activity curves and probe-derived IFs
for another tracer, the delay in the IF was fitted as part
of a two-compartment kinetic model). To reduce the
effect of noise on the AUC c alculations, all IFs were
a)
b
)
Femoral
Artery
Femoral
Vein
Blood Pressure
Transducer
Microprobe
IV Infusion
Peristaltic
Pump
Femoral
Artery
Femoral
Vein
Blood Pressure
Transducer
Microprobe
IV Infusion
Peristaltic
Pump
Max 15 cm
Figure 1 The shunt apparatus.(a) The shunt apparatus mounted o n the acrylic stand with adjustable clamps (upper probe mount and tip
location inlaid); (b) Diagram illustrating the design of the shunt, with T-connections for blood pressure measurement, probe insertion, and
intravenous infusion. The peristaltic pump is connected after the probe in series in order to prevent backflow from the IV infusion connection
affecting probe measurements.
Warnock et al . EJNMMI Research 2011, 1:13
/>Page 4 of 11
fitted using a bi-exponential model in PMOD and AUC
was also compared between the fitted IF curves. Using
the values from the fitted bi-exponential model the
slopes of the IFs derived from the three methods were
compared for further evaluation of the similarity
between the IFs.
Influence of shunt length, pump speed and arterial
source
The influence of shunt length (and thus volume), flow
rate by altering the speed of the peristaltic pump and
the influence of arterial source (i.e., femoral artery or
carotid artery) were investigated in separate studies (n =
2/study/condition). The length of the arteriovenous
shunt was increased by using longer PE20 catheters
from femoral artery and vein (such that the distance
from artery to probe was 45 cm compared to the usual
15 cm). Furthermore, a “minim um-possible-volume”
shunt was connected between carotid artery and jugular
vein, using a modified apparatus with a single T-connec-
tor for probe insertion (such that the distance from
artery to probe was approximately 5 cm and the total
shunt length 10-15 cm). The effect of flow rate was
investigated by altering the speed of the peristaltic
pump, using pump speeds of 14.30 ± 0.31, 28.60 ± 0.18,
or 57.20 ± 0.63 ml/h (mean ± SD). A double injectio n
protocol was used. “Standard” flow rate (28.60 ± 0.18
ml/h) was maintained during the first FDG uptake per-
iod (1 h), after which the flow rate was changed and a
second dose of FDG administered. Consecutive FDG
injections were separated and corrected for residual
activity from the first injection using a two-exponential
model i n PMOD. The curves were aligned for the start
of the IF peak, and corrected for injected activity. To
study the effect of arterial source an arteriovenous shunt
was connected between carotid artery and femoral vein,
for comparison to the femoral-femoral situation (the
distance from the carotid catheter site to the probe was
approximately 15 cm, comparable to the femoral
situation).
Statistics
The influence of IF-derivation method on AUC from
non-fitted and fitted IFs was compared using ANOVA
followed by Student’s t test for post hoc comparisons.
Results
The mean sensitivity calculated for the probe located
in the arte riovenous shunt was 0.0452 ± 0.00 2 cps/
kBq/ml (n = 8 ), with a coefficient of variation of 0.04.
This is comparable to the mean sensitivity calculated
from ongoing studies in our lab (n > 20), which was
0.0448 ± 0.007 cps/kBq/ml, with a coefficient of varia-
tion of 0.17.
Comparison of probe-derived, image-derived, and
manually sampled input functions
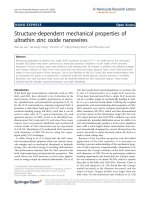
A rapid peak in blood activity was recorded with the
beta microprobe, w hich steadily fell until cessation of
recording (mean curve corrected for injected activity,
compared to the manually sampled and image-derived
mean IF is shown in Figure 2; see Suppleme ntary Figure
2 of Additional file 2 for overlaid figures displaying the
reproducibility betw een individual IFs). A high degree of
matching was seen between probe-derived IFs and cor-
responding manual blood samples. No not able disper-
sionwasobserved.TheAUCforallIFsiscomparedin
Table 1. The ratio of probe-derived to manual sampled
AUC was 1.07 ± 0.05 (mean ± SD), with a coeffici ent of
variation of 0.04. Aft er fitting of the IFs to remove
noise, the ratio of probe-derived to manual sampled
AUC was 1.06 ± 0.05 (mean ± SD), with a coeffici ent of
variation of 0 .05. Statistical analysis revealed no signifi-
cant difference in AUC between the probe-derived and
manual sampled IFs (non-fitted: ANOVA F
2,21
=3.67,p
= 0.043; t test t
(14)
= 0.52, p = 0.61. Fitted: ANOVA
F
2,21
= 4.3551, p = 0.026; t te st t
(14)
=-0.46,p =0.65).
In contrast, image-derived IFs were significantly under-
estimated (mean IF corrected for injected activity shown
in Figure 2) compared to either manual sampled or
probe-derived IFs. The ratio of image-derived to manual
sampled AUC was 0.76 ± 0.24 (mean ± SD), with a
coefficient of variation of 0.32. After fitting of the IFs to
remove noise, the ratio of image-derived to manual
sampled AUC was 0.73 ± 0.21 (mean ± SD), with a
coefficient of variation of 0.29. Statistical analysis
revealed that the underestimation of the IF reached sig-
nificance in the fitted data with only a trend in the non-
fitted data (non-fitted: t test t
(14)
= 2.07, p = 0.057.
Fitted: t test t
(14)
= 2.34, p = 0.035) . The ratio of probe-
derived to image-deri ved AUC was 1.52 ± 0.43 (mean ±
SD), with a coefficient of variation of 0.28. After fitting
of the IFs to remove noise, the ratio of probe-derived to
image-derived AUC was 1.56 ± 0.41 (mean ± SD), with
a coefficient of variation of 0.26. Slope constants for the
two-exponential components of the fitted IF models are
compared in Table 2. Statistical analysis revealed signifi-
cant differences (ANOVA F
2,21
= 19.44, p <0.001)
between manual- and probe-derived (t test t
(14)
=2.37,
p = 0.033) and manual- and image-derived (t test t
(14)
=
-3.48, p = 0.003) IFs in the slope of the first exponential
(slope 1;). However, no significant difference was found
between manual- and probe-derived IFs for the slope of
the second exponential (slope 2; ANOVA F
2,21
= 12.54,
p < 0.001; t test t
(14)
= -1.14, p = 0.27), which has a
greater influence on the shape of the IF. In contrast,
there was a significant difference in slope 2 between
manual- and image-derived methods (t test t
(14)
= -4.13,
p = 0.001).
Warnock et al . EJNMMI Research 2011, 1:13
/>Page 5 of 11
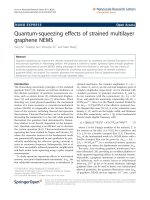
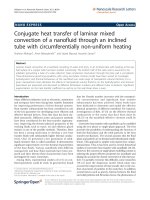
Influence of shunt length, flow rate, and arterial source
Substantially increasing the length of the shunt (from 15
to 45 cm between artery and probe) had a clear disper-
sing effect of the peak of the IF (Figure 3a). In contrast,
shortening of the shunt (from 15 to 5 cm between
artery and probe) appeared to have no clear effect (Fig-
ure 3a). While doubling of th e shunt flow rate appeared
to have no detectable influence on the shape of the IF,
asshowninFigure3b-i,ahalvingoftheflowratewas
sufficient to produce dispersion in the IF (Figure 3b-ii).
The shape of the IF did not appear to be affected by the
choice of artery for catheter implantation (Figure 3c).
Discussion
In the present study, we report the use of a specially
designed arteriovenous shunt apparatus for use in com-
bination with a beta microprobe system to determine
input function (IF) in rats. This a pparatus can be used
in studies of radioligand accumulation or binding in
small animals using either betamicroprobesystemsor
microPET. The major advantages of our system are very
high temporal resolution and no blood loss, while its
major disadvantages are its invasive nature and low
sensitivity.
The probe-derived IF close ly matched that derived by
manual blood sampling, the so called “gold standard”,as
shown by visual comparison (Figure 2) and in the com-
parison between areas under the curve (AUC) (Ta ble 1).
ThedifferenceinAUCobservedmaybeattributableto
statistical noise but also the difference in temporal reso-
lution between these techniques. Although blood sam-
ples were taken with a resolution of 5 s, the probe
system has a maximum resolution o f 1 s. In contrast to
the high degree of agreement shown between probe-
0
0.01
0.02
0.03
0.04
0.05
0.06
0.07
02468101
2
ml
-1
Time
(
min
)
Probe-derived
Manual samples
Image-derived
Figure 2 Mean arterial input functions derived from the three methodologies. Individual in put functions were corrected for inj ected
activity and aligned by the point of peak activity. Individual data points represent mean ± SEM. (Figures displaying the individual input functions
in overlay are available as supplementary data).
Warnock et al . EJNMMI Research 2011, 1:13
/>Page 6 of 11
derived and manual sampling derived IFs, image-derived
IFs showed an underestimation and increased variability
(Figure 2 and Table 1). PET-derived IF based o n a
volume-of-interest in the left ventricle of the heart has
been described for use as a true arterial IF in a number
of species [10,16,17,19-21]. Fitting of the IFs to reduce
noise h ad a negligible effect on the coefficient of varia-
tion for the AUC ratios with all methods (Table 1). In
addition to AUC, the slope constants of a bi-exponential
model fitted to the IF curves were compared. Although
AUC is a useful method for comparing the integrated
activity present in the blood over the duration of t he
study, a drawback of the method is that it is possible for
curves with very different shapes to have similar A UCs.
In the present, study it was shown that the shapes of
the IF curves are very similar (Figure 2), but comparison
of the slope constants of the bi-exponential fit provides
an indication of the instantaneous level of radioactivity
in the blood, which is of importance for kinetic model-
ing using the IF curves . Statistical analysis revealed that
all methods differed for the first slope constant, but that
there was no significant difference between the probe-
and manually derived curves in the second slope con-
stant (Table 2). Changes in the first slope constant have
a limited effect on the shape of the input function, while
the second const ant governs the decline in activity after
the p eak. Thus, the similarity in the second slope con-
stant between probe- and manually derived curves sup-
ports the result of the AUC comparison and the
conclusion that these IF curves are well matched.
A partial-volume effect is likely to be involved in the
difference between image-derived IF and the gold stan-
dard or probe-derived IF. It is well documented that
partial-volume effects adversely affect quantitative
Table 1 Area under the curve ratio between probe-derived, image-derived and manually sampled input functions
Subject
12345678
AUC AUC AUC AUC AUC AUC AUC AUC Mean SD COV
Unfitted IF
Probe IF 21,173 27,576 19,765 19,024 23,710 17,389 33,630 19,448
Manual IF 20,246 26,385 18,418 17,265 22,878 15,270 30,684 19,538
Image-derived IF 13,283 27,099 9,486 19,543 14,565 14,563 16,506 12,149
Probe/manual 1.046 1.045 1.073 1.102 1.036 1.139 1.096 0.995 1.067 0.045 0.042
Pet/manual 0.656 1.027 0.515 1.132 0.637 0.954 0.538 0.622 0.760 0.240 0.315
Probe/PET 1.594 1.018 2.084 0.973 1.628 1.194 2.037 1.601 1.516 0.425 0.281
Fitted IF
Probe IF 21,720 27,762 19,866 18,595 23,573 17,347 33,434 19,344
Manual IF 20,981 26,414 18,500 17,602 23,402 15,226 30,297 19,693
Image-derived IF 13,533 26,243 9,094.8 19,158 14,793 11,393 16,937 12,574
Probe/manual 1.035 1.051 1.074 1.056 1.007 1.139 1.104 0.982 1.056 0.050 0.048
Pet/manual 0.645 0.994 0.492 1.088 0.632 0.748 0.559 0.639 0.725 0.210 0.290
Probe/PET 1.605 1.058 2.184 0.971 1.594 1.523 1.974 1.538 1.556 0.408 0.262
AUC, area under curve; COV, coefficient of variation; IF, input function; SD, standard deviation.
Table 2 Bi-exponential fit slope constants for probe-derived, image-derived and manually sampled input functions
Subject Mean SD
12345678
Slope 1
Probe IF 4.609 4.181 3.646 3.470 4.989 3.552 3.181 3.658 3.911 0.582
Manual IF 7.627 4.847 3.646 7.746 5.582 6.038 3.215 4.591 5.411 1.570
Image-derived IF 11.626 7.983 8.705 10.502 9.327 6.343 5.888 8.149 8.565 1.815
Slope 2
Probe IF 0.048 0.038 0.046 0.028 0.047 0.025 0.039 0.038 0.039 0.008
Manual IF 0.042 0.018 0.050 0.043 0.039 0.031 0.008 0.026 0.032 0.013
Image-derived IF 0.095 0.068 0.051 0.056 0.082 0.040 0.059 0.072 0.065 0.017
IF, input function; SD, standard deviation.
Warnock et al . EJNMMI Research 2011, 1:13
/>Page 7 of 11
0
1000
2000
3000
4000
5000
6000
0 102030405060
kBq/ml
Time (min)
5 cm catheter
15 cm catheter
45 cm catheter
0
1000
2000
3000
4000
5000
6000
012345
0
1000
2000
3000
4000
5000
6000
0 15304560
kBq/ml
Time (min)
28.6 ml/hr
57.2 ml/hr
0
1000
2000
3000
4000
5000
6000
012345
(b-i
)
(a)
0
500
1000
1500
2000
2500
3000
3500
01530 45 60
kBq/ml
Time (min)
28.6 ml/hr
14.3 ml/hr
0
500
1000
1500
2000
2500
3000
3500
012345
(b-ii)
0
1000
2000
3000
4000
5000
6000
7000
0 102030405060
kBq/ml
Time (min)
femoral-femoral
carotid-femoral
0
1000
2000
3000
4000
5000
6000
7000
012345
(c)
Figure 3 Shunt length, flow rate, and arterial source.(a) Effect of shunt length on dispersion of the input function peak (first 5 min shown).
Data aligned for start of peak and corrected for injected activity for comparison purposes. (b) Effect of shunt flow rate on input function shape.
(i) Effect of increasing pump speed (inset: first 5 min); (ii) Effect of reducing pump speed (inset: first 5 min). Data aligned for start of peak and
injected activity for comparison urposes. (c) Comparison of input functions derived from femoral artery-femoral vein shunt to carotid artery-
femoral vein shunt (first 5 min shown). Data from two individual subjects. Data aligned for start of peak and corrected for injected activity for
comparison purposes.
Warnock et al . EJNMMI Research 2011, 1:13
/>Page 8 of 11
measures from small VOIs less than two times the
FWHM resolution. The Siemens Concorde Focus 120
has a measured resolution of 1.2-1.5 mm [34,35], while
the VOI used for IF determination had a diameter of 2
mm to avoid spillover. It is thus likely that a partial-
volu me effect leads to underestimation of the activity in
the blood. Furthermore, spillover of activity from the
myocardium is a serious problem in cardiac ventricular
image-derived IF in rats and mice. In the present study
in rats, spillover was reduced by using a small VOI
located centrally in the left ventricle. While spillover can
be corrected for mathematically [36,37], a clear advan-
tage of the probe-derived IF is the lack of spillover.
Methods combining image-derived IF and later blood
sampling may also help minimize spillover effects
[26,27]. Factor analysis of cardiac PET images can be
used to separate the ventricul ar and myocardial compo-
nents of the image [14,15,17-19,21-23], though calibra-
tion of the IF obtained to a blood sample may still be
necessary.
A further drawback of PET-derived IF in microPET
studies of the brain is the need to position both the
heart and region of interest (e.g., cerebral cortex) in the
field-of-view. Particularly where regions of interest are
of the same scale as individual voxels, such as in the
brain, it is well known that positioning that organ cen-
trally in the field-of-view offers optimal spatial resolu-
tion. In order to position the brain and heart in the
field-of-view of small animal scanners such as the Focus
120 simultaneously, it is necessary to position both
organs at or near the extremes of the field-of- view. This
may be detrimental to the overall data. Even in the
human situation, where scanner resolution is less criti-
cal, a reliable method for image-derived input function
without some degree of blood sampling has not yet
been achieved [38].
Dispersion of the probe-derived IF due to the cathe-
ters and the shunt, and sticking of the tracer on the
catheter walls ar e potential drawbacks of using an arter-
iovenous shunt. It has been shown that increasing cathe-
ter length and decreasing pumping speed increase
dispersion in catheter-based blood detectors [7], a con-
clusion supported by the data in the present study (Fig-
ure 3a, b). Based on calculations for dispersion in the
catheter prior to detection [39], Convert et al. [7]
reported that correction of dispersion should be unne-
cessary for PE10 catheters where flow rate is greater
than 125 μl/min (7.5 ml/h) or a length < 10 cm, or for
PE50 catheters with flow rate > 250 μl/min (15 ml/h) or
length < 20 cm. In the present study, PE20 catheters are
used with a length < 20 cm and a measured flow rate
equivalent to 477 ± 25 μl/min (15 ml/h). Thus, the
effect of dispersion should be minimal, as supported by
the similarity between probe-, image-, and manually
derived IFs in the present study. Therefore, any disper-
sion effect can thus be minimized by keeping both
catheters and shunt tubing to their minimum lengths,
minimizing the total volume, and by maintaining a suffi-
cient flow rate. If the circumstances of a give n study do
not allow opti mization of these parameters, methods for
the correction of dispersion have been described
[40-42]. The carotid artery could also be used to obtain
a probe-derived IF curv e and minimize the distance
from the heart to reduce dispersion. However, in the
case of studies of brain function, it may be desirable to
avo id possible changes in blood supply to the brain due
to catheterization of the carotid artery. Furthermore, the
comparison of carotid- and femoral-derived IFs in the
present study indicated negligible differences (Figure
3c). The influence of a large volume shunt in t he pre-
sent study was clear (Figure 3a), while the difference
between an extra-short shunt and a lon ger pump-driven
shunt was minimal (see also Figure 3a), suggesting that
only large increases in over all volume are significant. As
above, a low pump speed is undesirable as this can
increase dispersion. Indeed, halving the flow r ate in the
present study introduced a dispersion effect (Figure 3b).
Including a pump in the shunt could be considered use-
ful to standardize the flow rate between animals.
Adsorption of the tracer can be accounted for by cali-
brating the shunt using a solution of known radioactiv-
ity pumped through the shunt with probe in situ,as
described in the Materials and methods section. Thus,
the calibration factor for the shunt probe will also be
affected by tracer adsorption.
Reproducible positioning of the probe was facilitated
by the shunt design (see Figure 1), and was confirmed
by comparing the c alculated sensitivity values. The cal-
culated coefficient of variation was 0.04. This reproduci-
ble positioning also ensur es that the minimal sensitivity
of the Swisstrace probe (S wisstrace, Zurich, Switzerland)
to Cerenko v radiation [31] is also unlikely to be of con-
sequence to the accuracy of the measured IF, as the
number of counts attributable to Cerenkov radiation
was concluded to be related to the depth of the scintil-
lating fiber in the volume of activity. In the shunt-probe
apparatus, the depth of probe insertion into the blood
flow is limited to approximately 1 mm, and the design
allows this depth to be highly reproducible. It has been
argued that beta microprobe systems can be difficult to
use [10], particularly as many systems are highly sensi-
tive to ambient light. The light-tight coating of the Swis-
strace mic roprobes eliminates any influence of ambient
light and removes this technical difficulty.
Recently, a method for mi crofluidic blood sampling
has been described for IF measurement in small animals
[3]. Although this elegant approach sol ves a number of
difficulties with blood sampling in small animals, it is
Warnock et al . EJNMMI Research 2011, 1:13
/>Page 9 of 11
still not possible to achieve the time resolution of the
beta micr oprob e-derived IF or avoid blood loss entirely.
The removal of blood is, however, often required in stu-
dies with novel radiotracers, for the determination of
metabolites present in the plasma. In this case, the use
of an arteriovenous shunt is no more invasive than the
use of a catheter solely for blood sampling. Methods
using blood sampling to determine IF may have suffi-
cient volume to measure metabolites d irectly. While the
present arteriovenous shunt method allows the investi-
gator to avoid blood loss where desired, the inclusion of
a T-connection for blood withdrawal facilitates sampling
for metabolites. Furthermore, intravenous tracer and
drug administration is also facilitated.
Coincidence counters have also been u sed to mea-
sure activity in flowing catheters [7,28] with high time
resolution. Due to the increased sensitivity of these
counters, a lower dose of radiotracer can be used,
which represents an advantage over the probe-derived
system. At present, the availability and price of minia-
turized coincidence counters represent disadvantages
compared to beta microprobes. Furthermore, adequate
shielding is required for these counters which could
necessitate longer ca theters and thus increased dead
volume. The small size of the beta prob e and lack of
gamma sensitivity help to minimize these problems.
Beta microprobe systems are also dual use, in that in
addition to IF measurement they can be used in stu-
dies of the brain [12].
In those laboratories with access to a sma ll animal
PET scanner, the presently reported method allows the
addition of IF with high temporal resolution at a rela-
tively low cost, which could add value to these studies.
For example, in combination with PET, the shunt allows
the calculation of local cerebral glucose metabolism and
kinetic rate constant s in FDG studies using fu lly quanti-
tative two-compartmental modeling approaches. In the
case of studies into receptor occupancy and binding
potential, the ability to measure IF not only allows the
use of IF-reliant modeling (after the development of
conversions for plasma and metabolism of the tracer)
but also allows the comparison of binding data o btained
using either IF or a reference region.
Conclusion
In conclusion, the apparatus described in the present
study allows th e accurate determination of arterial input
function in beta emitter radiotracer experiments in rats.
It allows a high temporal resolution and minimizes
blood loss; is ideally suited to radiotracer studies already
utilizing light-tight beta microprobe systems as no extra
counter is required; and is readily combined with PET
in rats to add value to these studies.
Additional material
Additional file 1: Supplementary Figure 1: Placement of the 2-mm
VOI in the left ventricle of the rat heart image. The myocardium is
clearly shown in this average image from the last five time frames. In the
lower right panel, the maximum-intensity projection image is shown
(Supplementary Figure 1.doc, 190 K. />1534280600550379/supp1.doc).
Additional file 2: Supplementary Figure 2: Individual input
functions derived using the three methods, corrected for injected
activity and aligned for peak activity.(a) probe-derived IFs; (b)
manually sampled IFs; (c) image-derived IFs. (In order to maintain time-
framing during alignment, data points are missing in some IFs)
(Supplementary Figure 2.doc, 56 K. />1153689202550379/supp2.doc).
Acknowledgements
We would also like to thank Alain Pirlot (Université de Liège, Département
de Physique) for technical assistance in the production of the Plexiglas stand
for the shunt apparatus and the stereotactic holder for the microPET system.
Author details
1
University of Liège, Cyclotron Research Center (B30), Allée du 6 Août, 8,
4000 Liège, Belgium
2
Johnson and Johnson Pharmaceutical Research and
Development, Turnhoutseweg 30, 2340 Beerse, Belgium
3
Université de Liège,
Imagerie médicale expérimentale, Institut de Physique B5, 4000 Liège,
Belgium
Authors’ contributions
GW drafted the manuscript, with editorial input from MB, AP, and AS. GW,
MB, and AP carried out the beta microprobe and microPET studies. GW and
MB performed the data analysis. DG, FG, CL, and JA performed and were
responsible for FDG production. AS, AL, XL, and AP provided vital scientific
input and edited the manuscript. All authors read and approved the final
manuscript.
Authors’ information
This research was supported by FRS FNRS grant no. 3.4593.09 and by
Johnson and Johnson Pharmaceutical Research and Development. AP is a
senior research associate of the FRS-FNRS Belgium. MAB is supported by the
FRS-FNRS Belgium ("Collaborateur logistique FRS-FNRS”, grant 4.4508.08F).
Competing interests
This research was supported by Johnson and Johnson Pharmaceutical
Research and Development.
Received: 11 May 2011 Accepted: 10 August 2011
Published: 10 August 2011
References
1. Diehl KH, Hull R, Morton D, Pfister R, Rabemampianina Y, Smith D, Vidal JM,
van de Vorstenbosch C: A good practice guide to the administration of
substances and removal of blood, including routes and volumes. J Appl
Toxicol 2001, 21:15-23.
2. Sharp TL, Dence CS, Engelbach JA, Herrero P, Gropler RJ, Welch MJ:
Techniques necessary for multiple tracer quantitative small-animal
imaging studies. Nucl Med Biol 2005, 32:875-884.
3. Wu HM, Sui G, Lee CC, Prins ML, Ladno W, Lin HD, Yu AS, Phelps ME,
Huang SC: In vivo quantitation of glucose metabolism in mice using
small-animal PET and a microfluidic device. J Nucl Med 2007, 48:837-845.
4. Kudomi N, Choi E, Yamamoto S, Watabe H, Min Kim K, Shidahara M,
Ogawa M, Teramoto N, Sakamoto E, H I: Development of a GSO Detector
Assembly for a Continuous Blood Sampling System. IEEE Trans Nucl Sci
2003, 50:70-73.
5. Lapointe D, Cadorette J, Rodrigue S, Rouleau D, R L: A microvolumetric
blood counter/sampler for metabolic PET studies in small animals. IEEE
Trans Nucl Sci 1998, 45:2195-2199.
Warnock et al . EJNMMI Research 2011, 1:13
/>Page 10 of 11
6. Boellaard R, van Lingen A, van Balen SC, Hoving BG, Lammertsma AA:
Characteristics of a new fully programmable blood sampling device for
monitoring blood radioactivity during PET. Eur J Nucl Med 2001, 28:81-89.
7. Convert L, Morin-Brassard G, Cadorette J, Archambault M, Bentourkia M,
Lecomte R: A new tool for molecular imaging: the microvolumetric beta
blood counter. J Nucl Med 2007, 48:1197-1206.
8. Reymond J-M, Guez D, Kerhoas S, Mangeot P, Boisgard R, Jan S, Tavitian B,
Trebossen R: Development of an instrument for time-activity curve
measurements during PET imaging of rodents. Nuc Instr Methods Phys Res
A 2007, 571:358-361.
9. Maramraju S, Stoll S, Woody C, Schlyer D, Schiffer W, Lee D, Dewey S, P V:
A LSO [beta] microprobe for measuring input functions for quantitative
small animal PET. Nuc Instr Methods Phys Res A 2007, 571:407-410.
10. Laforest R, Sharp TL, Engelbach JA, Fettig NM, Herrero P, Kim J, Lewis JS,
Rowland DJ, Tai YC, Welch MJ: Measurement of input functions in
rodents: challenges and solutions. Nucl Med Biol 2005, 32:679-685.
11. Lee K, Fox PT, Lancaster JL, Jerabek PA: A positron-probe system for
arterial input function quantification for positron emission tomography
in humans. Rev Sci Instrum 2008, 79:064301.
12. Pain F, Laniece P, Mastrippolito R, Gervais P, Hantraye P, Besret L: Arterial
input function measurement without blood sampling using a beta-
microprobe in rats. J Nucl Med 2004, 45:1577-1582.
13. Seki C, Okada H, Mori S, Kakiuchi T, Yoshikawa E, Nishiyama S, Tsukada H,
Yamashita T: Application of a beta microprobe for quantification of
regional cerebral blood flow with (15)O-water and PET in rhesus
monkeys. Ann Nucl Med 1998, 12:7-14.
14. Ahn JY, Lee DS, Lee JS, Kim SK, Cheon GJ, Yeo JS, Shin SA, Chung JK,
Lee MC: Quantification of regional myocardial blood flow using dynamic
H2(15)O PET and factor analysis. J Nucl Med 2001, 42:782-787.
15. Hermansen F, Ashburner J, Spinks TJ, Kooner JS, Camici PG,
Lammertsma AA: Generation of myocardial factor images directly from
the dynamic oxygen-15-water scan without use of an oxygen-15-carbon
monoxide blood-pool scan. J Nucl Med 1998, 39:1696-1702.
16. Iida H, Rhodes CG, de Silva R, Araujo LI, Bloomfield PM, Lammertsma AA,
Jones T: Use of the left ventricular time-activity curve as a noninvasive
input function in dynamic oxygen-15-water positron emission
tomography. J Nucl Med 1992, 33:1669-1677.
17. Kim J, Herrero P, Sharp T, Laforest R, Rowland DJ, Tai YC, Lewis JS,
Welch MJ: Minimally invasive method of determining blood input
function from PET images in rodents. J Nucl Med 2006, 47:330-336.
18. Mourik JE, Lubberink M, Schuitemaker A, Tolboom N, van Berckel BN,
Lammertsma AA, Boellaard R: Image-derived input functions for PET brain
studies. Eur J Nucl Med Mol Imaging 2009, 36
:463-471.
19. Su Y, Welch MJ, Shoghi KI: The application of maximum likelihood factor
analysis (MLFA) with uniqueness constraints on dynamic cardiac
microPET data. Phys Med Biol 2007, 52:2313-2334.
20. Tantawy MN, Peterson TE: Simplified [18F]FDG image-derived input
function using the left ventricle, liver, and one venous blood sample.
Mol Imaging 2010, 9:76-86.
21. Weinberg IN, Huang SC, Hoffman EJ, Araujo L, Nienaber C, Grover-McKay M,
Dahlbom M, Schelbert H: Validation of PET-acquired input functions for
cardiac studies. J Nucl Med 1988, 29:241-247.
22. Wu HM, Hoh CK, Choi Y, Schelbert HR, Hawkins RA, Phelps ME, Huang SC:
Factor analysis for extraction of blood time-activity curves in dynamic
FDG-PET studies. J Nucl Med 1995, 36:1714-1722.
23. Wu HM, Huang SC, Allada V, Wolfenden PJ, Schelbert HR, Phelps ME,
Hoh CK: Derivation of input function from FDG-PET studies in small
hearts. J Nucl Med 1996, 37:1717-1722.
24. Huang SC, Wu HM, Shoghi-Jadid K, Stout DB, Chatziioannou A,
Schelbert HR, Barrio JR: Investigation of a new input function validation
approach for dynamic mouse microPET studies. Mol Imaging Biol 2004,
6:34-46.
25. Meyer PT, Circiumaru V, Cardi CA, Thomas DH, Bal H, Acton PD: Simplified
quantification of small animal [18F]FDG PET studies using a standard
arterial input function. Eur J Nucl Med Mol Imaging 2006, 33:948-954.
26. Ferl GZ, Zhang X, Wu HM, Huang SC: Estimation of the 18F-FDG input
function in mice by use of dynamic small-animal PET and minimal
blood sample data. J Nucl Med 2007, 48:2037-2045.
27. Shoghi KI, Welch MJ: Hybrid image and blood sampling input function
for quantification of small animal dynamic PET data. Nucl Med Biol 2007,
34:989-994.
28. Weber B, Burger C, Biro P, Buck A: A femoral arteriovenous shunt
facilitates arterial whole blood sampling in animals. Eur J Nucl Med Mol
Imaging 2002, 29:319-323.
29. Ashworth S, Ranciar A, Bloomfield PM: Development of an on-line blood
detector system for PET studies in small animals. In Quantification of
brain function using PET. Edited by: al Me. San Diego: Academic Press;
1996:62-66.
30. Ingvar M, Eriksson L, Rogers GA, Stone-Elander S, Widen L: Rapid feasibility
studies of tracers for positron emission tomography: high-resolution PET
in small animals with kinetic analysis. J Cereb Blood Flow Metab 1991,
11:926-931.
31. Weber B, Spath N, Wyss M, Wild D, Burger C, Stanley R, Buck A:
Quantitative cerebral blood flow measurements in the rat using a beta-
probe and H2 15O. J Cereb Blood Flow Metab 2003, 23:1455-1460.
32. Pain F, Dhenain M, Gurden H, Routier AL, Lefebvre F, Mastrippolito R,
Laniece P: A method based on Monte Carlo simulations and voxelized
anatomical atlases to evaluate and correct uncertainties on radiotracer
accumulation quantitation in beta microprobe studies in the rat brain.
Phys Med Biol
2008, 53:5385-5404.
33. Bahri MA, Plenevaux A, Warnock G, Luxen A, Seret A: NEMA NU4-2008
image quality performance report for the microPET focus 120 and for
various transmission and reconstruction methods. J Nucl Med 2009,
50:1730-1738.
34. Kim JS, Lee JS, Im KC, Kim SJ, Kim SY, Lee DS, Moon DH: Performance
measurement of the microPET focus 120 scanner. J Nucl Med 2007,
48:1527-1535.
35. Tai YC, Ruangma A, Rowland D, Siegel S, Newport DF, Chow PL, Laforest R:
Performance evaluation of the microPET focus: a third-generation
microPET scanner dedicated to animal imaging. J Nucl Med 2005,
46:455-463.
36. Fang YH, Muzic RF Jr: Spillover and partial-volume correction for image-
derived input functions for small-animal 18F-FDG PET studies. J Nucl Med
2008, 49:606-614.
37. Su KH, Lee JS, Li JH, Yang YW, Liu RS, Chen JC: Partial volume correction
of the microPET blood input function using ensemble learning
independent component analysis. Phys Med Biol 2009, 54:1823-1846.
38. Zanotti-Fregonara P, Fadaili el M, Maroy R, Comtat C, Souloumiac A, Jan S,
Ribeiro MJ, Gaura V, Bar-Hen A, Trebossen R: Comparison of eight
methods for the estimation of the image-derived input function in
dynamic [(18)F]-FDG PET human brain studies. J Cereb Blood Flow Metab
2009, 29:1825-1835.
39. Votaw JR, Shulman SD: Performance evaluation of the Pico-Count flow-
through detector for use in cerebral blood flow PET studies. J Nucl Med
1998, 39:509-515.
40. Ludemann L, Sreenivasa G, Michel R, Rosner C, Plotkin M, Felix R, Wust P,
Amthauer H: Corrections of arterial input function for dynamic H215O
PET to assess perfusion of pelvic tumours: arterial blood sampling
versus image extraction. Phys Med Biol 2006, 51:2883-2900.
41. Munk OL, Keiding S, Bass L: A method to estimate dispersion in sampling
catheters and to calculate dispersion-free blood time-activity curves.
Med Phys 2008, 35:3471-3481.
42. van den Hoff J, Burchert W, Muller-Schauenburg W, Meyer GJ,
Hundeshagen H: Accurate local blood flow measurements with dynamic
PET: fast determination of input function delay and dispersion by
multilinear minimization. J Nucl Med 1993, 34:1770-1777.
doi:10.1186/2191-219X-1-13
Cite this article as: Warnock et al.: Use of a beta microprobe system to
measure arterial input function in PET via an arteriovenous shunt in
rats. EJNMMI Research 2011 1:13.
Warnock et al . EJNMMI Research 2011, 1:13
/>Page 11 of 11