Veisten et al. Health Economics Review 2011, 1:3 pdf
Bạn đang xem bản rút gọn của tài liệu. Xem và tải ngay bản đầy đủ của tài liệu tại đây (321.58 KB, 9 trang )
RESEARC H Open Access
Cycling and walking for transport: Estimating net
health effects from comparison of different
transport mode users’ self-reported physical activity
Knut Veisten
*
, Stefan Flügel, Farideh Ramjerdi and Harald Minken
Abstract
Background: There is comprehensive evidence of the positive health effects of physical activity, and transport
authorities can enable this by developing infrastructure for cycling and walking. In particular, cycling to work or to
school can be a relatively high intensity activity that by itself might suffice for maximum health gain. In this paper,
we present estimates of net health effects that can be assumed for demand responses to infrastructure
development. The estimation was based on comparing current cyclists/pedestrians against potential cyclists/
pedestrians, applying the international physical activity questionnaire, which is a survey-based method for estimating
metabolic equivalent task levels from self-reported types of physical activity, and their frequency, duration and level
of intens ity (moderate or vigorous) By comparing between shares of individuals with medium or high intensity
levels, within the segments of current cyclists/pedestrians and potential cyclists/pedestrians, we estimate the
possible net health effects of potential new users of improved cycling/walking infrastructure. For an underpinning
of the estimates, we also include the respondents’ assessments of the extent to which cycling/walking for transport
replaces other physical activity, and we carry out a regression of cycling/walking activity levels on individual
characteristics and cycle/walk facility features.
Results: The estimated share of new regular cyclists obtaining net health gains was ca. 30%, while for new regular
pedestrians this was only ca. 15%. These estimates are based on the assumption that the new users of improved
cycle/walk facilities are best represented by self-declared potential users of such improved facilities. For potential
cyclists/pedestrians, exercise was stated as the main motivation for physical active transport, but among current
regular cyclists “fast and flexible” was just as important as exercising. Measu red intensity levels from physically
active transport increased with separate cycling/walking facilities, and were higher for those with higher education
and living in urban areas, while they were lower for those with higher BMI and higher age.
Conclusions: Since the share obtaining net health gains might have a huge impact on cost-benefit analysis of
new or improved infrastructure for cyclists/pedestrians, it is of importance to estimate this share. A main limitation
of our estimation is the cross-sectional design. There is a need for more case studies combining surveys and
objective measurement of physical activity changes, preferably before and after the construction of new
infrastructure.
Background
There is now strong evidence of the positive health
effects of physical activity. Daily moderate or vigorous
activity of approximately 30 minutes’ duration contri-
butes to reduced mortality and possibly to avoiding or
delaying potential outbreaks of cardiovascular disease,
stroke, colon cancer, breast cancer or type II diabetes
[1-3]. In a large study from Copenhagen based on self-
reported physical activity, m edical checks and follow-up
registration of fatalities, an all-cause relative mortality
risk of ca. 0.72 was calculated for those cycling for trans-
port compared to those not cycling [4].
Health effects may constitute a considerable benefit
element in economic assessment of policy measures pro-
moting cycling (and walking) for tran sport [3,5,6], and
* Correspondence:
Institute of Transport Economics (TØI), Gaustadalleen 21, NO-0349 Oslo,
Norway
Veisten et al. Health Economics Review 2011, 1:3
/>© 2011 Veisten et al; licensee Spri nger This is an Open Acces s article distributed under the terms of the Creative Commons Attribution
License ( es/b y/2.0), which permits unre stricted use, distribution, and reproduction in any medium,
provided the original work is properly cited.
transport authorities can contribute to this by develop-
ing infrastructure in quantity as well as quality. Cycling
to work or school is a relatively high intensity activity
that by itself might s uffice for maximum health gain.
For some people, cycling/walking transport facilities
would be a much needed arena for physical activity, i.e.
for exercise that would not be taken if the transport
infrastructure was inadequate [7,8].
In the first cost-benefit analysis of a new cycling/walking
track network taking into account the positive health
effects of physical activity it was assumed that the share of
new cyclists and pedestrians obtaining net health effects
would be 50% [6]. Recent WHO-based guidance on cost-
benefit analysis of health effects proposes the use of the
all-cause relative mortality risk estimate of 0.72, from the
Copenhagen study, for those cycling for transport, and
this is attributed to all new cyclists [3]. However, even
though the current regular cyclists have a lower mortality
risk, we lack an empirical basis for assessing the health
gain for new cyclists. We do not know, a priori, whether
new cyclists (or new pedestrians) just replace other types
of physical activity, or whether they increase their physical
activity, obtaining net positive health effects. Objective
health measurement of the affected population before/
after facility construction/enhancement is infeasible f or
most purposes.
For new cyclists/pedestrians, the potential health gains
from increased cycling/walking for transport rest on two
underlying assumptions: (i) that they do not already have
a sufficiently high physical activity level; and (ii) that they
do not just substitute cycling/walking for other physical
activity. Net health gains can be expected for the share of
respondents for whom these assumptions are met [1-4].
In the WHO guidance it is recommended though “that
activity substitution is accoun ted for in economic ana-
lyses as far as possible. This means not making an
assumption that any increase in cycling or walking auto-
matically leads to an increase in total physical activity (as
people may cycle more and do less of another activity as
aresult)” [[3], p. 9]. In the Copenhagen study the relative
all-cause mortality risk for regular cyclists of 0.72 com-
pared to non-cyclists was based on controlling for various
individ ual characteristics, including other types of physi-
cal activity. However, some factors might have been
omitted. Furthermore, it is not obvious that the potent ial
cyclists are a representative sample of all non-cyclists,
nor that the new cyclists will constitute a representative
sample of all regular cyclists. Those who currently cycle
for transport, in Denmark as well as in Norway, may con-
stitute the most physically active segment of the popula-
tion; it is possible that most of them would have been
active even if not cycling. Potential cyclists may also con-
stitute a relatively active segment; many of them may
have other physical activity that they partially replace by
cycling for transp ort if facilities are improved. The WHO
experts proposing guidelines for economic analyses of
measures increasing transportational cycling/walking, did
stress that such analyses should “incorporating a factor
into the calculations to allow for the possibility that the
level of cycling or walking being assessed will not have
increased total physical activity among some of the
observed participants” [[3], p. 9].
Our paper presents a way of estimating the share obtain-
ing net positive health effects based on questions from the
so-called international physical activity questionnaire
(IPAQ) - a survey-based method for estimating metabolic
equivalent task (MET) levels from self-reported activity
types, frequency, duration and (moderate or vigorous)
intensity level [9]. Our study enables differentiation
between current regular cyclists, or regular pedestrians,
and potential cyclists/pedestrians, i.e. those who state that
they might cycle/walk if conditions were improved. By
comparing the share of individuals with medium or high
intensity levels among current versus potential cyclists/
pedestrians, we estimate the possible net health effects on
the potential users of new/improved cycling/walking infra-
structure. Thus, our estimates of the share of new cyclists/
pedestrians obtaining net health effects are based on the
assumption that the new users of improved cycle/walk
facilities are best represented by self-declared potential
users of such improved facilities. Although this approach
is in no way the panacea for estimating net health gains,
our cont ribution is a step towards increasing our knowl-
edge of the impacts of promoting cycling and walking for
transport. We include current and potential cyclist/pedes-
trian assessments of the extent to which cycling/walking
for transport replaces other physical activity, and we carry
out a regression of cycling/walking activity levels on indivi-
dual characteristics and cycle/walk facility features.
Methods
Estimating the health effect from increased cycling/
walking
In a survey-based data collection, we can include ques-
tions about current physical activ ity for transport as well
as about all other types of physical activity. An IPAQ
available at the webpage of the Karolinska Institutet in
Stockholm is a standard
survey-based instrument that can be used to obtain inter-
nationally comparable data on health-related physical
activity [9,10]. It comprises a set of four questionnaires, a
long and a short version adapt able for either a telephone
interview or self-administer (postal) format. We adapted
the self-administer format to an Internet-based survey,
combining the short version with active transport ques-
tions from the long version. The IPAQ applied therefore
Veisten et al. Health Economics Review 2011, 1:3
/>Page 2 of 9
contains questions about frequency and duration of vig-
orous physical activity, moderate physical activity, as well
as about cycling and walking for transport.
Regarding physical activity in transport, the following
self-reported data are obtained:
• x trips of cycling per week
• y trips of walking per week
• ψ minutes of cycling per trip
• minutes of walking per trip
a
These data are en tered into a score formula for calcu-
lating the Metabolic Equivalent Task (MET) from
cycling/walking for transport during the week. 1 MET is
the metabolic equivalent task at rest (seated), for the
average adult, corresponding to approximately 3.5 ml
O
2
/kg body weight per minute [11]. Cycling for transport
is considered a vigorously physical activity, with 6 MET
per minute. Walking for transport is considered closer to
moderate physical activity (3 MET), with 3.3 MET per
minute The following
scores from physical activity for transport can be
obtained:
◦ Cycling MET minutes per week = 6 × minutes ×
trips = 6 × ψ × y
◦ Walking MET minutes per week = 3 .3 × minutes ×
trips = 3.3 × × x
◦ SUM transport MET minutes per week = 6 × ψ × y
+ 3.3 × × x
Regarding all other physical activity, the IPAQ d iffer-
entiates between vigorous and moderate, and the follow-
ing self-reported data are obtained:
• s times (days) of vigorous physical activities per
week
• t times (days) of moderate physical activities per
week
• ζ minutes of vigorous physical activity per activity
carried out
• h minutes of moderate physical activity per activity
carried out
Examples of vigorous physical activity are heavy lifting,
heavy manual work/construction work, aerobics, fast
bicycling/running, while moderate physical activities are
light manual work/construction work, swimming and fast
walking. Clearly, the examples were intended to give the
respondent some indication, and they may vary consider-
ably between subjects in terms of MET minutes. It is also
stated that “vigorous physical activities refer to activities
that take hard physical effort and make you breathe
much harder than normal"; and that “moderate activities
refer to activities that take moderate physical effort and
make you breathe somewhat harder than norma l” http://
www.ipaq.ki.se/ipaq.htm. The following scores fro m all
physical activity can be obtained:
◦ Vigorous MET minutes per week = 8 × minute s ×
activity = 8 × ψ × y
◦ Moderate MET m inutes per week = 4 × minu tes ×
activity = 4 × × x
◦ SUM all physical activity MET minutes per week =
8×ψ × y +4× × x
The contribution from active transport as a share of
all physical activity can also be calculated.
With no possibility of following cohorts or making
before-after comparisons, we opted for a comparison of
transport segments within our cross-sectional setting,
i.e. phys ical activity levels of regular cycli sts/pedestrians
compared to those of potential cyclists/pedestrians.
Based on estimation of MET minutes per week and fre-
quency of (vigorous) physical activity, we can classify
respondents into three activity classes q.
ki.se/scoring.pdf [9]:
b
◦ High (h) level of physical activity with two criteria
for classification: a) vigorous intensity activity on at least
three occasions achieving a minimum total physical
activity of at least 1500 MET minutes/week; or b) seven
or more occasions of an y combination of walking, mod-
erate intensity or vigorous intensity activities (including
cycling) ac hieving a minimum total physical activity of
at least 3000 MET minutes/week.
◦ Moderate (m ) level of physical activity, with three cri-
teria for classification: a) three or more occasions of vig-
orous intensity activity of at least 20 minutes per
occasion; or b) five or more occasions of moderate inte n-
sity activity and/or w alking of at least 30 minutes per
occasion; or c) five or more occasions of any combination
of walking, moderate intensity or vigorous intensity activ-
ities achieving a minimum total physical activity of at
least 600 MET minutes/week.
◦ Low (l) level of physical activity for individuals who
donotclassifyforeitheroftheothertwoactivity
classes.
Reaching the moderate intensity level is considered
the most important threshold for obtaining positive
health effects [9,10,12,13]. However, physical activity
beyond this level (reaching the high intensity level) may
have additional effects [4].
Physical activity substitution and a model of cycling/
walking activity levels
It is not necessar ily the case that increased cycling/walk-
ing for transport will yield net health gains, since this
depends on the existing physical activity levels of poten-
tial cyclists/pedestrians [3]. Without the possibility of fol-
lowing a population over time in a cross-section analysis,
both actual cyclists/pedestrians and potential cyclists/
pedestrians can be asked to assess the extent to which
Veisten et al. Health Economics Review 2011, 1:3
/>Page 3 of 9
physically active transport substitutes other physical
activity.
Our understanding of physically active transport in
cross-section analysis can be enhanced by modelling
cycling/walking activity levels. In presenting regression
models of walking as well as vigorous and moderate
physical activity, in a Belgian sample, it was found sig-
nificant effects of environmental variables, e.g. availabil-
ity of pavements/paths, and individual characteristics,
e.g. age [14]. In a similar regression analysis based on a
British sample, it was a lso found such a mix of indivi-
dual and environmental character istics explaining physi-
cal activity levels [15].
Survey development
Development of the survey was initiated in 2008 and a
comprehensive test of the application of the IPAQ ques-
tions a dapted to a two-wave Internet study was carried
out during the summer of 2009 via e-mail recruiting
from the national Internet panel of Synovate Norway
/>html. In Wave 1, members of the panel answered ques-
tions about current transport, including cycling and
walking; first about cycling or walking frequency during
the previous year and then about the specific IPAQ for
transport (from the long IPAQ version), the frequency
of trips of more than 10 min during the previous week
and their average duration. In Wave 2, after questions
about road safety, they answered the IPAQ short version
about v igorous and moderate physical activities during
the previous week and their frequency and average
duration. (The questions about walking and sitting were
not included.)
Based on comprehensive testing in the summer of
2009, we changed the introduction compared to the
IPAQ (short version). Since the Internet mode does not
enable viewing questions ahead, we found it necessary
to state in the introduction to the physical activity ques-
tions in Wave 2 that questions would be asked about
both vigorous and moderate activity. Furthermore, a
question introduced about any vigorous or moderate
physical activity during the previous week, such that
those stating no activity would skip the IPAQ entirely,
and those indicating, e.g. only moderate physical activity,
wouldskipthequestionaboutfrequencyandduration
of vigorous activities. We believe these changes have
improved the IPAQ’s applicability to Internet-based
surveys.
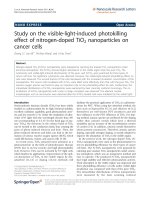
The main two-wave Internet-based survey
Our main survey was applied to a fairly large sample of
the Norwegian population and carried out in two waves
during late April and the beginning of May 2010. In
Wave 1, the respondents described a recent trip they
had taken for some particular transport purpose, i.e.
cycling, walking or another transport mode, as well as
answered other common questions about frequency and
extent of cycling/walking f or transport. 7082 respo n-
dents from Wave 1 also responded to Wave 2 questions
about all types of vigorous and moderate physical activ-
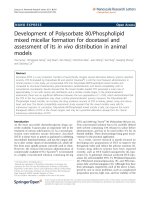
ity choice; 21.87% of those recruited to Wave 1
responded, and the effective response rate for Wave 2
was 16.32% (Figure 1).
c
In Wave 2, 4740 o f the 7083 respon dents answered
questions about vigorous and moderate physical activity.
The (7083-4740=) 2343 were not excluded at random;
they all reported a car trip in Wave 1, and received a
different version of Wave 2. But, 40% of those reporting
a car trip in Wave 1 received q uestions about p hysical
activity in Wave 2, togethe r with all those who reported
trips with other transport mode than car. The transport
segments considered are displayed in Table 1.
Comparing the numbers responding t o, respectively,
Wave 2 and the particular questions about moderate
and vigorous physical activity in Wave 2, we can see
that the difference is greatest for those not cycling/walk-
ing in transport. Those not responding to the question
about physical activity, in Wave 2, reported a recent car
trip in Wave 1. Determining “regular cycling” was based
on an assessment of cycling frequency during the
cycling season (approximately from April to October),
since most cyclists in Norway quarantine their bicycle
during winter.
The main comparison between segments will be that
of the share of respondents with high (h) and moderate
(m) activity levels between segment 1a of regular cyclists
(or 1b of regular pedestrians) and segment 3 of potential
cyclists/pedestrians [9]:
(
percent m +percenth
)
se
g
ment 1a
−
(
percent m +percenth
)
se
g
ment
3
Figure 1 Two-wave Internet-based survey.
Veisten et al. Health Economics Review 2011, 1:3
/>Page 4 of 9
and:
(
percent m +percenth
)
se
g
ment 1b
−
(
percent m +percenth
)
se
g
ment
3
We included direct questions, in Wave 1, about the
extent to which cycling/walking for transport may
replace other physical activity, asking both an ex post
assessment of cyclists/pedestrians and an ex ante assess-
ment of potential cyclists/pedestrians.
Finally, in Wave 1, some of the cyclists/pedestrians
reported a recent biking/walking trip: the time it took,
theshareofthetriptimeonseparatecycling/walking
facilities, and the number of intersections (with motor-
ized traffic). We included these two variables, together
with individual characteristics, in the regression model
of MET minutes per week [14,15].
Results
Basic statistics about the sample
In our sam ple of 4721 respon dents, the average age was
46.3 years (from 17 to 87), with the median close to the
average: 58% were men and 29% had a university degree
at master’s level, while another 37% had a lower univer-
sity degree. Average monthly person al net income was
approximately NOK 23,000 (n = 4460), based on taking
midpoints from income intervals and setting the maxi-
mum to NOK 55,000. The median lay in the interval
NOK 15,000 to 20,000.
Average age is l ower for those cycling in transport,
and men are slightly overrepresented. Average monthly
personal net income is close to th e average for all seg-
ments, but there is a significant difference between the
segments in regard to education. Respondents who reg-
ularly cycle (or walk) in traffic (trips longer than 10
min) are more likely t o have a university degree. Those
who do not consider cycling/walking as an option have
a particularly high relative share of compulsory educa-
tion as their highest degree.
The average weight and BMI is lowest for regular
cyclists, followed by regular pedestrians and irregular
cyclists/pedestrians; however, the segment o f regular
pedestrians has females making up the highest share.
Regular cyclists also evaluate their own health as better,
compared to the others. The comparisons between seg-
ments in terms of health indicators seem consistent and
intuitive.
Physical activity levels for transport and in general
In the IPAQ it is asked about the number of times dur-
ing the week the respondents carried out physical activ-
ity exceeding 10 minutes’ duration. Regular cyclists
indicated the highest frequency and total durat ion of all
types of vigorous and moderate physical activity, fol-
lowed by regular pedestrians. From the stated n umber
of times physical activity of different intensities was car-
ried out and d uratio ns of the activities, the MET can be
calculated. As expected from registered activity fre-
quency and duration, the highest average level of MET
minutes per week from all types of vigorous and moder-
ate physical activity is obtained for regular cyclists. Then
follow the r egular pedestrians before the irregular
cyclists/pedestrians. Those stating that they would
potentially cycle/walk for transport given improved facil-
ities didn’t obtain higher MET levels than those stating
no interest in cycling/walking for transport.
The correlation between MET cycling/walking and MET
physical activity (in total) is relatively low, i.e. only 0.41
(Pearson correlation), but is significant at the 0.05 level (2-
tailed). We stress that MET cycling/walking and MET
physical activity were calculated for two different weeks.
Estimating the share obtaining net positive health effects
from increased cycling/walking for transport
Based on the estimated MET minutes per week and fre-
quency and (total) duration of various types of physical
Table 1 Transport segments, shares in Wave 2 based on reporting of cycling/walking in Wave 1
N - wave 2 N - wave 2, receiving and responding to questions about
physical activity
1a. Regularly cycling for transport (>3 times per week, during
cycling season)
743 (10.5%) 731 (15.5%)
1b. Regularly walking for transport (>3 times per week), and
not already in 1a
1558 (22.1%) 1216 (25.8%)
2. Irregularly cycling/walking for transport (from once a year
until 3 times per week)
2956 (41.9%) 1911 (40.5%)
3. Not cycling/walking for transport, but could potentially
cycle/walk given improved facilities
1253 (17.8%) 625 (13.2%)
4. Not cycling/walking for transport, and would not do it in
any case
546 (7.7%) 238 (5.0%)
Total 7056 4721
For 27 (of the 7083) respondents in Wave 2 there were missing values; and for 19 (of the 4740) responding to questions about (vigorous and moderate) physical
activity in Wave 2, there are missing values.
Veisten et al. Health Economics Review 2011, 1:3
/>Page 5 of 9
activity, we can now classify respondents in regard to
intensity levels of physical activity. The classification is
differentiated depending on transport segment and is
displayed in Table 2. The highest shares of high and
medium intensity levels of physical activity are obtained
for regular cyclists - a majority from c ycling for trans-
port. An incon sistency is that the share of low intensive
regular cyclists is higher for all vigorous/moderate activ-
ity than it is for physical active transport. Among regu-
lar pedestrians and irregular cyclists/pedestrians, very
few qualify for high intensive physically active transport.
We estimate the share obtaining a positive health
effect from a change to cycling or walking for transport
by comparing these segments and the potential cyclists/
pedestrians [9]:
(
percent m +percenth
)
se
g
ment 1a
−
(
percent m +percenth
)
se
g
ment 3
= 29.7
%
and:
(
percent m +percenth
)
se
g
ment 1b
−
(
percent m +percenth
)
se
g
ment 3
= 16.4
%
The indication is that the potential health gain is con-
siderably greater for new cyclists than for new pedes-
trians. However, there are physically active individuals
among those not cycling or walking in transport, and
for some the change to cycling (or walking) for com-
muting or doing errands might replace other physical
activity.
Self-assessment of the extent to which cycling/walking
for transport substitutes other physical activity
Among potential cyclists/pedestrians there is a larger
share assessing that cycling/walking in transport
would imply more time-use on physical activity, com-
pared to the shares among those currently cycling/
walking, respectively 45.3 percent vs. 28.7 percent.
This might indicate different (assumed or actual) phy-
sical activity levels without cycling/walking and also
that the ex ante perspective brings in hypothetical
overstatemen t.
Although there is some sort of dynamic in this self-
assessment combining ex ante and ex post perspectives,
it may not provide any better estimates of net health
gain than the cross-section comparison of MET. How-
ever, the share indicating more time-use for physical
activity after commencing cycling/walking for transport
could represent an alternative estimate of the share
obtaining net health gain (given that they were not suffi-
ciently physically active at the outset). The share indicat-
ing less time-use for physical activity after commencing
cycling/walking for transport could indicate more effi-
cient time-use for physical activity, respectively 18 per-
cent among potential cyclists and 22.5 percent among
regular cyclists/pedestrians.
Regarding causes stated for cycling/walking in t rans-
port, the largest share ticked exercise as the most
important reason for their choosing cycling/walking for
transport. However, while this share was more than a
half for irregular cyclists/pedestrians, it was just above
one-third for regular cyclists. For regular cyclists, a simi-
lar share ticked fast and flexible as main reasons.
Regression of cycling/walking activity level on individual
characteristics and cycling/walking facility elements
Table 3 gives the regression models (OLS) of MET min-
utes per week for cy cling and walking, respectively,
including individual characteristics and environmental/
infrastructural features. The coefficient values indicate
marginal effects on MET (log-transform ed) from cycling
or walking. Individual characteristics, as well as environ-
mental/infrastructural features, significantly covariate
with measure d MET minutes per week. BMI covariates
negatively with MET minutes for both cycling and walk-
ing, while university education level covariates positively.
For MET from walking for transport, income, male gen-
der, age and having children in the household covariate
negatively. The latter two variables also covariate nega-
tively with MET from cycling, but only in the model
without infrastructural characteristics (model i). For
MET from cycling, introducing the infrastructural
Table 2 Shares of high (h), moderate (m) and low ( l) intensity level of physical activity carried out during the week
(N = 4721)
Intensity level from
physical activity
transport
Intensity level from all
physical activity
hm l hml
1a. Regularly cycling for transport (>3 times per week, in season) 22.3% 66.3% 11.4% 32.7% 34.3% 33.0%
1b. Regularly walking for transport (>3 times per week), and not already in 1a 0.7% 43.7% 55.5% 21.2% 32.5% 46.3%
2. Irregularly cycling/walking for transport (from once a year to 3 times per week) 0.4% 3.5% 96.1% 19.2% 23.4% 57.4%
3. Not cycling/walking for transport, but could potentially cycle/walk given improved facilities 11.4% 25.9% 62.7%
4. Not cycling/walking for transport, and would not do so in any case 14.3% 23.5% 62.2%
All sample 20.3% 27.8% 51.7%
Veisten et al. Health Economics Review 2011, 1:3
/>Page 6 of 9
characteristics reduces the significance of individual
characteristics. The significant positive sign for residence
in city compared to rural area (for cycling MET also
semi-urban area) is most likely due to more facilities for
cycling and walking in urban areas.
The shares of separate cycling/walking facilities and
number of intersections from a reported actual trip
(cycling or walking) were registered. The coefficient for
the share of separated facilities appears with significantly
positive sign only in the model for cycling MET. The
coefficient of crossings per km appears with significantly
positive sign, and the co-variation is particularly strong
for MET walking. For the modelling of MET minutes
per week walki ng, cycling as transport mode in the
reference trip was also con trolled and the coefficient has
significantly positive sign.
In the regression modelling of MET minutes per week
cycling or walking for transport, several characteristics of
the individual and of the infrastructural features in his/her
surroundings appeared with expected coefficient signs.
However, a positive sign for the number of intersections
per km was not as expected, although this supposed bar-
rier was less positive for cycling. The specification of the
infrastructural features was possibly too coarse, such that
the intersection variable contained omitted specification of
cycling/walking facility supply that was not contained in
the dummy variables for the degree of urbanization.
Discussion
Our study presents a new approach assessing cycling/
walking in transport and estimating potential health
gains. Surveying in a transport context enabled compari-
son between current cyclists/pedestrians and potential
cyclists/pedestrians based on self-reported activity levels.
Thereisveryprobablyself-selectionintransportmode
choice, such that physically active people to a larger
extent, ceteris paribus, choose physical active transport
modes. Our study indicates that those who initiate or
increase cycli ng/walking for transport will substitute for
other physical activity a combination of saving time and
increasing overall time spent on physical activity.
It is not obvious that potential cyclists who start
cycling for transport will reach the average total physical
activity level of existing regular cyclists. This represents
additional information c ompared to, for example, com-
parison of all-cause relative mortality risk between
cyclist s and all others [4]. However, we certainly do not
claim superior estimates. There are obvious weaknesses
in our cross-section data with self-reported activity
levels. The registration of physical activity in general
wasdoneapproximatelyoneweekaftertheregistration
of physical active transport. Changes in the weather and
a short May Day holiday for part of the sample, between
the two weeks of registration in the two-wave survey,
could have exacerbated differences in physical activity
levels. The correlation between these two measures was
approximately 0.4.
In general, people tend to underreport moderate phy-
sical activity [16,17]. Furthermore, in our case, some
individuals might have omitte d physical active transport
when asked about physical activity in general. The
underestimation of overall physical activity is also indi-
cated from a comparison against Norwegian estimates
in former studies [18]. While this error leads to a down-
ward bias of net health gains, the effect of the underre-
porting of moderate activity is not so clear in our case.
Table 3 Ln MET minutes per week, cycling and walking, by independent variables, OLS regression analysis
Model ln(MET-cycling), N = 1575 ln(MET-walking), N = 4740
(i)(ii)(i)(ii)
value t-statistic value t-statistic value t-statistic value t-statistic
Constant 10.440 7.731 8.778 6.578 12.829 13.011 12.006 12.140
ln_age 497 -2.698 157 845 -1.156 -8.624 -1.001 -7.419
Male .008 .071 .001 .010 250 -2.870 247 -2.850
University education .574 4.560 .446 3.588 .525 5.707 .446 4.857
Children in household 178 -1.554 072 641 640 -7.020 624 -6.832
log_income .073 .634 051 447 285 -3.295 321 -3.731
ln_BMI -1.349 -4.100 -1.246 -3.869 802 -3.526 726 -3.208
Reference trip, cycle .359 2.071
Residence in semi-urban area .545 3.043 .088 .691
Residence in city 1.074 6.290 .400 3.388
ln_share_separated .153 4.515 070 -1.579
ln_crossings_km .185 1.781 .674 5.656
Adj. R
2
.035 .082 .060 .076
Rural area is reference category to semi-urban and city residency. “ Reference trip cycle” indicates that the respondent reported a recent cycling trip in Wave 1 of
the survey; and the share of separated cycling/walking paths and the number of crossings were based on the reported cycling or walking trip.
Veisten et al. Health Economics Review 2011, 1:3
/>Page 7 of 9
Regarding s elf-assessment of potential cycling/walking,
including distance measures for work/school and shop-
ping could possibly have been used as a type of control.
Conclusions
We have presented a me thod for estimating the share
obtaining net positive health effects from physically
active transport based on questions from the IPAQ
[9,12]. We differentiated between current regular cyclists
and potential cyclists/pedestrians, and compared
between the shares of individuals with medium or high
intensity levels. The estimated share of new regular
cyclists obtaining net health gains was ca. 30%, while for
new regular pedestrians this was only approximately
15%. A lower average intensity level for walking than for
cycling might partially explain this difference. Our esti-
mates are based on the assumption that the new (and
unknown) users of improved cycle/walk facilities are
best represented by self-declared potential users of such
improved facilities.
Regarding assessment of total time spent on physical
activity when commencing phy sically active transport, a
slightly larger share stated more time spent than less
time spent, and the difference was prominent among
potential cyclists/pedestrians. For potential cyclists/
pedestrians, exercise was stated as the main motivation
for physical active transport, but among current regular
cyclists “fast a nd flexible” was just as important as exer-
cising in their choosing cycling as a transport mode. This
can be taken as yielding some support to the findings
from the IPAQ-based comparison, that the majority of
the active cyclists have substituted cycling for other exer-
cise. Measured intensity levels from physically active
transport increased w ith separate cycling/wa lking facil-
ities, and were higher for those with higher education
and living in urban areas, while they were lower for those
with higher BMI and higher age. The correlation with
demographic factors was consistent with results from for-
mer studies [19,20]. Thus, new/improved facilities are
important for stimul ating physicall y active transport, but
there is seemingl y self-selection of relatively young and
fit to cycling in transport.
We believe that our contribution is a step towards
increasing our knowledge oftheimpactsofpromoting
cycling and walking for transport. However, there is
clearly scope for improving our applicat ion of the IPAQ
questions. Self-reported physical activ ity combined with
medical checks and follow-up registration of fatalities
[4], with our differentiation between current regular and
potential cyclists/pedestrians, would be promising devel-
opment. Finally, the follow-up should include some
measurement of physical activity changes, preferably
related to infrastructure measures that could affect
cycling/walking in transport. There is a need for more
case studies combining surveys and objective measure-
ment of physical activity changes, preferably carried out
before and after the construction of new infrastructure.
Endnotes
a
“Per day” is applied in the original format http://
www.ipaq.ki.se/ipaq.htm. We made changes for the
Internet-based adaptation of the self-administered for-
mat of the short questionnaire version plus cycling/
walking for transport. The questions about physical
activity duration were posed as per activity (or per trip)
rather than per day, as applied in the original version,
since a pilot survey indicated misunderstanding of fre-
quency and duration (of different activities) per day.
Furthermore, we added an introduction clarifying that
respondents would be asked about both vigorous and
moderate physical activity.
b
In the Copenhagen study, leisure time physical activ-
ity was assessed by responses to the following state-
ments: “(1) You are almost entirely sedentary or
perform light physical activity less than 2 hours per
week, ie, reading, TV, cinema; (2) You perform light
physical activity 2-4 hours per week, ie, walking, cycling,
light gardening; (3) You perform light physical activity
more than 4 hours per week or more vigorous activity
2-4 hours per week, ie, brisk walking, fast cycling, heavy
gardening, sports where you get sweaty or exhausted;
(4) You perform highly vigoro us physical act ivity more
than 4 hours per week or regular exercise or competi-
tive sports several times per week” [4].
c
According to Synovate Norway www.synovate.no,
our response rate is common for their Internet panel,
and they apply techniques for adjusting the sample to
population figures, i.e. distributi ons of gen der, age and
regional belonging. Synovate Norway, formerly MMI
(Markeds- og Mediainstituttet) AS, is part of the interna-
tional opinion research company Synovate www .syno-
vate.com.
Abbreviations
BMI: Body Mass Index; IPAQ: International Physical Activity Questionnaire;
MET: Metabolic Equivalent Task; WHO: World Health Organization.
Acknowledgements
The data collection for this research was funded by the Norwegian Public
Roads Administration, the Norwegian National Rail Administration, Avinor ,
the Norwegian Coastal Administration, and the Norwegian Ministry of
Transport and Communications, through the project “Valuation study”.We
also thank Maria Börjesson, Rune Elvik, Marit Killi, Kristin Magnussen, Ståle
Navrud, Kjartan Sælensminde and Hanne Samstad, for contributions at
various stages of this research. We are also very grateful for the helpful
comments from two anonymous referees of this journal. Any remaining
errors and omissions are entirely our own responsibility.
Authors’ contributions
KV has made substantial contribution to conception and design, acquisition
of data, interpretation of data, and has leaded the drafting of the
manuscript. SF has made substantial contribution to conception and design,
Veisten et al. Health Economics Review 2011, 1:3
/>Page 8 of 9
acquisition of data, has leaded the analysis and interpretation of data, and
has been involved in drafting of the manuscript. FR has made substantial
contribution to conception and design, acquisition of data, and has revised
the manuscript critically. HM has made substantial contribution to
conception and design, as well as to the interpretation of data, and has
critically revised the manuscript. All authors have given final approval of the
version to be published.
Competing interests
The authors declare that they have no competing interests.
Received: 22 February 2011 Accepted: 20 July 2011
Published: 20 July 2011
References
1. Warburton DER, Nicol CW, Bredin SSD: Health benefits of physical activity:
the evidence. Canadian Medical Association Journal (CMAJ) 2006,
174(6):801-809.
2. Matthews CE, Jurj AL, Shu X-O, Li H-L, Yang G, Li Q, Gao Y-U, Zheng W:
Influence of exercise, walking, cycling, and overall non exercise physical
activity on mortality in Chinese women. American Journal of Epidemiology
2000, 165:1343-1350.
3. Cavill N, Kahlmeier S, Rutter H, Racioppi F, Oja P: Methodological guidance
on the economic appraisal of health effects related to cycling and
walking: summary. Economic assessment of transport infrastructure and
policies. Copenhagen World Health Organization (WHO), WHO Regional
Office for Europe; 2008.
4. Andersen LB, Schnohr P, Schroll M, Hein HO: All-cause mortality
associated with physical activity during leisure time, work, sports, and
cycling to work. Archives of Internal Medicine 2000, 160:1621-1628.
5. Elvik R: Which are the relevant costs and benefits of road safety
measures designed for pedestrians and cyclists? Accident Analysis and
Prevention 2000, 32:37-45.
6. Saelensminde K: Cost-benefit analyses of walking and cycling track
networks taking into account insecurity, health effects and external
costs of motorized traffic. Transportation Research Part A 2004, 38:593-606.
7. Badland H, Schofield G: Transport, urban design, and physical activity: an
evidence-based update. Transportation Research Part D 2005, 10:177-196.
8. Sallis JF, Glanz K: The role of built environments in physical activity,
eating, and obesity in childhood. The Future of Children 2006, 16:89-108.
9. Craig CL, Marshall AL, Sjöström M, Bauman AE, Booth ML, Ainsworth BE,
Pratt M, Ekelund U, Yngve A, Sallis JF, Oja PA: International physical
activity questionnaire: 12-country reliability and validity. Medicine and
Science in Sports and Exercise 2003, 35:1381-1395.
10. Hagströmer M, Oja P, Sjöström M: The International Physical Activity
Questionnaire (IPAQ): a study of concurrent and construct validity. Public
Health Nutrition 2006, 9:755-762.
11. Ainsworth BE, Haskell WL, Leon AS, Jacobs DR Jr, Montoye HJ, Sallis JF,
Paffenbarger RS Jr: Compendium of physical activities: classification of
energy costs of human physical activities. Medicine & Science in Sports &
Exercise 1993, 25:71-80.
12. Anderssen SA, Hansen BH, Kolle E, Steene-Johannessen J, Børsheim E,
Holme I, Beldo S, Dillern T, Aspvik NP, Solbraa A, Dyrstad S, Lohne-Seiler H,
Støa EM, Lorentzen C, Jakobsen JE: Fysisk aktivitet blant voksne og eldre i
Norge: resultater fra en kartlegging i 2008 og 2009. Rapport IS-1754, 10/
2009 Oslo, Norwegian Directorate of Health; 2009.
13. DoH: At least five a week: evidence on the impact of physical activity
and its relationship to health. Report from the Chief Medical Officer London,
Department of Health (DoH); 2004.
14. De Bourdeaudhuij I, Sallis JF, Saelens BE: Environmental correlates of
physical activity in a sample of Belgian adults. American Journal of Health
Promotion
2003, 18:83-92.
15. Cochrane T, Davey RC, Gidlow C, Smith GR, Fairburn J, Armitage CJ,
Stephansen H, Speight S: Small area and individual level predictors of
physical activity in urban communities: a multi-level study in Stoke on
Trent, England. International Journal of Environmental Research and Public
Health 2009, 6:654-677.
16. Bassett DR Jr: Validity and reliability issues in objective monitoring of
physical activity. Research Quarterly for Exercise and Sport 2000, 71:S30-S36.
17. Washburn RA, Heath GW, Jackson AW: Reliability and validity issues
concerning large-scale surveillance of physical activity. Research Quarterly
for Exercise and Sport 2000, 71:S104-S113.
18. Bauman A, Bull F, Chey T, Craig CL, Ainsworth BE, Sallis JF, Bowles HR,
Hagströmer M, Sjöström M, Pratt M: The International Prevalence Study
on Physical Activity: results from 20 countries. International Journal of
Behavioral Nutrition and Physical Activity 2009, 6:21.
19. Martínez-González MA, Martínez JA, Hu FB, Gibney MJ, Kearny J: Physical
activity, sedentary lifestyle and obesity in the European Union.
International Journal of Obesity 1999, 14:305-313.
20. Trost SG, Owen N, Bauman A, Sallis JF, Brown W: Correlates of adults’
participation in physical activity: review and update. Medicine & Science in
Sports & Exercise 2002, 34:1996-2001.
doi:10.1186/2191-1991-1-3
Cite this article as: Veisten et al.: Cycling and walking for transport:
Estimating net health effects from comparison of different transport mode
users’ self-reported physical activity. Health Economics Review 2011 1:3.
Submit your manuscript to a
journal and benefi t from:
7 Convenient online submission
7 Rigorous peer review
7 Immediate publication on acceptance
7 Open access: articles freely available online
7 High visibility within the fi eld
7 Retaining the copyright to your article
Submit your next manuscript at 7 springeropen.com
Veisten et al. Health Economics Review 2011, 1:3
/>Page 9 of 9