Lauridsen and Pradhan Health Economics Review 2011, 1:11 ppt
Bạn đang xem bản rút gọn của tài liệu. Xem và tải ngay bản đầy đủ của tài liệu tại đây (229.05 KB, 6 trang )
RESEARCH Open Access
Socio-economic inequality of immunization
coverage in India
Jørgen Lauridsen
1*
and Jalandhar Pradhan
2
Abstract
To our knowledge, the present study provides a first time assessment of the contributions of socioeconomic
determinants of immunization coverage in India using the recent National Family Health Survey data. Measurement
of socioeconomic inequalities in health and health care, and understanding the determinants of such inequalities
in terms of their contributions, are critical for health intervention strategies and for achieving equity in health care.
A decomposition approach is applied to quantify the contributions from socio-demographic factors to inequality in
immunization coverage. The results reveal that poor household economic status, mother’s illiteracy, per capita state
domestic product and proportion of illiterate at the state level is systematically related to 97% of predictable
socioeconomic inequalities in full immunization coverage at the national level. These patterns of evidence suggest
the need for immunization strategies targeted at different states and towards certain socioeconomic determinants
as pointed out above in order to reduce socioeconomic inequalities in immunization coverage.
JEL Classification: I10, I12
Keywords: health inequality, immunization, India, decomposition, socio-economic inequality
Background
The distributive dimension of health or health inequality
has become prominent on global health policy agenda,
as researchers have come to regard average health status
as an inadequate summary of country’s health perfor-
mance [1]. Socioeconomic inequalities in child health
are a major concern in developing countries to achieve
the Millennium Development Goals set forth by the
United Nations [2]. Yet progress towards achieving
goals in reducing socioeconomic inequalities in child
health may have been stymied by a critical gap in docu-
menting and understanding trends in socioeconomic
inequality in child health indicators particularly in less
developed countries (endnote a). While many cross sec-
tional studies have been performed, relatively little evi-
dence is available regarding how socioeconomic
inequalities in health have changed over time as the
development process unfolded and levels of urbanization
rose, women’s educational attainment improved, infra-
structure spread, and income and wealth increased;
however, few studies have shown that socioeconomic
disparities in health have in fact increased (endnote b).
In developing countries, gaps in health-related out-
comes between the rich and the poor are large [3-7].
These gaps limit poor peoples’ potential to contribute to
the economy by reducing their capacity to function and
live life to the fullest - and even to survive. The study of
poor-rich inequalities in health status should not, how-
ever, solely aim to qua ntify their magnitude. Research
should also aim to identify which population subgroups
are the most disadvantaged. For this purpose, it should
be possible to identify the determinants of inequalities,
including those associated with age, gender, education,
occupation etc. These variables have previously been
identified as powerful sources of health inequalities in
low and middle income countries [8,9].
A growing number of studies have exami ned inequal-
ities in immunization coverage by household economic
status in developing countries like India [10-14]. Many
studies have assessed the level of socioeconomic
inequalities in health using concentration indices and
concentration curve. Though the values of concentration
indices (CIs) show the degree of socio-economic
inequality, it does not highlight the pathways through
* Correspondence:
1
Institute of Public Health - Health Economics, Univ ersity of Southern
Denmark, Denmark
Full list of author information is available at the end of the article
Lauridsen and Pradhan Health Economics Review 2011, 1:11
/>© 2011 Lauridsen and Pradhan; licensee Springer. This is an Open Access article d istributed under the terms o f the Creative Commons
Attribution License (http://creativecom mons.org/licenses/by/2.0), which permits unrestricted use, distribution, and reproduction in
any medium, provided the original w ork is properly cited.
which inequality occurs. Decomposition of inequalities is
critical to explore pathways o f socioeconomic inequal-
ities in child health.
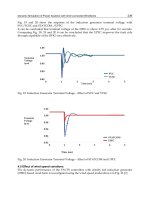
Moreover the full immunization coverage rate has only
increased from 71% in 1992 to 80% in 2006 in India (Fig-
ure 1). There is a little progress from wave 2 to wave 3 of
the National Family Halth Survey i.e. period from 1998-
99 to 2005-06. Children not fully immunized have just
declined by two percentage point i.e. from 58% to 56%.
So, an intensive study is required to assess such disap-
pointing progress in full immunization coverage.
To our knowledge, there has been virtually no study
that attempted decomposition of health inequalities in
the Indian cont ext to understand such pathways . More-
over, this study also considered state level covariates
along with household/individual level variables to exam-
ine the degree of contribution to the total socio-eco-
nomic inequality in full immunization coverage. Given
the methodological developments and the policy rele-
vance, an attempt has been made in the present study
for the first time to decompose health inequalities in
terms of immunization coverage in Indian. The objective
of this study is two-fold: first is to use a concentration
index to quantify the socioeconomic distribution of
child not fully immunized and; second is to decompose
these inequalities b y quantifying the contribution attri-
butable to both household/individual covariates (i.e. eco-
nomic status, education of mother, caste, residence,
birth order and sex of the child) and state specific vari-
ables (i.e. poverty ratio, per-capita state domestic pro-
duct, Income inequality measured in terms of Gini
coefficient, % of public health spending of the total
health spending, % of illiterate, % of Scheduled Tribe/
Scheduled Caste population).
Methods
Similar to previous studies initiated by Wagstaff et al.
[15] we use t he concentrat ion index as our m easure of
relative socioeconomic inequality in immunization cov-
erage. A concentration curve L(s) plots the c umulative
proportion of the population (ranked by socioeconomic
status (SES), beginning with lowest SES) against the
cumulative proportion of children not being fully
immunized. If L(s) coincides with the diagonal every-
one is equally off. However, if L(s) lies above the diag-
onal, then inequality in coverage exists and favors
thosewithhighSES.ThefurtherL(s) lies from the
diagonal, the greater the degree of inequality. The con-
centration index, C, is defined as twice the area
between L (s ) a nd the diagonal and tak es a value of 0
when everyone is equally of regardless of SES. The
minimum and maximum values of C are -1 and +1,
respectively; these occur in the (hypothetical) situation
where immunization is concentrated in the hand of
the least disadvantaged and the most disadvantaged
person, respectively. Thus, the larger negative value of
C, the more the absence of full immunization concen-
trates among low SES groups. A computational for-
mula for C, which allows for application of sample
weights was given by Kakwani et al. [16] as
C =
2
Nμ
N
i=1
w
i
y
i
R
i
− 1
,where
μ =
1
N
N
i=1
w
i
y
i
is the
weighted mean of the sample, i.e. the weighted propor-
tion not fully immunized, N the sample size, y
i
an indi-
cator for not bein g fully immunized, Wi the sample
weight of the individual (which sums to N)andR
i
the
fractional rank defined according to Kakwani et al. as
R
i
=
1
N
i−1
j=1
w
j
+
w
i
2
,i.e.theweightedcumulativepropor-
tion of the population up to the midpoint of each
individual weight. Following the same authors, C
can be conveniently computed as t he weighted covar-
iance of y
i
and R
i
,i.e.
C =
2
μ
cov
w
(y
i
, R
i
)=
2
Nμ
N
i=1
w
i
(y
i
− μ)(R
i
−
1
2
)
.
Figure 1 Trend in immunization coverage, India.
Lauridsen and Pradhan Health Economics Review 2011, 1:11
/>Page 2 of 6
A straightforward way of decomposing the predicted
degree of inequality into the contributions of explana-
tory factors was proposed by Wagstaff et al. [17]. Adapt-
ing their approach to the present case, where the health
indicator is a binary variable and a logit regression spe-
cification thus applied, amounts to specifying
l(
ˆ
p
i
)=
k
β
k
x
ki
,where
l(
ˆ
p
i
)
is the logit of the predicted
probability of not being fully immunized and b
k
the
logit regression coefficient for the health determinant x
k
.
Given this linear relationship, the concentration index
for
l(
ˆ
p
i
)
can be written as
ˆ
C =
k
β
k
¯
x
k
ˆμ
C
k
,where
ˆμ
is
the mean of
l(
ˆ
p
i
)
,
¯
x
k
the mean of x
k
and C
k
the concen-
tration index of x
k
(defined analogously to C).
While b
k
measures the relationship between the health
determinant x
k
and the logit
l(
ˆ
p
i
)
, a more intuitive
expression of the relationship between the health deter-
minant and the probability p
i
is the marginal effect
m
k
= λ(
k
β
k
¯
x
k
)β
k
,wherel() is the logit density func-
tion. Specifically, m
k
expresses the average change in the
probability of not being fully immunized w hen the
health determinant x
k
changes one unit.
In order to assess sampling variability and to obtain
standard errors for the estimated quantities, where in
particular the concentration indices and the contribu-
tions, i.e. the
β
k
¯
x
k
ˆμ
C
k
parts, cause troubles, we apply a
“ bootstrap” procedure [18,19] in a five-step manner
much similar to van Doorslaer and Koolman [20]: First,
sample size is inflated to allow for differences in sam-
pling probability by dividing the sampling weights with
the smallest weight and rounding to nearest integer.
Second, from this expanded sample a random sub-sam -
pleofthesizeoftheoriginalsampleisdrawnwith
replacement. Third, the entire set of calculations as spe-
cified above are performed o n this sample. Fourth, this
whole process is repeated 1,000 times, each leading to
replicate estimates. Fifth, using the obtained 1,000 repli-
cates, standard deviations and t statistics can be
computed.
Data
Data from National Family Health Survey-3, 2005-06
[21]hasbeenusedinthisstudy.Inadditionforstate
specific covariates da ta from Census 2 001, Central Sta-
tistical Organisation and National Sample Survey 61st
round on consumer expenditure, 2004-05 [22] are used.
The National Family Health Survey-3 collected informa-
tion on vaccination for all living children born in the
five years preceding the survey. Information was col-
lected from mothers for children born since 1 January,
2000 (in states that began fieldwork in 2005) and since
1 January 2001 (in states that began field work in 2006).
If a card was available, the interviewer was required to
carefully copy the dates on which the child received vac-
cinations against each disease. For vaccination not
recorded on the card, the mother’s report that the vacci-
nation was or was not given was recorded. If the mother
could not show a vaccination card, she was asked
whether the child had received any vaccinations. If any
vaccinations had been received, the mother was asked
whether the child had received a vaccination against
tuberculosis (BCG); diphtheria, whooping cough (pertus-
sis), and tetanus (DPT); poliomyelitis (polio); and
measles. For DPT and polio, information was obtained
on the number of doses of the vaccine given to the
child. Mothers were not asked the dates of vaccinations.
To distinguish Polio 0 (polio vaccine given at the time
of birth) from Polio 1 (polio vaccine given about six
weeks after birth), mothers were also asked whether the
first polio vaccine was given just after birth or later.
A binary outcome variable was calculated, namely
whether or not each of the live born child aged 12-23
months received all recommended doses of vaccination
or not (child fully immunized = 0; child not fully immu-
nized = 1) (endnote c). For the core analysis we consid-
ered child not fully immunized as a dependent variable
to standardize the interpretation. Two sets of indepen-
dent variables (household/individual and state specific)
are considered f or decomposition analysis. The house-
hold/individual covariates consist of economic status
(poor/non poor), educat ion of mother (illiterate/literate),
caste (scheduled caste/tribe (SC/ST)/non scheduled
caste/tribe), residence (rural/urban), sex of the child
(male/female), and birth order (birth order < 3, birth
order 3 or more).
The state specific variables for decomposition analysis
included: poverty ratio, per-capita s tate domestic pro-
duct, income inequality measured in terms of Gini coef-
ficient, % o f public health spending of the total health
spending, % of illiterate, and % of scheduled tribe/sched-
uled caste population.
In the National Family Health Survey-3, an index of
economic status (wealth quintile) for each household
was constructed using principal components analysis
based on data from 109041 households. The wealth
quintiles distribution was generated by applying princi-
pal components analysis on 33 household assets (end-
note d). The wealth quintile distribution was used to
determine poor-rich household for subsequent
modelling.
For the decomposition analysis, quintiles 1 and 2, and
quintiles 3, 4, and 5 were grouped together. This pro-
ducedabinaryvariablelabelled‘po or economic status’,
Lauridsen and Pradhan Health Economics Review 2011, 1:11
/>Page 3 of 6
including households in the bottom 40% of economic
status. Mother’s education was a categorical variable
with the following four levels: illiterate, primary school,
guidance/high school, university. For decomposition
analysis, mother’s illiteracy-a binary variable- was used.
Finally, the decompositionanalysisisconfinedto
twelve possible socio-economic determinants including
both household/individual and state specific variables
that could explain the maximum dimension of socioeco-
nomic inequality particularly in developing countries
like India. The predictor variables of interest are i) poor
economic status, ii) mother is illiterate, iii) residence in
rural area, iv) sex of the child (male), v) b irth order of
the child (birt h order 3 or more) and vi) belong to
scheduled caste/scheduled tribe vii) poverty ratio, viii)
per-capita state domesti c product, ix) income inequality
measured in terms of Gini coefficient, x) % of public
health spending of the total health spending, xi) % of
illiterate, and xii) % of scheduled tribe/scheduled caste
population.
To take care of the non-equal probabilities of selection
in different domains, a design weight was applied. The
national level weight for women is calculated as,
W
wi
=
W
Di
R
Hi
∗ R
Wi
;whereW
Di
is the household design
weight for the i
th
domain is the inverse of the sampling
fraction for the i
th
domain (f
i
=n
i
/N
i
); R
Hi
is the
response rate of the household interviewed; R
Wi
is the
response rate of the women interviewed. After adjust-
ment for non response, the weights are normalized so
that total number of weighted cases is equal to the total
number of un-weighted cases.
Results
Table 1 presen ts mean values and concentration indices
of the variables selected for the study together with
regression coefficients and percentage contributions to
inequality in immunization of the covariates. From the
column of means, it is seen that about 56 percent of the
children aged 12-23 months are not fully immunized in
India. Furthermore, 47 percent of the children belong to
poor household economic status, and a similar propor-
tion of children have mothers who are illiterate. A
majority of the children come from rural area (74
percent).
The second column of Table 1 presents concentration
indices for both dependent and predictive variables,
which provide insights on the poor-rich distributions of
immunization and the socio-economic determinants.
Thus, the CI value for a child not fully immunized is
-0.15021at the national level which indicates that immu-
nization practice favors children from relatively weal-
thier families. Furthermore, it is seen that illiteracy of
mothers, living in rural areas, belonging to scheduled
cast or tribe and high birth order concentrates among
the poor.
Estimated marginal effects from the regression analysis
are presented in the third column of Tabl e 1. The mar-
ginal effects indicate the association between the deter-
minants and child health outcome indicator. The
relationship between wealth and immunization coverage
is evident, as children from families with poor economic
status have a 59 percent higher risk of not being fully
immunized. Likewise, being a child of an illiterate
mother increases the risk of not being fully immuni zed
Table 1 Means, concentration indices, marginal effects and contributions of covariates to inequality in immunization
(N = 9582)
Variable Mean
a
Conc. index Marginal effect % Contribution
Child not fully immunized 0.564581 -0.15021*** (dep. var.) (dep. var.)
Male child 0.532337 0.02277*** -0.13244*** 0.4188***
Poor economic status 0.470733 -0.52949*** 0.58956*** 38.3175***
Mother is illiterate 0.477565 -0.32651*** 0.85115*** 34.6133***
Rural areas 0.738685 -0.17232*** 0.08682*** 2.8811***
Belong to Scheduled caste/tribe 0.302047 -0.24674*** 0.08780*** 1.7066***
Birth order 3 or more 0.407287 -0.20537*** 0.35583*** 7.7622***
Poverty Ratio 28.96984 -0.06000*** -0.01329*** -6.0251***
Per capita state domestic product 16433.14 0.47684*** -0.0001*** 14.3303***
Income inequality (Gini Coeff) 0.329272 0.01622*** 0.26994 -0.3760
% of public health spending of the total health spending 16.45547 0.04674*** 0.01283*** -2.5741***
% of illiterate 36.66706 -0.05095*** 0.02086*** 10.1626***
% of Scheduled Caste/Scheduled Tribe population 24.43076 -0.02818*** -0.00678*** -1.2171***
Notes:
a
: Means are weighted with population weights For concentration indices, regression coefficients and contributions, figures significantly different from zero is
marked with *** (1 percent level), ** (5 percent level) and * (10 percent level).
The % contribution expr esses the contribution in percentage of Ĉ.
Lauridsen and Pradhan Health Economics Review 2011, 1:11
/>Page 4 of 6
with 85 percent, while the risks are 8 percent higher for
children in rural areas, 35 perc ent higher for children of
birth order 3 or more. Furthermore, percentage of pub-
lic health spending of total health spending and percen-
tage of illiterate population at the state level are
positively related with the child health outcome
indicator.
Finally, the last column of Tabl e 1 presents the
decomposition analysis of socio-economic inequalities in
full immunization coverage. It is seen that the poor
household economic status contributes about 38 percent
of the total socioeconomic inequalities in child immuni-
zation. A major contributor is mother’s illiteracy which
contributes almost 34 percent to the inequality of
immunization. Other important contributors are per-
capita state domestic product and % of illiterate at the
state level which contribute with 14 and close to 10 per-
cent respectively. The result furthermore indicates that
public health spending, income inequality and % of
scheduled caste and scheduled tribe at the state level
play less important role in determining the scale of
health inequality in terms of child immunization.
To summarize, mo st predictable socioeconomic
inequalities seem to arise from four socio-economic pre-
dictors: poverty itself, illiteracy of mothers, per-capita
state domestic product and % of illiterate person at the
state level.
Discussion and conclusions
The study presents - to our knowledge - first time evi-
dence on the composition of socioeconomic inequality
in child health care in India in terms of children not
being fully immunized. Decomposition results reveal
that poor household economic status, mother’s illiteracy,
state domestic product and level of illiteracy at the state
level contribute with about 97 percent of the total socio-
economic inequalities in full immunization coverage at
the national level. Of these determinants, m other’s illit-
eracy stands out with a contribution of about 34 per-
cent. Furthermore, decomposition analysis of the
determinants of health inequalities based on state level
data, shows that neither income inequality nor the pub-
lic share of health spending are significant determinant s
of health inequalities but per-capita state domestic pro-
duct and % of illiterate population explains about 24%
of the total health inequalities in full immunizat ion
coverage.
Policy implications of these result s may be that health
intervention strategies aiming at reducing socioeco-
nomic inequality in immunization coverage could help-
fully benefit from being supplemented with strategies
aiming at reducing poverty and illiteracy in particular.
Finally, intensive community level analysis is required to
understand the pathways of health inequalities in full
immunization coverage at the state level.
Endnotes
a. Numerous studies have examined the effects of
socioeconomic status on child health or mortality
using cross-sectional data. However, few of them have
extended their findings to characterize levels of
inequality, using either rate ratios or, especially, more
sophisticated measures of inequality. Additional com-
plications of extracting informationontrendsinsocio-
economic inequalities in health from cross sectional
studies are that the specific measures of socioeconomic
status often differ across studies, as do the number
and type of other variables that are held constant
[10,5,23].
b. Cleland et al. [24] found that disparities in child
survival by socioeconomic status and maternal educa-
tion did not narrow from the 1970s to the 1980s in a
dozen of developing countries. Wagstaff’s [6] re analysis
of the result from the number of studies showed that
inequality in under-five mortality increased in Bolivia,
from 1994 to 1998, in Vietnam from 1993 to 1998 [25],
and in Uganda from 1988 to 1995 [26].
c. Fully Immunized involves received BCG, three doses
of DPT and Polio, and measles vaccines.
d. The 33 household asset variables are household
electrification; type of windows; drinking water source;
type of toilet facility; type of f looring; material of exter-
ior walls; type of roofing; cooking fuel; house ownership;
number of household members per sleeping room; own-
ership of a bank or post-office account; and ownership
of a mattress, a pressure cooker, a chair, a cot/bed, a
table, an electric fan, a radio/transistor, a black and
white television, a colour television, a sewing machine, a
mobile telephone, any o ther telephone, a com puter, a
refrigerator, a watch or clock , a bicycl e, a motorcycl e or
scooter, an animal-drawn cart, a car, a water pump, a
thresher, and a tractor.
Author details
1
Institute of Public Health - Health Economics, University of Southern
Denmark, Denmark
2
Department of Humanities and Social Sciences, National
Institute of Technology, Rourkela, Orissa, India
Authors’ contributions
JP carried out the data collection, drafted the study, wrote the background
section and contributed to the results section. JL did the statistical analysis,
wrote the methods section and contributed to the results section. Both
authors read and approved the manuscript.
Competing interests
The authors declare that they have no competing interests.
Received: 14 March 2011 Accepted: 5 August 2011
Published: 5 August 2011
Lauridsen and Pradhan Health Economics Review 2011, 1:11
/>Page 5 of 6
References
1. World Health Organisation: The World Health Report 2000: Health
Systems: Improving Performances. Geneva: WHO; 2000.
2. Kruk ME, Prescott MR, Pinho H, Galea S: Equity and the child health
Millennium Development Goal: the role of pro-poor health policies. J
Epidemiol Community Health 2011, 65:327-333.
3. Baker JL, van der Gaag J: Equity in health care and health care financing:
evidence from five developing countries. In Equity in the Finance and
Delivery of Health Care: An International Perspective. Edited by: van Doorslaer
E, Wagstaff A and Rutten F. NY: Oxford University Press; 1993:.
4. Gwatkin DR: Health inequalities and the health of the poor: What do we
know? What can we do? Bull the World Health Organ 2000, 78:3-17.
5. Leon DA, Walt G: Poverty, inequality and health: an international
perspective. Oxford: Oxford University Press; 2001.
6. Wagstaff A: Inequalities in health in developing countries: swimming
against the tide? Washington DC: World Bank. Policy Research Working
Paper 2795; 2002.
7. Wagstaff A: Poverty and health sector inequalities. Bull the World Health
Organ 2002, 80:97-105.
8. Braveman P: Monitoring Equity in Health: A Policy Oriented Approach in
Low and Middle Income Countries. Equity Initiative, Paper No. 3 (WHO/
CHS/HSS/98.1) Geneva: WHO; 1998.
9. Starfield B: State of the art in research on equity in health. J Health Polit
Policy Law 2006, 31:11-32.
10. Wagstaff A: Socioeconomic inequalities in child mortality: comparisons
across nine developing countries. Bull World Health Organ 2000, 78:19-29.
11. Wagstaff A, Watanabe N: Socioeconomic inequalities in child malnutrition
in the developing world. Policy Research Working Paper 2434, Development
Research Group Washington DC: World Bank; 2000.
12. Chandra R, Srivastava VK, Nirupam S: Impact of urban basic services on
immunization coverage in a slum area of northern India. Asia Pac J Public
Health 1993, 6:153-155.
13. Suresh K, Saxena D: Trends and determinants of immunization coverage
in India. J Indian Med Assoc 2000, 98:10-14.
14. Sekhar C, Jayachandran V: Immunization coverage in India, 1991-2001:
multiple indicator surveys vis-à-vis focused surveys. In Human Rights and
Social Policies for Children and Women: The Multiple Indicator Cluster Surveys
(MICS) in Practice. Edited by: Alberto M, Enrique D, Marina K. NY: The New
School University; 2005:.
15. Wagstaff A, Paci P, van Doorslaer E: On the measurement of inequalities
in health. Soc Sci Med 1991, 33:545-557.
16. Kakwani NC, Wagstaff A, van Doorslaer E:
Socioeconomic inequalities in
health: measurement, computation and statistical inference. J Econom
1997, 77:87-104.
17. Wagstaff A, van Doorslaer E, Watanabe N: On decomposing the causes of
health sector inequalities, with an application to malnutrition
inequalities in Vietnam. J Econom 2003, 112:219-227.
18. Efron B, Tibshirani RJ: An Introduction to the Bootstrap. London: Chapman
& Hall; 1993.
19. Deaton A: The Analysis of Household Surveys: A Microeconometric
Approach to Development Policy. Baltimore: John Hopkins University
Press; 1997.
20. Doorslaer E, Koolman X: Explaining the differences in income related
health inequalities across European countries. Health Econ 2004,
13:609-628.
21. National Family Health Survey: National Family Health Survey (NFHS-3).
Maryland: International Institute for Population Sciences and ORC Macro;
2005.
22. National Sample Survey Organisation: Consumer expenditure survey 61st
round. New Delhi: Central Statistical Organisation; 2007.
23. Yiengprugsawan V, Lim LLY, Carmichael GA, Sidorenko A, Sleigh AC:
Measuring and decomposing inequity in self-reported morbidity and
self-assessed health in Thailand. Int J Equity Health 2007, 6:23(17 pages).
24. Cleland J, Bicego G, Fegan G: Socioeconomic inequalities in childhood
mortality: the 1970s to the 1980s. Health Transit Rev 1992, 2:1-18.
25. Wagstaff A, Nguyen NN: Poverty and survival prospects of Vietnamese
children under Doi Moi. In Economic Growth, Poverty and Household
Welfare: Policy Lessons from Vietnam. Edited by: Glewwe P, Agrawal N, Dollar
D. Washington DC: World Bank; 2003:.
26. Stecklov G, Bommier A, Boerma T: Trends in equity in child survival in
developing countries: An illustrative example using Ugandan data.
Conference paper New York: Population Association of America Annual
Meeting; 1999.
doi:10.1186/2191-1991-1-11
Cite this article as: Lauridsen and Pradhan: Socio-economic inequality of
immunization coverage in India. Health Economics Review 2011 1:11.
Submit your manuscript to a
journal and benefi t from:
7 Convenient online submission
7 Rigorous peer review
7 Immediate publication on acceptance
7 Open access: articles freely available online
7 High visibility within the fi eld
7 Retaining the copyright to your article
Submit your next manuscript at 7 springeropen.com
Lauridsen and Pradhan Health Economics Review 2011, 1:11
/>Page 6 of 6