Báo cáo hóa học: " Morphology-dependent field emission properties and wetting behavior of ZnO nanowire arrays" docx
Bạn đang xem bản rút gọn của tài liệu. Xem và tải ngay bản đầy đủ của tài liệu tại đây (773.87 KB, 8 trang )
NANO EXPRESS Open Access
Morphology-dependent field emission properties
and wetting behavior of ZnO nanowire arrays
Lujun Yao
1
, Maojun Zheng
1,2*
,LiMa
3
, Wei Li
3
, Mei Li
3
, Wenzhong Shen
1,2
Abstract
The fabrication of three kinds of ZnO nanowire arrays with different structural parameters over Au-coated silicon
(100) by facile thermal evaporation of ZnS precursor is reported, and the growth mechanism are proposed based
on structural analysis. Field emission (FE) properties and wetting behavior were revealed to be strongly
morphology dependent. The nanowire ar rays in sm all diameter and high aspect ratio exhibited the best FE
performance showing a low turn-on field (4.1 V/μm) and a high field-enhancement factor (1745.8). The result also
confirmed that keeping large air within the films was an effective way to obtain super water-repellent properties.
This study indicates that the preparation of ZnO nanowire arrays in an optimum structural model is crucial to FE
efficiency and wetting behavior.
Introduction
ZnO has been considered as one of the most important
electronic and photonic material because of its wide
direct bandgap (3.37 eV) and large exciton binding
energy (60 meV). Extensive researches have been devel-
oped on the growth of quasi one-dimensional (1D) ZnO
nanostructures [1,2] including nanowires, nanotubes,
nanobelts, and nanoneedles. Meanwhile, these 1D ZnO
nanostructures have been widely applied a s room tem-
perature UV detector [3], transparen t conductive elec-
trodes [4], sensors [1,5-7], and solar cells [8]. Recently,
various inorganic semiconductor nanostructures have
been the focus of the researches on the studies of FE
properties [9] and wetting behavior [10], including the
well-aligned 1D ZnO nanostructured arrays which have
attracted great attention as promising field emission
(FE) sources [1,11-14] due to their negative electron affi-
nity [15], chemical stability, tip geometry, or apex struc-
ture. A crucial factor to influence FE performance
includes the interspac ing between individual nanowires
or nanorods, and aspect ratio. The manner in which
these structural parameters could be controlled during
self-organized growth processes has developed into a
challenging and technological problem for nanostructure
fabrication. Too closely and too densely spaced nanos-
tructures are both not favorable to construct FE nanode-
vices. On the other hand, another significant application
of ZnO related to the geometric effects is the wettability
[16,17], which might bring great advantages in a wide
variety of applications in daily life, industry, and agricul-
ture. The vertically aligned nanostructures involving a
large amount of trapped air within the films and their
high roughness have been proved to be potential for the
building of hydrophobic surfaces, various surfaces of
ZnO nanostructured arrays showing lotus-like water-
repellent properties have been prepared in the past
years [16,18,19].
However, many previous efforts in the large-scale
fabrication of ZnO nanowire or nanorod arrays have
been achieved by physical evaporation of the mixture
of ZnO and graphite powders, chemical vapor
deposition using Zn powder as the s ourc e materials, or
low-temperature hydrothermal synthesis with the pre-
prepared colloidal ZnO nanocrystals as the grown
seeds. In this article, a novel fabrication of ZnO nano-
wire arrays with different structural parameters over
Au-coated silicon (100) by facile thermal evaporation
of ZnS precursors i s reported. The nanowire diameter
and growth speed were controlled by changing the
thickness of coated Au film layer together with
substrate locations. The authors studied the morphol-
ogy-dependent FE performance, and first revealed that
wetting behavior of ZnO nanowire arrays in different
* Correspondence:
1
Laboratory of Condensed Matter Spectroscopy and Opto-Electronic Physics,
Department of Physics, Shanghai Jiao Tong University, Shanghai 200240,
People’s Republic of China.
Full list of author information is available at the end of the article
Yao et al. Nanoscale Research Letters 2011, 6:74
/>© 2011 Yao et al; licensee Springer. This is an Open Access article distributed under the terms of the Creative Commons Attribution
License ( which permits unrestricted use, distribution, and reproduction in any medium,
provided the original work is properly ci ted.
void ratios, which confirmed that a large amount of air
kept within the films would be an effective way to
obtain super water-repellent properties.
Experimental
The fabrication was performed using a two-end open
quartz tube connected to a rotary vacuum pump and a
gas inlet through a vacuum coupling. The silicon (100)
substrates prepared for samples A, B, and C were soni-
cated in acetone, washed with de-ionized (DI) water,
and dried with nitrogen. Then, Au film layers we re
deposited on these substrates by ion sputtering from the
Au target (99.999%) using an ion sputter coater (Hitachi
E-1045, Hitachi Co., Tokyo, Japan.). The target-substrate
distance was about 30 mm, and the pressure of sputter-
ing chamber was pumped down to 6 Pa before deposi-
tion. The coating rate depending on discharge current
was kept at 6 nm/min. The three kinds of above-men-
tioned substrates were sputtered for 50, 50, and 15 s,
respectively. The corresponding thicknesses of Au film
layers are about 50, 50, and 15 Å. Growth procedures
were conducted by thermal evaporation of commercially
available high purity ZnS powder and graphite powder
with equal molar ratio, which was placed at the center
of the quartz tube furnace. Silicon substrates were
placed downstream about 5 cm (samples B and C) and
upstream about 5 cm (sample A) away from the source
materials to collect the products. Subsequently, we
introduced an Ar gas flow of 80 sccm, and a fixed pres-
sure at about 150 Torr was applied. The tube furnace
was then heated to 750°C quickly and maintained at this
peak for 30 min. After it cooled down naturally to room
temperature, all the substrates appeared dark g ray indi-
cating the deposition.
The morphology and crystal structures were character-
ized by field emission scanning electro n microscope (FE-
SEM, Philips Sirion 200) and X-ray diffractometer (Bru-
ker-AXS system) with Cu Ka rad iation (l = 1.5406 Å).
The surface chemical composition of these ZnO nano-
wire arrays was analyzed by XPS (Kratos AXIS Ultra
DLD) with a power of 150 W. A monochromatic Al Ka
X-ray source (1486.6 eV) was operated in a constant ana-
lyzer energy mode. Water contact angle (CA) and sliding
angle were measured using an optical contact-angle
meter system (Data Physics Instrument GmbH,
Germany) at ambient temperature. FE properties were
carried out employing a two-parallel-plate configuration
in an ultrahigh vacuum c hamber (5 × 10
-7
Pa). In brief,
samples were stuck on to a stainless-steel sample stage
using conducting glue to act as the cathode, while
another parallel stainless steel plate served as the anode
with a fixed ca thode-anode distance of 300 μm. The
emission current was monitored via a Keithley 485
picoammeter.
Results and discussions
Structural and compositional characterization of ZnO
nanowire arrays
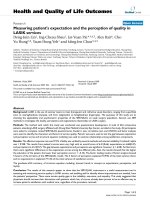
Figure 1 shows the X-ray diffraction patterns used to
assess the overall structure and phase purity. All posi-
tions of the peaks can be readily indexed to the hexago-
nal wurtzite ZnO with lattice constants a =3.25Åand
c = 5.21 Å (JCPDS card No. 80-0075). In particular, we
can see that (002) peak located at about 34.4° is much
stronger than the others for all of the three samples,
which means these nanowire arrays have a preferential
orientations in the c-axis direction. Moreover, it is
clearly seen that the peak intensity of sample B is the
strongest among the three products, whereas the sample
A has the weakest peak intensity. The reason can be
attributed to ZnO film thickness as well as their void
ratios, which can be obtained from Table 1. The sample
B which has a thick film with small void ratio shows
higher peak intensity than the other two samples.
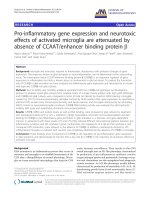
The surface chemical composition of all the three
ZnO nanowire arrays have been characterized by means
of XPS to detect any trace of impurities in the samples
and to assess the vertical compositional homogeneity, as
SampleA
2
03040506
0
(002)
(100)
(101)
(102)
2Theta
(
de
g
ree
)
SampleB
SampleC
Figure 1 XRD patterns of the three k inds of ZnO nanowire
arrays.
Yao et al. Nanoscale Research Letters 2011, 6:74
/>Page 2 of 8
shown in Figure 2. The insets are the high resolution
spectra recorded for the Zn and O regions. Binding
energies were calibrated with respect to the signal for
adventitious carbon with binding energy of 284.6 eV.
The respectiv e binding energies of Zn 2p
3/2
and Zn
2p
1/2
are all recorded with the peaks at 1021.7 and
1044.8 eV (sample A), 1021.6 and 1044.8 eV (sample B),
1021.7 and 1044.9 eV (sample C). The photoelectron
spectra of O 1s in the as-prepared three samples were
located at 530.6, 530.4, and 530.5 eV, respectively. The
binding energies of the three samples are similar and in
total agreement with the standard values of ZnO. The
above XRD and XPS results revealed that our prepara-
tion method supp lied pure surface compositions of all
the three ZnO products, not as the same as the wet che-
mical approaches induced doping type in ZnO nanos-
tructures [20,21].
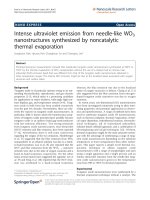
Figure 3 presents the quite characteristic morphologies
of the three kinds of ZnO nanowire arrays, which pre-
sent the tilted (the up panel) and their corresponding
cross-sectional (the below panel) FE-SEM images of
samplesA,B,andC,respectively.Thewell-aligned
nanowires of samples A and B are shown in large-scale,
every single nanow ire was self-aligned perpendicular to
the silicon substrates, and there was no bending or
interconnects between themselves. For the sample C,
some of ZnO nanowires with small diameters with high
aspect ratios are too weak to be st anding up, leading to
a little inclined morphology. The detailed structural
parame ters of sa mples A, B, and C are listed in Table 1.
Thei r average diamet ers are about 300, 600, and 80 nm,
and the corresponding lengths are 6, 25, and 25 μm,
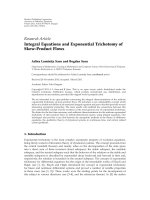
respectively. The resultant diameters and lengths in dif-
ferent sizes could be attributed to the thicknesses of Au
thin films as well as the substrate locations (shown in
Figure 4a). An underlying mechanism for morphology
derivation and evolution of 1D nanostructures has been
elucidated along with the advancement of preparation
methods and several models that have been proposed in
the previous study [22]. Here, the growth mechanism of
ZnO nanowire arrays using ZnS precursor was involved
based on the conventi onal vapor-liquid-solid (VLS)
using metal catalyst as a starting material [23,24], and
the schematic diagram is shown in Figure 4b. The
growth stages might be briefly described as follows. Au
film layers coated on Si substrates would crack to A u
Table 1 The structural parameters of the three kinds of nanowire arrays
Sample Diameter (nm) Length (μm) Aspect ratio Density (μm
-2
) Void ratio (%) E
to
(V/μm) b CA
A 300 6 20 1.3 90.8 8.4 1209.5 142.1 ± 1°
B 600 25 41.7 0.57 83.9 5.8 1566.7 94.8 ± 1°
C 80 25 312.5 4.2 97.9 4.1 1745.8 154.3 ± 1°
0 200 400 600 800 1000 1200
0.0
2.0x10
4
4.0x10
4
6.0x10
4
8.0x10
4
1.0x10
5
525530535540
O 1s
1020 1035 1050
Zn 2p
3/2
Zn 2p
1/2
Intensity (C/s)
Binding Energy (eV)
Zn 3p
Zn 3d
Zn 3s
C 1s
Zn (LMM)
O 1s
Zn (LMM)
O (KLL)
Zn 2p
3/2
Zn 2p
1/2
Zn 2s
(a)
0 200 400 600 800 1000 1200
0.0
5.0x10
4
1.0x10
5
1.5x10
5
2.0x10
5
525 530 535 540
O 1s
1020 1040 1060
Zn 2p
3/2
Zn 2p
1/2
Zn 2s
Zn 2p
1/2
Zn 2p
3/2
O (KLL)
Zn (LMM)
O 1s
Zn (LMM)
C 1s
Zn 3s
Zn 3p
Zn 3d
Intensity (C/s)
Binding Energy (eV)
(
b)
(c)
0 200 400 600 800 1000 1200
0.0
2.0x10
4
4.0x10
4
6.0x10
4
8.0x10
4
1.0x10
5
525 530 535 540
O 1s
1020 1040 1060
Zn 2p
3/2
Zn 2p
1/2
Zn 2s
Zn 2p
1/2
Zn 2p
3/2
O (KLL)
Zn (LMM)
O 1s
Zn (LMM)
C 1s
Zn 3s
Zn 3p
Zn 3d
Intensity (C/s)
Bindin
g
Ener
gy
(
eV
)
Figure 2 X-ray photoelectron spectra of the as-prepared ZnO
nanowire arrays. (a) sample A, (b) sample B, and (c) sample C. The
insets are the corresponding Zn 2p and O 1s spectra.
Yao et al. Nanoscale Research Letters 2011, 6:74
/>Page 3 of 8
nanoparticles with an elev ated temperature and serve as
catalyst, and it reacted with ZnS vapor to form Au-Zn-S
alloyliquiddroplets.Thealloyliquiddropletscould
absorb oxygen atoms, or react with oxygen atoms from
air to yield ZnO molecules. Consequently, the formation
of ZnO may be expressed by the corresponding chemi-
cal reaction [24]
ZnS g O g ZnO s SO g() () () ()+↔ +
22
(1)
Figure 4c shows the top-view SEM images of
Au-coated silicon substrates after annealing at 750°C for
30 min in the absence of source materials, but with the
other experimental conditions unchanged. The Au film
layer melted into separated nanoparticles with different
sizes evenly distributed on the surface of Si substrates,
which are about 200-300 nm in diameter for the sam-
ples A and B, but only about 40-50 nm for the sample
C. It illustr ates that thicker Au film layer leads to larger
3ʅm
3ʅm
6 ʅm
3ʅm
6ʅm
3ʅm
Figure 3 The tilted and cross-sectional (in the corresponding below panel) FE-SEM images of (a) sample A, (b) sample B , and (c)
sample C.
(c)
sample A
sample B
sample C
Figure 4 The growth of ZnO nanowire arrays. (a) The schemat ic diagram of experimental setup, (b) growth mechanism of ZnO nanowire
arrays, and (c) top-view SEM images of Au catalyst on Si substrates after annealing at 750°C for 30 min in the absence of source materials. The
Au film thicknesses of samples A, B and C are about 50, 50, and 15 Å, respectively. The scale bars are all 1 μm.
Yao et al. Nanoscale Research Letters 2011, 6:74
/>Page 4 of 8
Au nanoparticles during the initiated growth process, in
agreement with the previous study [14]. According to
the VLS growth mechanism, the nanowire’sdiameteris
defined by the Au nanoparticle’s diameter, which was
observedbythefactthatthesampleBwithAufilm
layer about 5 0 Å has the nanowire with larger diameter
than that of the sample C coated with Au film of 15 Å.
However, diameters of all these nanowires were
observed to be larger than the corresponding Au nano-
particle sizes because of the coarsening effect resulting
from the formation of a supersaturated Au-Zn-S alloy
liquid droplets. However, the sample A was located
upstream, although it ha s the same Au nanoparticle size
formed during the initiated growth as sample B, the
captured ZnS vapor would be less than that located in
the downstream, leading to insufficiency of zinc vapor
so that the growth speed was decreased and the coar-
sening effect would not be remarkable.
FE properties
The FE properties were measured on the three kinds of
ZnO nanowire arrays with different structural para-
meters. They were measured one after the other under
exactly the same conditions. Figure 5a, c, e depicts the
morphology-dependent emission current density J on
theelectricfieldE at cathode-anode distance of 300 μm
for all the measurements. For the sample C, the turn-on
field (E
to
) defined as the electric field required for reach-
ing emission current density to 0.1 μA/cm
2
(0.001 μA/
mm
2
)is4.1V/μm. It is lower than those of ZnO nanor-
ods (5.3 V/μm) [25] and ZnO nanotubes (7.0 V/μm)
[26], whereas for the samples A and B they are about
8.4 and 5.8 V/μm, respectively. The E
to
values can be
clearly read from their corresponding insets. For further
understanding of FE current-voltage characteristics, it is
demonstrated by the Fowler-Nordheim (F-N) equation
[27-29]
JAE B E=−
−
( / )exp[ ( ) ]
22 32 1
ΦΦ
(2)
ln( / ) ln( / ) /JE A B E
22 32
=−
ΦΦ
(3)
where J and E are the current density, and th e applied
electric field, respectively. F is the wo rk function of
emitting materials. A and B are constants with the
values of 1.56 × 10
-10
AeV/V
2
and 6.83 × 10
3
eV
-3/2
/μm.
Figure 5b, d, f presents that the F-N lines are all have
nearly linear relationship, indicating that the electron
emission is indee d caused by a vacuum tunneling. b is
the field-enhancement factor defined as the ratio of the
local electric field at the tip of a nanowire to the macro-
scopic electric field, can be estimated from the slope of
F-N plots. Assuming the work function of bulk Z nO to
be 5.3 eV, the estimated b of the samples A, B, and C
are 1209.5, 1566.7, and 1745.8, respectively. Based on
the above discussions, it can be seen that the sample C
has the best FE efficiency including the lowest E
to
and
the highest b.
Many former studies have demonstrated that FE per-
formance of ZnO nanostructured arrays can be signifi-
cantly enhanced through either changing geometry
configuration, achieving rational spatial distri bution of
the emitting centers, or increasing the aspect ratio
[13,14,30]. The relationship of b andaspectratiol/r is
proposed by an empirical model [31]
=+ −−bl r h as l( / ) [ exp( / )]
.09
1
(4)
where l, r,ands are the length, radius, and the inter-
spacing of ZnO nanowires, respectively; h is an alter-
able parameter which can be adjusted to fit the
experimental data. It is obvious that the field-enhance-
ment factor b can be decided by the aspect ratio and
the interspacing of nanowires. The sample C has the
nanowires up to 25 μm in length but only tens of
nanometres in diameter; the aspect ratio as high as
312.5 could explain for its excellent FE properties.
However, the aspect ratios of the samples A and B are
20 and 41.7, respectively, indicating that b is not line-
arly increasing with the aspect ratio, which could be
attributed to the screening effect. From the experimen-
tal results, it can be observed that the E
to
and b values
were all not proportional to their nanowire densities
(revealed in Table 1), we could conclude that nanowire
density was not the essence in deciding the FE effi-
ciency of nanostructured arrays, and that it was indis-
pensable to consider the aspect ratio including the tip
morphology and the rela tive void ratio.
Wetting behavior
Wettability was studied by examining water CA on the
surfaces of three kinds of ZnO nanowire arrays. Photo-
graphs of water droplet on the three representative ZnO
films with different surface morphologies are shown in
Figure 6. The DI water droplets of about 5 μLwere
placed on the surfaces, and the CAs of the samples A
and B were measured to be about 142.1° and 94.8°,
respectively. However, nearly spherical droplet at the
microscopic level with a measured CA value as high as
154.3° in average was obtained for the sample C, which
reveals the superhydrophobic properties. The surface
presents a stable character in air, with the CA showing
no apparent change for up to 15 min, and the water
droplet eventuall y evaporates on the surface of the ZnO
nanowire quasi-arrays without any obvious sinking into
the film. To investigate their different wetting behaviors,
surface structure-induced transition may be crucial. The
Yao et al. Nanoscale Research Letters 2011, 6:74
/>Page 5 of 8
authors present the corresponding structural models
according to the three samples (shown in Figure 5, the
below panel), which clearly shows the different void
ratios induced by their different diameters and interspa-
cing of the aligned nanowires. Theoretically, a thoro ugh
understanding of the superhydrophobic phenomenon
can be obtained from the Cassie and Baxter equation
[32], and the CA for a composite surface is influenced
greatly by the fractional areas of solid (f
1
)versusair
pockets (f
2
)
cos cos , ( )
=−+=ffff
11212
1
(5)
Here, θ and θ
1
are the corresponding water CAs on
rough and smooth surfaces. Evidently, the CA varies
with the amount of air trapped within the voids among
(c)
0.12 0.18 0.24
-20
-16
-12
-8
ln(J/E
2
)
1/E
(
um/V
)
0.1 0.2 0.3 0.4
-16
-12
-8
-4
ln(J/E
2
)
1/E
(
um/V
)
0.08 0.12 0.16 0.2
0
-20
-16
-12
-8
ln(J/E
2
)
1/E (um/V)
681012
0.00
0.01
0.02
0.03
0.04
0.05
6810
0.000
0.002
0.004
J(uA/mm
2
)
E (V/um)
J(uA/mm
2
)
E (V/um)
468
0.00
0.02
0.04
0.06
0.08
0.10
0.12
456
0.000
0.001
0.002
J(uA/mm
2
)
E (V/um)
J(uA/mm
2
)
E (V/um)
2468
0.0
0.2
0.4
0.6
0.8
1.0
234
0.000
0.001
0.002
J(uA/mm
2
)
E (V/um)
J(uA/mm
2
)
E (V/um)
(a) (b)
(d)
(e)
(f)
Figure 5 FE properties of (a, b) sample A, (c, d) sample B, and (e, f) sample C. The corresponding insets are the magnified parts showing
the E
to
values clearly.
Yao et al. Nanoscale Research Letters 2011, 6:74
/>Page 6 of 8
these nanowire arrays. The nanostructured films with
high void ratio would keep larger fraction of air trapped
within the voids and greatly increase the air/water inter-
face, the effectively cause the increase of water CA. For
the samples A, B, and C, the void ratios are roughly cal-
culated to be about 90.8, 83.9, and 97.9%, respectively,
using the formula: h =(1-Nπ r
2
) × 100%, assuming
that those nanowires for each sample have the same
length and cylindrical shape. Here, N and r, respectively,
represent the density (nanowires/μm
2
) and average
radius of nanowires listed in Table 1. The results
demonstrated a qualitative analysis that larger void ratio
could play an effective approach to increase CA values
for the three sample surfaces which are all ZnO nano-
wire arrays with same preferential orientations in the
c-axis direction. However, decreasing the surface free
energy by coatin g with low surface energy molecules is
also greatly regarded as the other point to obtain super-
hydrophobic surfaces [33,34], even if the void ratio is
not large enough. The sliding behavior of t he sample C
was also performed by fixing the sample on the platform
of OCA CA system, a 5-μL water droplet was dropped
on its surface and the system tilted until the water dro-
plet rolled off. Then a SA of 7.3° in average was
obtained, showing super water-repelle nt properties.
These properties could be used for self-cleaning func-
tions, antifog, or other fields.
Conclusions
Three kinds of large scale ZnO nanowire arrays with
different aspect ratios and v oid ratios were fabricated
using facile thermal evaporation route using ZnS source
materials. Experimental results demonstrated that ZnO
nanowire arrays with larger aspect ratio and proper den-
sity have better FE properties including lower turn-on
field and higher field-enhancement factors. Moreover, a
larger void kept within the nanostructured films was
proved to be important for preparation of super water-
repellent surfaces. This study could be a good platform
to elucidate the physical essence of the FE performance
andwettingbehaviorrelatedtothecorresponding
nanostructured arrays.
Abbreviations
CA: contact angle; DI: de-ionized; FE-SEM: field emission scanning electron
microscope; F-N: Fowler-Nordheim; VLS: vapor-liquid-solid.
Acknowledgements
This study was supported by the Natural Science Foundation of China (Grant
Nos. 10874115 and 10734020), the National Major Basic Research Project of
2010CB933702, Shanghai Nanotechnology Research Project of 0952nm01900,
Shanghai Key Basic Research Project of 08JC1411000, and the Research fund
for the Doctoral Program of Higher Education of China. The authors
sincerely thank Professor D.P Yu and Professor Q. Zhao (the State Key
Laboratory for Mesoscopic Physics, and Electron Microscopy Laboratory,
School of Physics, Peking University) for their help in FE measurements.
Author details
1
Laboratory of Condensed Matter Spectroscopy and Opto-Electronic Physics,
Department of Physics, Shanghai Jiao Tong University, Shanghai 200240,
People’s Republic of China.
2
Key laboratory of Artificial Structures and
Quantum Control (Ministry of Education), Department of Physics, Shanghai
Jiao Tong University, Shanghai 200240, People’s Republic of China.
3
School
of Chemistry & Chemical Technology, Shanghai Jiao Tong University,
Shanghai 200240, People’s Republic of China.
Authors’ contributions
LY participated in the design of the study, carried out the total experiment,
performed the statistical analysis as well as drafted the manuscript. MZ
participated in the design of the study, gived the theoretical and
experimental guidance, performed the statistical analysis, and gave the
corrections of manuscript. LM participated in the design of experimental
section and supplied the help in experiment. WL and ML mainly helped to
carry out the measurement of CA and sliding angles. WS helped to amend
the manuscript and the analysis of FE properties.
Competing interests
The authors declare that they have no competing interests.
Received: 2 August 2010 Accepted: 12 January 2011
Published: 12 January 2011
References
1. Fang XS, Bando Y, Gautam UK, Zhai TY, Zeng HB, Xu XJ, Liao MY,
Golberg D: ZnO and ZnS Nanostructures: Ultraviolet-Light Emitters,
Lasers, and Sensors. Crit Rev Solid State Mater Sci 2009, 34:190.
2. Ji SL, Ye CH: Synthesis, Growth Mechanism, aIld Applications of Zinc
oxide Nanomaterials. J Mater Sci Technol 2008, 24:457.
sampleC
sampleA
sampleB
Figure 6 Photog raphs of the measured CA values of (a) sample A, (b) sample B, and (c) sample C. Str uctural sch ematics are shown in
below panel, respectively.
Yao et al. Nanoscale Research Letters 2011, 6:74
/>Page 7 of 8
3. Li YB, Valle FD, Simonnet M, Yamada I, Delaunay JJ: High-performance UV
detector made of ultra-long ZnO bridging nanowires. Nanotechnology
2009, 20:045501.
4. Hirata GA, McKittrick J, Cheeks T, Siqueiros JM, Diaz JA, Contreras O,
Lopez OA: Synthesis and optelectronic characterization of gallium doped
zinc oxide transparent electrodes. Thin Solid Films 1996, 288:29.
5. Wang HT, Kang BS, Ren F, Tien LC, Sadik PW, Norton DP, Peartona SJ, Lin J:
Hydrogen-selective sensing at room temperature with ZnO nanorods.
Appl Phys Lett 2005, 86:243-503.
6. Park JY, Choi SW, Kim SS: Fabrication of a Highly Sensitive Chemical
Sensor Based on ZnO Nanorod Arrays. Nanoscale Res Lett 2010, 5:353.
7. Chang SJ, Hsueh TJ, Hsu CL, Lin YR, Chen IC, Huang BR: A ZnO nanowire
vacuum pressure sensor. Nanotechnology 2008, 19:095505.
8. Martinson ABF, Elam JW, Hupp JT, Pellin MJ: ZnO Nanotube Based Dye-
Sensitized Solar Cells. Nano Lett 2007, 7:2183.
9. Fang XS, Bando Y, Gautam UK, Ye CH, Golberg D: Inorganic semiconductor
nanostructures and their field-emission applications. J Mater Chem 2008,
18:509.
10. Verplanck N, Coffinier Y, Thomy V, Boukherroub R: Wettability Switching
Techniques on Superhydrophobic Surfaces. Nanoscale Res Lett 2007,
2:577.
11. Zhu YW, Zhang HZ, Sun XC, Feng SQ, Xu J, Zhao Q, Xiang B, Wang RM,
Yu DP: Efficient field emission from ZnO nanoneedle arrays. Appl Phys
Lett 2003, 83:144.
12. Tseng YK, Huang CJ, Cheng HM, Lin IN, Liu KS, Chen IC: Characterization
and Field-Emission Properties of Needle-like Zinc. Oxide Nanowires
Grown Vertically on Conductive Zinc Oxide. Films. Adv Funct Mater 2003,
13:811.
13. Qian XM, Liu HB, Guo YB, Song YL, Li YL: Effect of Aspect Ratio on Field
Emission Properties of ZnO Nanorod Arrays. Nanoscale Res Lett 2008,
3:303.
14. Wang YL, Zhou J, Lao CS, Song JH, Xu NS, Wang ZL: In Situ Field Emission
of Density-Controlled ZnO Nanowire arrays. Adv Mater 2007, 19:1627.
15. Fancher CA, de Clercq HL, Thomas OC, Robinson DW, Bowen KH: Zinc
oxide and its anion: A negative ion photoelectron spectroscopic study.
J Chem Phys 1998, 109:8426.
16. Hosono E, Fujihara S, Honma I, Zhou HS: Superhydrophobic Perpendicular
Nanopin Film by the Bottom-Up Process. J Am Chem Soc 2005, 127:13458.
17. Kwak G, Seol M, Tak Y, Yong K: Superhydrophobic ZnO Nanowire Surface:
Chemical Modification and Effects of UV Irradiation. J Phys Chem C
2009,
113:12085.
18. Badre C, Pauporté T, Turmine M, Lincot D: A ZnO nanowire array film with
stable highly water-repellent properties. Nanotechnology 2007, 18:365705.
19. Sakai M, Kono H, Nakajima A, Zhang XT, Sakai H, Abe M, Fujishima A:
Sliding of Water Droplets on the Superhydrophobic Surface with ZnO
Nanorods. Langmuir 2009, 25:14182.
20. Liu HQ, Piret G, Sieber B, Laureyns J, Roussel P, Xu WG, Boukherroub R,
Szunerits S: Electrochemical impedance spectroscopy of ZnO
nanostructures. Electrochem Commun 2009, 11:945.
21. Sieber B, Liu HQ, Piret G, Laureyns J, Roussel P, Gelloz B, Szunerits S,
Boukherroub R: Synthesis and Luminescence Properties of (N-Doped)
ZnO Nanostructures from a Dimethylformamide Aqueous Solution.
J Phys Chem C 2009, 113:13643.
22. Ye CH, Fang XS, Hao YF, Teng XM, Zhang LD: Zinc Oxide Nanostructures:
Morphology Derivation and Evolution. J Phys Chem B 2005, 109:19758.
23. Wagner RS, Ellis WC: Vapor-Liquid-Solid Mechanism Of Single Crystal
Growth. Appl Phys Lett 1964, 4:89.
24. Yuan HJ, Xie SS, Liu DF, Yan XQ, Zhou ZP, Ci LJ, Wang JX, Gao Y, Song L,
Liu LF, Zhou WY, Wang G: Characterization of zinc oxide crystal
nanowires grown by thermal vaporation of ZnS powders. Chem Phys Lett
2003, 371:337.
25. Dev A, Kar S, Chakrabarti S, Chaudhuri S: Optical and field emission
properties of ZnO nanorod arrays synthesized on zinc foils by the
solvothermal route. Nanotechnology 2006, 17:1533.
26. Wei A, Sun XW, Xu CX, Dong ZL, Yu MB, Huang W: Stable field emission
from hydrothermally grown ZnO nanotubes. Appl Phys Lett 2006,
88:123102.
27. Fang XS, Bando Y, Ye CH, Golberg D: Crystal orientation-ordered ZnS
nanobelt quasi-arrays and their enhanced field-emission. Chem Commun
2007, 3048.
28. Yu T, Shen Z: Metal Oxide Nanostructures from Simple Metal-oxygen
Reaction in Air. J Mater Sci Technol 2008, 24:597.
29. Fang XS, Bando Y, Shen GZ, Ye CH, Gautam UK, Costa PMFJ, Zhi CY,
Tang CC, Golberg D: Ultrafine ZnS nanobelts as field emitters. Adv Mater
2007, 19:2593.
30. Zhang Y, Lee CT: Site-controlled Growth and Field Emission Properties of
ZnO Nanorod Arrays. J Phys Chem C 2009, 113:5920.
31. Patra SK, Rao GM: Field emission current saturation of aligned carbon
nanotube–Effect of density and aspect ratio. J Appl Phys 2006,
100:024319.
32. Cassie ABD, Baxter S: Wettability of Porous Surfaces. Trans Faraday Soc
1944, 40:546.
33. Piret G, Drobecq H, Coffinier Y, Melnyk O, Boukherroub R: Matrix-Free Laser
Desorption/Ionization Mass Spectrometry on Silicon Nanowire Arrays
Prepared by Chemical Etching of Crystalline Silicon. Langmuir 2010,
26:1354.
34. Tian DL, Chen QW, Nie FQ, Xu JJ, Song YL, Jiang L: Patterned Wettability
Transition by Photoelectric Cooperative and Anisotropic wetting for
Liquid Reprography. Adv Mater 2009, 21:1.
doi:10.1186/1556-276X-6-74
Cite this article as: Yao et al.: Morphology-dependent field emission
properties and wetting behavior of ZnO nanowire arrays. Nanoscale
Research Letters 2011 6:74.
Submit your manuscript to a
journal and benefi t from:
7 Convenient online submission
7 Rigorous peer review
7 Immediate publication on acceptance
7 Open access: articles freely available online
7 High visibility within the fi eld
7 Retaining the copyright to your article
Submit your next manuscript at 7 springeropen.com
Yao et al. Nanoscale Research Letters 2011, 6:74
/>Page 8 of 8