báo cáo hóa học: "Measuring patient''''s expectation and the perception of quality in LASIK services" pdf
Bạn đang xem bản rút gọn của tài liệu. Xem và tải ngay bản đầy đủ của tài liệu tại đây (235.96 KB, 8 trang )
BioMed Central
Page 1 of 8
(page number not for citation purposes)
Health and Quality of Life Outcomes
Open Access
Research
Measuring patient's expectation and the perception of quality in
LASIK services
Deng-Juin Lin
1
, Ing-Cheau Sheu
2
, Jar-Yuan Pai*
3,4,5
, Alex Bair
6
, Che-
Yu Hung
7,8
, Yuan-Hung Yeh
1
and Ming-Jen Chou
3,4,5
Address:
1
Institute of Medicine, Chung Shan Medical University, Taichung, Taiwan,
2
Center for General Knowledge Education, Chung Shan
Medical University, Taiwan,
3
Department of Health Policy and Management, Chung Shan Medical University, Taichung, Taiwan,
4
Center for
Education and Research on Geriatrics and Gerontology, Chung Shan Medical University, Taichung, Taiwan,
5
Chung Shan Medical University
Hospital, Taichung, Taiwan,
6
Bair's eye center, Taichung, Taiwan,
7
School of Statistics, Capital University of Economics and Business,Taiwan and
8
StatSoft Holdings, Inc., Taiwan Branch
Email: Deng-Juin Lin - ; ; Jar-Yuan Pai* - ;
Alex Bair - ; Che-Yu Hung - ; Yuan-Hung Yeh - ; Ming-
Jen Chou -
* Corresponding author
Abstract
Background: LASIK is the use of excimer lasers to treat therapeutic and refractive visual disorders, ranging from superficial
scars to nearsightedness (myopia), and from astigmatism to farsightedness (hyperopia). The purposes of this study are to
checking the applicability and psychometric properties of the SERVQUAL on Lasik surgery population. Second, use SEM
methods to investigate the loyalty, perceptions and expectations relationship on LASIK surgery.
Methods: The method with which this study was conducted was questionnaire development. A total of 463 consecutive
patients, attending LASIK surgery affiliated with Chung Shan Medical University Eye Center, enrolled in this study. All participants
were asked to complete revised SERVQUAL questionnaires. Student t test, correlation test, and ANOVA and factor analyses
were used to identify the characters and factors of service quality. Paired t test were used to test the gap between expectation
and perception scores and structural equation modeling was used to examine relationships among satisfaction components.
Results: The effective response rate was 97.3%. Validity was verified by several methods and internal reliability Cronbach's alpha
was > 0.958. The results from patient's scores were very high with an overall score of 6.41(0.66), expectations at 6.68(0.47),
and perceptions at 6.51(0.57). The gap between expectations and perceptions was significant, however, (t = 6.08). Furthermore,
there were significant differences in the expectation scores among the different jobs. Also, the results showed that the higher
the education of the patient, the lower their perception score (r = -0.10). The factor loading results of factor analysis showed
5 factors of the 22 items of the SERVQUAL model. The 5 factors of perception explained 72.94% of the total variance there;
and on expectations it explained 77.12% of the total variance of satisfaction scores.
The goodness-of-fit summary, of structure equation modeling, showed trends in concept on expectations, perceptions, and
loyalty.
Conclusion: The results of this research appear to show that the SERVQUAL instrument is a useful measurement tool in
assessing and monitoring service quality in LASIK service, and enabling staff to identify where improvements are needed, from
the patients' perspective. There were service quality gaps in the reliability, assurance, and empathy. This study suggested that
physicians should increase their discussions with patients; which has, of course, already been proven to be an effective way to
increase patient's satisfaction with medical care, regardless of the procedure received.
Published: 10 July 2009
Health and Quality of Life Outcomes 2009, 7:63 doi:10.1186/1477-7525-7-63
Received: 16 January 2009
Accepted: 10 July 2009
This article is available from: />© 2009 Lin et al; licensee BioMed Central Ltd.
This is an Open Access article distributed under the terms of the Creative Commons Attribution License ( />),
which permits unrestricted use, distribution, and reproduction in any medium, provided the original work is properly cited.
Health and Quality of Life Outcomes 2009, 7:63 />Page 2 of 8
(page number not for citation purposes)
Background
LASIK is the use of excimer lasers to treat therapeutic and
refractive visual disorders ranging from superficial scars to
nearsightedness (myopia), astigmatism, and farsighted-
ness (hyperopia). In the USA, more than 1.1 million
LASIK procedures were performed in 2003 out of a total
of 3.0 million worldwide. There is much research identi-
fying LASIK as a state of the art procedure currently being
used to correct all levels of myopia, astigmatism, and
hyperopia [1,2], and these problems are corrected with
less haze and earlier stabilization of visual acuity than
other methods of treatment, or if left untreated [3].
Service quality
Gronroos (1984) argued that there are two distinct con-
stituents of service quality, the technical and the func-
tional. In the health care field, technical quality focuses on
the technical accuracy of the medical diagnosis and proce-
dures, while functional quality is the manner in which the
health care was provided. However, in the context of
health care, the technical quality was difficult to evaluate
for consumers [4], and this resulted in most patients eval-
uating health care based on the functional aspects alone.
Parasuraman [5] defined service quality as the difference
between customer expectations and customer percep-
tions. When expectations are greater than perceptions a
service quality gap exists.
Patient satisfaction should be interpreted carefully, due to
the lack of theoretical foundations on which the concept
of satisfaction and measurement are based [6]. Patients
are an active consumer of health care services rather than
merely passive recipients [7]. The validity and reliability
of many studies on health care consumer satisfaction have
been questioned [8].
The original PZB model [5] identified 10 determinants of
service quality. The subsequently developed SERQUAL [9]
recast the 10 determinants into five specific components:
tangibles, reliability, responsiveness, assurance, and
empathy. These five components are a factor analysis of
the 22-items scale. Measuring quality of care from the
patient's perspective has been increasingly used and
accepted in health care research [10-12]. One study used
the SERVQUAL service quality to measure the expectation
and perception of Greek patients on dental health care
[5,9,13,14]. Another study used a refined version of SERV-
QUAL to measure patient satisfaction in health services in
Bangladesh [15] and the results found that the "tangible"
factor was the most important factor in health service
quality. Patient satisfaction, however, has rarely been con-
sidered in cataract surgery [16-18] and few studies have
addressed the role of the hypothesized determinants of
patient satisfaction.
Purpose
The purposes of this study are to checking the applicabil-
ity and psychometric properties of the SERVQUAL on
Lasik surgery population. Second, SEM methods are used
to investigate the loyalty, perceptions and expectations
relationship on LASIK surgery.
Methods
Patients and Institution
466 out of 476 consecutive patients undergoing day-stay
LASIK surgery at Chung Shan Medical University Bair's
Eye Center in Taichung, Taiwan were invited to participate
in this study, when patients finished the follow up visit
after their operation from June 2006 to May 2007.
Patients who declined the questionnaire indicated it was
due to personal time limitations. The Sample Eye Center
is one of the largest eye centers in central Taiwan and
serves a large number of eye disease patients, drawn from
the two million person population of metropolitan Taic-
hung. The eye center has four full time ophthalmologists
and offers LASIK procedures, including Wavefront LASIK.
Like most technology-driven fields, LASIK continues to
evolve as system vendors and surgeons look for new ways
to apply technology to improve surgical outcomes. The
most promising of these new approaches is called Opti-
mized Aspherical Transition Zone, topo-guided wave-
front-guided LASIK combined with the Torsion Error
Detection (TED), or simply, Wavefront LASIK (also
known as Custom Ablation). The procedure of LASIK con-
tains three major steps, they are: preoperative evaluation,
operation, and a follow up after the operation. In the first
component, preoperative evaluation: patients have to
under go seven preoperative diagnostic tests: auto refrac-
tion, visual acuity, pneumotonometry, slit lamp exam,
Topography, Pachometery. In the second component,
operation, major operations are conducted. And in the
third component, follow up after operation, patients have
to under go 5 post operation diagnostic tests: auto refrac-
tion, visual acuity, slit lamp exam, retina examination,
and topography.
Research Design
This study used the adapted and revised SERVQUAL con-
ceptual model of service quality in conjunction with the
SERVQUAL questionnaire to measure the expectation and
perception of LASIK patients.
The SERVQUAL instrument was designed to measure serv-
ice quality using both the gap concept and service quality
dimensions. The original SERVQUAL contains 22 pairs of
the Likert scale on five service quality dimensions and are
defined as follows:
1. Tangibles: The appearance of physical facilities, equip-
ment, appearance of personnel, and communication
materials.
Health and Quality of Life Outcomes 2009, 7:63 />Page 3 of 8
(page number not for citation purposes)
2. Reliability: The ability to perform the promised service
dependably and accurately.
3. Responsiveness: The willingness to help customers and
provide prompt service.
4. Assurance: The knowledge and courtesy of employees
and their ability to inspire trust and confidence.
5. Empathy: The caring, individualized attention the firm
provides to its customers
The questionnaire (see Appendix) was composed of four
parts and used 7 points on the Likert scale (strongly disa-
gree = 1 to strongly agree = 7). The first part, the percep-
tion and expectation component, (quality gap) is
composed of 22 paired items on service quality. The sec-
ond part is three items on loyalty which are overall satis-
faction, willingness to revisit, and a willingness to
recommend to friend[19,20]. These items which measure
what we termed customer loyalty could serve as anchor
items to examine the criterion-related validity of the scale.
The third part of these questionnaires is composed of the
patient's background data, such as sex, age, job, level of
education achieved, date of LASIK surgery, and the out-
come of the LASIK surgery. The fourth part is an open area
where patients can write their comments and/or any ideas
about the service they received.
Reliability and Validity
Internal consistency and reliability
The expectation and perception scale had an alpha coeffi-
cient of > 0.958 (Table 1). Also, the correlations in "item
to total" were all from 0.36 to 0.90.
Content validity
Content validity of the questionnaire was further con-
firmed by 3 ophthalmologists and 2 management special-
ists. The validity was also verified through several
literature reviews on the SERVQUAL service model
[5,9,13-15,19].
Table 2: Factor loading of patients' satisfaction
Loadings Loadings
Expected Factor 1 Factor 2 Factor3 Factor 4 Factor 5 Perceived Factor 1 Factor 2 Factor 3 Factor 4 Factor 5
E1 0.79 P1 0.80
E2 0.80 P2 0.78
E3 0.81 P3 0.68
E4 0.77 P4 0.64
E5 0.86 P5 0.68
E6 0.86 P6 0.75
E7 0.87 P7 0.77
E8 0.85 P8 0.67
E9 0.86 P9 0.65
E10 0.86 P10 0.68
E11 0.88 P11 0.81
E12 0.84 P12 0.78
E13 0.80 P13 0.70
E14 0.85 P14 0.83
E15 0.85 P15 0.81
E16 0.81 P16 0.87
E17 0.86 P17 0.82
E18 0.72 P18 0.70
E19 0.66 P19 0.78
E20 0.82 P20 0.85
E21 0.75 P21 0.79
E22 0.79 P22 0.77
Eigenvalue 8.85 2.69 2.04 1.88 1.51 Eigenvalue 9.89 2.01 1.84 1.25 1.06
% of Variance 40.21% 12.23% 9.27% 8.55% 6.86% % of Variance 44.95% 9.13% 8.36% 5.69% 4.80%
Table 1: Reliability and Paired t test
Mean SD Cronbach's alpha
Expectation 6.68 0.47 t = 6.08* 0.958
Perception 6.51 0.57 0.967
Note 1: * means significant at 0.05 level
Health and Quality of Life Outcomes 2009, 7:63 />Page 4 of 8
(page number not for citation purposes)
Construct validity
On the basis of a review of the literature, the latent con-
struct of patient expectations and perceptions of quality
was theorized to be multidimensional. The factor analysis
(Table 2) identified five dimensions of expected and per-
ceived quality [21,22].
Criterion-related validity and predictive validity
Criterion-related validity and predictive validity, identi-
fied in Table 3 and Figure 1, indicated that the expected
and perceived quality scale was associated with loyalty
which included overall satisfaction, willingness to revisit,
and willingness to recommend to friends [20]. Also, the
goodness of fit indices provides model validity [23].
Convergent validity
Bollen's Rho coefficient equal to 0.921 and 0.922 which
are greater than 0.70.
Statistic analysis
The software STATISTICA
®
version 7.1 was used for the sta-
tistics analysis spread through out this research, including
the Structural equation modeling (SEM), Student t test,
correlation test, and ANOVA used to test the overall satis-
faction with patient's characteristics. Factor analyses [24],
which are a data-reduction technique, were used to deter-
mine the number and nature of factors of service quality
that underlie a set of variables. The principal axis method
was used to extract all factors that had eigenvalues greater
than 1 and, therefore, could explain a significant amount
of the total variance. Scree tests were used to identify the
number of factors to retain. Paired t tests were used to test
the gap between expectation and perception scores. Struc-
tural equation modeling was used to examine relation-
ships between satisfaction components. The (alternative)
hypotheses were stated as follows:
H1: Perceptions are positively correlated with expecta-
tions.
H2: Loyalty is positively correlated with perceptions.
H3: Loyalty is positively correlated with expectations.
The hypotheses were tested via SEM using the STATIS-
TICA
®
7.1 package. The parameters estimated were the
regression coefficients in this structural equation part of
the SEM. The assessment of model adequacy was based on
the following goodness-of-fit criteria: Normed chi-square
(χ
2
/df) < 3, root mean square error of approximation
(RMSEA) < 0.08, population gamma index (PGI),
adjusted population gamma index (APGI), goodness-of-
fit (GFI), adjusted goodness-of-fit (AGFI), and Bollen's
Rho > 0.8 [25]. Browne-Cudeck Cross Validation Index
close to 0.9 is considered a good fit.
Results
466 out of 476 patients agreed to fill out the question-
naire after they finished the post-operation assessment.
The director of staff facilitated the questionnaire request.
Among the returned questionnaires, three of them were
not complete; therefore, 463 (97.3%) copies were consid-
Table 4: Patients' Characteristics
Characteristics Range
No. of patients 463
Age, mean (SD) 29.03 (5.52) 17–59
No. of women (%) 327 (70.62%)
Education degree
Junior high 2
Senior high 78
College 336
Graduate 47
Table 3: Goodness-of-fit summary for patients' satisfaction model
χ
2
df χ
2
/df RMSEA PGI APGI GFI AGFI Bollen's Rho BC Index
Model 1 268.516 62 4.33 0.085 0.914 0.873 0.897 0.849 0.921 0.866
Model 2 269.358 63 4.28 0.084 0.914 0.876 0.91 0.87 0.922 0.863
Note: BC Index: Browne-Cudeck Cross Validation Index
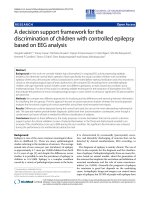
SEM on patients' satisfaction model 1Figure 1
SEM on patients' satisfaction model 1. Indicated the ini-
tial SEM patients' satisfaction model.
Expectations
Perceptions
Loyalty
R2: revisit
R3: recommend
R1: overall
E2
E1
E3
E4
E5
P1
P2
P3
P4
P5
Model 1
Health and Quality of Life Outcomes 2009, 7:63 />Page 5 of 8
(page number not for citation purposes)
ered effective responses. The patient's characteristics are
presented in Table 4. The mean (SD) age was 29.0 (5.5)
years, 327 (70.62%) patients were female, 383 (87.8%)
patients had a college degree or higher.
The results of the scores of patients showed very high on
the overall satisfaction 6.41 (0.66), expectations 6.68
(0.47), and perceptions 6.51 (0.57) in Table 5 and
Table 1.
In Table 5, the student t test on sex showed there was no
difference on the overall satisfaction between male and
female, also the correlation test revealed there was no sig-
nificant relationship between age, job, or education, and
with the patient's overall satisfaction.
In Table 6, the student t test on gender showed females
have higher expectation levels than their male counter-
parts. However, there was no significant difference in per-
ception and loyalty scores. Furthermore, the correlation
test revealed there was no significant relationship on age
items. ANOVA results showed there were significant dif-
ferences in expectation scores between various occupa-
tions. A further LSD test on Table 7 showed yet more
details. In expectations, public service, students and oth-
ers have lower scores, where as house keepers and service
industry workers have higher scores. The most interesting
correlation was in the level of education achieved; the
higher the degree of education, the lower the scores in per-
ception (r = -0.10).
The loading results of factor analysis in Table 2 showed 5
factors in the SERVQUAL model perceived (explained
72.94% of total variance) and expected (explained
77.12% of total variance) satisfaction scores. Although
some of the items showed a little overlap, the 22 items
were relatively well distributed over the five factors. In
addition, the eigenvalues criteria and Scree tests further
confirmed these 5 factors.
In order to see whether there were gaps between the
patient's expectations and perceptions, paired t tests were
conducted in Table 1. The results demonstrated that
patients had a higher score in expectations than in percep-
tions, which, of course, means there was a quality gap
between them.
Table 7: LSD test on the JOB and Expectation
{1} M = 6.81 {2} M = 6.60 {3} M = 6.68 {4} M = 6.68 {5} M = 6.74 {6} M = 6.51 {7} M = 6.82 {8} M = 6.62
{1} 0.060 0.186 0.215 0.770 0.010 0.965 0.065
{2} 0.331 0.398 0.568 0.381 0.009 0.828
{3} 0.981 0.801 0.051 0.035 0.390
{4} 0.798 0.083 0.072 0.474
{5} 0.357 0.745 0.616
{6} 0.000 0.241
{7} 0.006
Table 5: Tests on the overall satisfaction with patients' characteristics
No. of patients 463
Overall Satisfaction 6.41(0.66) Range 3–7
Sex Male 6.40(0.70) df = 461
Female 6.44(0.57) t = 0.65 (NS)
Age r = 0.07 (NS)
Job (ANOVA) SS between = 2.459 MS = 0.351 F = 0.80 (NS) df = 7
SS within = 199.57 MS = 0.439 df = 455
Education degree r = -0.03(NS)
Table 6: Tests on the satisfaction with patients' demographics
Gender e1–e22 Female 6.73 (0.37) t = 3.65*
Male 6.56 (0.64)
p1–p22 Female 6.50 (0.60) t = 0.48 (NS)
Male 6.53 (0.51)
Loyalty Female 6.48 (0.64) t = 0.33 (NS)
Male 6.50 (0.52)
Age e1–e22 r = 0.08 (NS)
p1–p22 r = 0.07 (NS)
Loyalty r = 0.09 (NS)
Job e1–e22 F = 2.69*
p1–p22 F = 1.30 (NS)
Loyalty F = 1.12 (NS)
Education degree e1–e22 r = -0.02 (NS)
p1–p22 r = -0.10*
Loyalty r = -0.05 (NS)
Note 1: * means significant at 0.05 level
Note 2: NS means not significant at 0.05 level
Health and Quality of Life Outcomes 2009, 7:63 />Page 6 of 8
(page number not for citation purposes)
Structural Equation Modeling (SEM) of the patient's satis-
faction was undertaken in the goodness-of-fit measuring
model. The SEM approach was considered appropriate for
estimating among multiple dependent and independent
latent variables and providing a better model for the com-
plex relationships among satisfaction components [26].
The goodness-of-fit summary of structure equation mod-
eling on Figure 1, Figure 2, Table 3 and Table 8 showed
the direction and concept in expectations, perceptions,
and loyalty. Table 8 showed path coefficient for Model 1
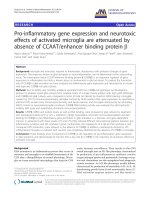
and Model 2. Since Model 1 and Figure 1 do not show
adequate results, it has been revised into Model 2 and Fig-
ure 2. The revised model's results in Model 1 show ade-
quate test results in RMSEA, PGI, APGI, GFI, AGFI,
Bollen's Rho, and Browne-Cudeck Cross Validation Index.
Based on the SEM results the path coefficient showed that
the first two hypotheses were correct. Research Hypothesis
H1 (perceptions are positively correlated with expecta-
tions) and H2 (loyalty is positively correlated with percep-
tions) are accepted, and however, H3 (loyalty is positively
correlated with expectations) was rejected.
In the comments section 31 of 463 patients wrote com-
ments. Most of the comments were positive, such as "the
service was good," and "doctors and nurses responded to
questions quickly and completely." However, five patients
did complain about spending too long waiting. Also some
wrote that the nurses were too young and too beautiful,
and that the hospital should hire individuals of middle
age who would give patients an impression of stability
and reliability. Another patient complained that there
weren't free gifts of sun glasses and facial cosmetics. One
complained that the new air freshener in the LASIK wait-
ing area was irritating.
Conclusion
According to results of this research, we believe that our
adapted version of SERVQUAL is appropriate for evaluat-
ing the service quality of LASIK service, and shared the
same conclusion's of Lin's [12], which stated SERVQUAL
can be used in outpatient care and that assurance and
empathy were at the top of the patient's priorities. How-
ever, the largest quality gap in this study was empathy,
and differed from responsiveness in Lin's study [12]. Fur-
ther validation studies in various surgeries and countries
SEM on patients' satisfaction model 2Figure 2
SEM on patients' satisfaction model 2. Indicated the
final model which shows the perceptions are positively cor-
related with expectations. Also, loyalty is positively corre-
lated with perceptions, and, however, loyalty is positively
correlated with expectations was rejected.
Expectations
Perceptions
Loyalty
R2: revisit
R3: recommend
R1: overall
E2
E1
E3
E4
E5
P1
P2
P3
P4
P5
Model 2
Table 8: Path Coefficients of SEM Models
Model 1 Estimate S.E. C.R. Model 2 Estimate S.E. C.R.
E to Loyalty 0.024 0.37 0.63 NS
E to Perception 0.392 0.062 6.37 * E to Perception 0.52 0.067 7.78 *
P to Loyalty 0.621 0.39 16.02 * P to Loyalty 0.825 0.152 5.44 *
Eto E5 1 Eto E5 1
E to E4 0.858 0.034 24.91 * E to E4 0.86 0.036 23.82 *
E to E3 0.97 0.036 27.13 * E to E3 0.952 0.038 25.06 *
E to E2 0.795 0.033 23.97 * E to E2 0.791 0.035 22.71 *
E to E1 0.701 0.051 13.88 * E to E1 0.745 0.051 14.57 *
Pto P5 1 Pto P5 1
P to P4 0.838 0.028 30.34 * P to P4 0.886 0.149 5.94 *
P to P3 0.89 0.029 30.21 * P to P3 0.949 0.159 5.96 *
P to P2 0.826 0.029 28.02 * P to P2 0.919 0.153 6.00 *
P to P1 0.612 0.031 19.55 * P to P1 0.737 0.131 5.64 *
Lto R1 1 LtoR1 1
L to R2 1.103 0.055 20.06 * L to R2 0.957 0.192 5.00 *
L to R3 1.165 0.056 20.78 * L to R3 1.053 0.202 5.22 *
Note 1: * means significant at 0.05 level.
Note 2: NS means not significant at 0.05 level.
Health and Quality of Life Outcomes 2009, 7:63 />Page 7 of 8
(page number not for citation purposes)
are suggested to make future cross-cultural comparisons
possible.
The result of this research also confirms the loyalty, per-
ceptions and expectations relationship on LASIK surgery
by SEM methods.
One of the advantages of this research study was the high
percentage of effective responses (463/476 = 97.3%),
compared with 79% of similar research in Tso [20] and
48.8% in Oltedal [27], 25.6% in Bankauskaite [6], 63%
response rate in Hendriks [28] which reduced the non-
responded bias.
Free gifts such as sun glasses and facial cosmetics could be
used in the future, in response to a patient's response and
could bolster patients impressions quite cost effectively.
The results of the psychometric properties of this research
on Lasik surgery population revealed that there was no
difference in the patient's satisfaction scores between
males and females. Also there was no significant relation-
ship between satisfaction scores and age, job, and educa-
tion. The gender aspects of these results were the same as
Hall [29]. However, these results differed from former
research studies, such as Sorlie's [30], Baker [31], Lledó
[32] who found that female patients facing cataract sur-
gery displayed higher expectations than their male coun-
terparts. This could be because LASIK was a high cost
(US$2,000 dollars) and totally self-paid surgery. Second,
patients expected high quality services; therefore, the high
scores in expectations and perceptions could compensate
for the gap between genders.
The results of this research showed historically high scores
in patient's expectations (6.51/7 = 93.0%), and percep-
tions (6.29/7 = 89.9%). Compared with research con-
ducted in India for outpatient (n = 1837) and inpatient
services (n = 611) in primary health centers and district
hospitals, their scores were lower than this study and
ranged from 3.63/5 = 72.6% to 3.74/5 = 74.8% [21]. Also,
Lin's study [12] in solo practice and group practice, which
had scores that ranged from 3.73/5 = 74.6% to 4.11/5 =
82.2%, also lower than our study. In another study, con-
ducted in the USA, patient satisfaction scores in relation to
physicians was 78.22%, also significantly lower than this
study [33]. The results of this research demonstrated that
the SERVQUAL instrument is a useful measurement tool
in assessing and monitoring service quality in LASIK serv-
ice, and enabling staff to identify where improvements are
needed from the patient's perspective. There were service
quality gaps in the reliability, assurance, and empathy sec-
tions. This study suggested that physicians should increase
their discussions with patients. This has already been
proven to be an effective way to increase patient's satisfac-
tion with medical care regardless of the procedure
received [34].
Limitations
This research has some limitations. First, the results of the
structure equation modeling on confirmatory factor anal-
ysis show that the model is not perfect since the χ
2
/df =
4.28–4.33 is higher than the criteria's 3.0 [35], in addi-
tion, more female than male patients were enrolled in this
study. However, this is due to the natural population dis-
tribution of LASIK patients, i.e. women are more unwill-
ing to wear glasses and therefore, they will have more
LASIK surgery than men.
Competing interests
The authors declare that they have no competing interests.
Authors' contributions
DJL was responsible for primary data cleaning and analy-
sis, ICS served as a methodologic consultant, assisted with
data analysis and interpretation, and participated in man-
uscript editing. JYP was responsible for primary study
design, manuscript drafting, statistic and interpretation,
and manuscript submission. AB served as a LASIK consult-
ant, assisted with data collection and assisted with meth-
odology design. CYH was responsible for statistic
consultant. YHY served as medical consultant. MJC served
as medical consultant. All authors have read and
approved this manuscript.
Acknowledgements
I would like to thank Andrew Pense on his direct help in the preparation
and grammar editing of the study.
References
1. Jacobs BJ, Deutsch TA, Rubenstein JB: Reproducibility of corneal
flap thickness in LASIK. Ophthalmic Surg Lasers. 1999,
30(5):350-353.
2. Guell JL, Gris O, Muller AD, Corcostegui B: LASIK for the correc-
tion of residual refractive errors from previous surgical pro-
cedures. Ophthalmic Surg Lasers. 1999, 30(5):341-349.
3. Nakamura K, Bissen-Miyajima H, Toda I, Horim Y, Tsubota K: Effect
of Laser in situ keratomileusis correction on contrast visual
acuity. Journal of Cataract & Refractive Surgery 2001, 27:357-361.
4. Gronroos C: A service quality model and its marketing impli-
cations. Eur J Mark 1984, 18:36-44.
5. Parasuraman A, Zeithaml VA, Berry LL: A Conceptual Model of
Service Quality and Its Implications for Futuring Research.
Journal of Marketing 1985, 49:41-50.
6. Bankauskaite V, Saarelma O: Why are people dissatisfied with
medical care services in Lithuania? A qualitative study using
responses to open-ended questions. Int J Qual Health Care 2003,
15:23-29.
7. Speight J: Assessing patient satisfaction: concepts, applica-
tions, and measurement. Value in Health 2005, 8:S6-S8.
8. Sitzia J: How valid and reliable are patient satisfaction data?
An analysis of 195 studies. Int J Qual Health Care 1999,
11:1131-1328.
9. Parasuraman A, Zeithaml VA, Berry LL: SERVQUAL: A Multiple
item Scale for Measuring Consumer Perceptions of Service
Quality. Journal of Marketing 1988, 64:12-40.
10. Rao KD, Peters DH, Bandeen-Roche K: Towards patient-cen-
tered health services in India – a scale to measure patient
perceptions of quality. Int J Qual Health Care 2006, 18:414-421.
Publish with BioMed Central and every
scientist can read your work free of charge
"BioMed Central will be the most significant development for
disseminating the results of biomedical research in our lifetime."
Sir Paul Nurse, Cancer Research UK
Your research papers will be:
available free of charge to the entire biomedical community
peer reviewed and published immediately upon acceptance
cited in PubMed and archived on PubMed Central
yours — you keep the copyright
Submit your manuscript here:
/>BioMedcentral
Health and Quality of Life Outcomes 2009, 7:63 />Page 8 of 8
(page number not for citation purposes)
11. Duong DV, Binns CW, Lcc AH, Hipgravc DB: Measuring client-
perceived quality of maternity services in rural Vietnam. Int
J Qual Health Care 2004, 16:447-452.
12. Lin HC, Sudha Xirasagar, Laditka JN: perceptions of service qual-
ity in group versus solo practice clinics. Int J Qual Health Care
2004, 16:437-445.
13. Karydis A, Komboli-Kodovazeniti M, Hatzigeorgiou D, Panis V:
Expectation and perceptions of Greek patients regarding the
quality of dental health care. Int J Qual Health Care 2001,
13:409-416.
14. Parasuraman A, Zeithaml VA, Berry LL: Refinement and reassess-
ment of the SERVOQUAL scale. Journal of Retailing 1991,
67:420-450.
15. Syed SA, Nazlee S, Shahjahan K: Patient satisfaction with health
services in Bangladesh. Health Policy and Planning 2007,
22:263-273.
16. Pager CK: Expectations and Outcomes in Cataract Surgery: A
Prospective Test of 2 Models of Satisfaction. Arch Ophthalmol
2004, 122:1788-1792.
17. Legro MW: Quality of life and cataracts: a review of patient-
centered studies of cataract surgery outcomes. Ophthalmic
Surg. 1991, 22(8):431-443.
18. Mangione CM, Phillips RS, Lawrence MG, Seddon JM, Orav EJ, Gold-
man L: Improved visual function and attenuation of declines
in health-related quality of life after cataract extraction. Arch
Ophthalmol 1994, 112:1419-1425.
19. Wisniewski M, Wisniewski H: Measuring service quality in a hos-
pital colposcopy clinic. Int J Health Care Qual Assur Inc Leadersh
Health Serv. 2005, 18(2-3):217-228.
20. Tso IF, Ng SM, Chan CLW: The development and validation of
the Concise Outpatient Department User Satisfaction
Scale. Int J Qual Health Care 2006, 18:275-280.
21. Krishna DR, David HP, Karen BR: Towards patient-centered
health services in India – a scale to measure patient percep-
tions of quality. Int J Qual Health Care
2006, 18:414-421.
22. Guo N, Marra F, Marra CA: Measuring health-related quality of
life in tuberculosis: a systematic review. Health and Quality of
Life Outcomes 2009, 7:14.
23. Chou SC, Duncan PB, Lee AH: Measuring job satisfaction in res-
idential aged care. Int J Qual Health Care 2002, 14:49-54.
24. Dawn AG, McGwin G: Patient expectations regarding eye care:
Development and Results of the Eye Care Expectations Sur-
vey (ECES). Arch Ophthalmol 2005, 123:534-541.
25. Maruyama GM: Basis of Structural Equation Modeling. Thou-
sand Oaks, CA: Sage Publications, Inc; 1998.
26. Bollen KA, Long JS: Testing Structural Equation Model. New-
bury Park, CA: Sage Publications; 1993.
27. Oltedal S: The NORPEQ patient experiences questionnaire:
Data quality, internal consistency and validity following a
Norwegian inpatient survey. Scandinavian Journal of Public Health
2007, 35:540-547.
28. Hendriks A, Oort FJ, Vrielink MR, Smets EMA: Reliability and valid-
ity of the Satisfaction with Hospital Care Questionnaire. Int
J Qual Health Care 2002, 14:471-482.
29. Hall JA, Durman MC: Patient sociodemographic characteristics
as predictors of satisfaction with medical care: a meta-anal-
ysis. Soc Sci Med 1990, 30:811-818.
30. Sorlie T, Sexton HC, Busund R, Sorlie D: Predictors of satisfaction
with surgical treatment. Int J Qual Health Care 2000, 12:31-40.
31. Baker R: Characteristics of practices, general practitioners
and patients related to levels of patients' satisfaction with
consultations. Br J Gen Pract. 1996, 46(411):601-605.
32. Lledó R, Rodríguez T, Fontenla JR, Pita D, Prat A, Asenjo MA: Cata-
ract Surgery: An Analysis of Patient Satisfaction with Medi-
cal Care. Int Ophthalmol. 1999, 22(4):227-232.
33. Kong MC, Camacho FT, Feldman SR, Anderson RT, Balkrishnan R:
Correlates of patient satisfaction with physician visit: Differ-
ences between elderly and non-elderly survey respondents.
Health Qual Life Outcomes. 2007, 5:62.
34. Chen JY, Tao ML, Tisnado D, Malin J, Ko C, Timmer M, Adams JL,
Ganz PA, Kahn KL: Impact of Physician-Patient Discussions on
Patient Satisfaction. Medical Care 2008, 46:1157-1162.
35. Chou SC, Duncan PB, Lee AH: Staff satisfaction and its compo-
nents in residential aged care. Int J Qual Health Care. 2002,
14(3):207-217.