Climate Change and Variability Part 4 pptx
Bạn đang xem bản rút gọn của tài liệu. Xem và tải ngay bản đầy đủ của tài liệu tại đây (5.01 MB, 35 trang )
Possible impacts of global warming on typhoon activity in the vicinity of Taiwan 93
Fig. 4. Time series of seasonal (JJASO) typhoon frequency departure from 1970 to 2006 for
three sub regions of the western North Pacific: (a) the South China Sea, (b) the Philippine
Sea and (c) the Taiwan and East China Sea region. The thicker dashed line in the upper
panel is a best-fit least square linear trend and the thinner dashed lines denote one standard
deviation for each area. The unit in the y-axis is the typhoon number per season (JJASO) per
grid box (2.5°×2.5°). Adapted from Tu et al. (2009).
Fig. 5. The 5875 gpm contour of 500hPa geopotential height for the period of 1982-1999
(thick dotted line) and 2000-2006 (thick solid line) in (a) June-October (JJASO), (b) June, (c)
July-September (JAS) and (d) October. The contours are the 500hPa geopotential height
differences of the second minus first epoch, shaded by the 10% significance level. Adapted
from Tu et al. (2009).
Climate Change and Variability94
Fig. 6. (a) 850 hPa wind difference between 2000-2006 and 1982-1999 for JJASO; (b) same as
(a) but for 850 hPa relative vorticity; (c) same as (a) but for vertical wind shear (200hPa-
850hPa); and (d) same as (a) but for sea surface temperature (SST). The contour interval for
850 hPa relative vorticity is 1.5E+6 (s
-1
), for vertical wind shear is 0.8 (m s
-1
), and for SST
anomalies is 0.2°C. Dotted areas indicate regions where the difference in the mean between
two epochs is significant at the 5% level. In (b), (c), and (d), negative values are dashed.
Adapted from Tu et al. (2009).
Fig. 7. SST anomalies (contour) and 850 hPa wind anomalies from the model simulations
with the prescribed SST anomalies over (a) the equatorial region (130°E-175°E, 5°S-5°N) and
(b) mid-latitudes (140°E-120°W, 25°N-45°N). Adapted from Tu et al. (2009).
Fig. 8. Variation of monthly SST anomalies averaged over the area of 130°E-175°E and
5°S-5°N from January 1982 to July 2007. The short dashed lines are the means averaged over
1982-1999 (-0.1°C) and 2001-2006 (0.3°C) respectively. Adapted from Tu et al. (2009).
Possible impacts of global warming on typhoon activity in the vicinity of Taiwan 95
Fig. 6. (a) 850 hPa wind difference between 2000-2006 and 1982-1999 for JJASO; (b) same as
(a) but for 850 hPa relative vorticity; (c) same as (a) but for vertical wind shear (200hPa-
850hPa); and (d) same as (a) but for sea surface temperature (SST). The contour interval for
850 hPa relative vorticity is 1.5E+6 (s
-1
), for vertical wind shear is 0.8 (m s
-1
), and for SST
anomalies is 0.2°C. Dotted areas indicate regions where the difference in the mean between
two epochs is significant at the 5% level. In (b), (c), and (d), negative values are dashed.
Adapted from Tu et al. (2009).
Fig. 7. SST anomalies (contour) and 850 hPa wind anomalies from the model simulations
with the prescribed SST anomalies over (a) the equatorial region (130°E-175°E, 5°S-5°N) and
(b) mid-latitudes (140°E-120°W, 25°N-45°N). Adapted from Tu et al. (2009).
Fig. 8. Variation of monthly SST anomalies averaged over the area of 130°E-175°E and
5°S-5°N from January 1982 to July 2007. The short dashed lines are the means averaged over
1982-1999 (-0.1°C) and 2001-2006 (0.3°C) respectively. Adapted from Tu et al. (2009).
Climate Change and Variability96
Fig. 9. Globally averaged SST in JJASO for the period of 1982-2009.
Fig. 10. Trend of SST in JJASO for the period of 1982-2009. The unit is ºC per decade. The
dotted area denotes that the trend is statistically significant at the 5% level.
Fig. 11. Trend of typhoon frequency in JJASO for the period of 1970-2009. The unit is per
season (JJASO) per grid box (2.5°×2.5°). The dotted area denotes that the trend is statistically
significant at the 5% level.
Inuence of climate variability on reactive nitrogen deposition in temperate and Arctic climate 97
Inuence of climate variability on reactive nitrogen deposition in
temperate and Arctic climate
Lars R. Hole
x
Influence of climate variability on
reactive nitrogen deposition in
temperate and Arctic climate
Lars R. Hole
Norwegian Meteorological Institute (met.no)
Norway
1. Introduction
Depending on wetness of the climate, a large fraction of reactive nitrogen deposited from
the atmosphere is deposited as wet deposition, ranging from 10 to 90%. The remaining
fraction is deposited as dry deposition (gas and particles) (Delwiche, 1970; Galloway et al.,
2004; Wesely & Hicks, 2000). Deposition of long-range transported reactive nitrogen (Nr)
has been an issue of concern Europe and North America for a long time. In 1983 the
Convention on Long-Range Transboundary Air Pollution entered into force, while the
Protocol concerning the Control of Nitrogen Oxides or their Transboundary Fluxes was
signed in 1988. While measures to reduce sulphur (S) emissions have been quite successful,
nitrogen (N) emissions have proven more difficult to reduce (www.emep.int). Effects of N
deposition on terrestrial ecosystems include surface water acidification (Stoddard, 1994) and
reductions in biodiversity (Bobbink et al., 1998) while forest growth effects are more difficult
to substantiate (Tietema et al., 1998; Emmett et al., 1998). Retention of N in many boreal and
temperate ecosystems is usually high, which leads to soil N enrichment which in turn may
lead to ‘N saturation’ of soils and increased leaching of N to surface waters, leading to water
acidification (Stoddard, 1994). Recent studies indicate that climate change may affect the
biogeochemical Nr cycle profoundly. Evidence is accumulating that interactions between N
deposition and terrestrial processes are influenced by climate warming (De Wit et al., 2008).
There are few studies on the linkage between Nr deposition and climate variability in
Northern Europe. By coupling of a regional climate model and the Mesoscale Chemical
Transport (CTM) Model MATCH, Langner et al. (2005) showed that changes in the
precipitation pattern in Europe have a substantial potential impact on deposition of oxidised
nitrogen, with a global warming of 2.6 K reached in 2050-2070. Air mass trajectories have
been shown to be affected by climate warming and this may potentially lead to changes in N
deposition. Fowler et al (2005) were not able to establish a clear connection between Nr wet
deposition in the UK and the North Atlantic Oscillation Index (NAOI), suggesting that a
much more detailed approach with analysis of individual precipitation events and trajectory
studies would have to be used in order to establish relationships between Nr deposition
trends and climate variation.
In Norway, Hole and Tørseth (2002) reported the total sulphur and nitrate deposition in
6
Climate Change and Variability98
five-year periods from 1978-1982 to 1997-2001 by interpolating national and EMEP
(European Monitoring and Evaluation Programme) station measurements to the EMEP
50x50 km grid. They found that the total (wet+dry) Nr deposition in the last period had
been reduced with 16% compared to the first period although the total precipitation had
increased with 10% (Fig 1). However the decline in deposition since the early 1980s is not
steady since EMEP area NOx emissions reached a peak around 1990 and the period 1988-
1992 was the wettest in Norway of the periods studied. Grid cell total deposition for NOx in
the last period varied from 0.04 to 1.2 g N m
-2
yr
-1
while corresponding numbers for NHy
was 0.06 to 0.9 g N m
-2
yr
-1
.
According to Hanssen-Bauer (2005) mean annual precipitation in Norway has increased in
9 of 13 climate regions into which Norway is divided (Fig. 1), with a 15-20% increase in
northwestern regions (between Bergen and Trondheim) in the last century.
2. Trend analysis of nitrogen deposition and relation to climate variability
2.1 Measurement network studied
In the following, we explore relations between climate variability and wet N deposition at 7
locations in south Norway, including a range in annual precipitation and atmospheric Nr
deposition. We have tested whether various climate indices are significantly correlated with
i) bulk concentrations of Nr in precipitation ii) monthly precipitation iii) Nr deposition
during summer and winter. Our main focus is deposition. We have separated summer and
winter data to test whether there are seasonal differences in the correlations. More details on
the measurement network can be found in Hole et al. (2008).
2.2 Climate indices
Different climate indices have been tested for correlation with Nr deposition, precipitation
and Nr concentration in precipitation. In addition to the North Atlantic Oscillation Index
(NAOI) we have tested for the Arctic Oscillation Index (AOI), the European Blocking Index
(EUI), the Scandinavian blocking Index (ScandI) and the East Atlantic Index (EAtlI).
The Arctic oscillation (AO) is the dominant pattern of non-seasonal sea-level pressure (SLP)
variations north of 20N, and it is characterized by SLP anomalies of one sign in the Arctic
and anomalies of opposite sign centered about 37-45N. The North Atlantic oscillation
(NAOI) is a climatic phenomenon in the North Atlantic Ocean of fluctuations in the
difference of sea-level pressure between Iceland and the Azores. It controls the strength and
direction of westerly winds and storm tracks across the North Atlantic and is a close relative
of the
AO (www.cpc.noaa.gov).
The European blocking index is based on observations of pentad (5-day average) wind over
the region 15W to 25E and 35n to 55N. If the pentad zonal wind equals the climatological
value for that time period, the index is zero. If the pentad zonal wind is less than average
the index is positive (a blocking high pressure persist over central Europe), while the
opposite is true if the index is negative. Similarly, positive ScandI and EatlI are associated
with blocking anticyclones over Scandinavia and the East Atlantic, respectively. Jet stream
intensity and orientation at the storm trackexit, and in the vicinity of Norway in particular,
vary with the phase of these climate patterns. (Orsolini and Doblas-Reyes, 2003).
The winter of 1990 (which was warm and wet with prevailing westerlies in S Norway) was a
strong positive event in NAOI whilst the dry and cold winter of 1996 was a prolonged
negative event. It also appears that the NAOI and AOI behave similarly and they are also
correlated, particularly in winter (R
summer
= 0.55, R
winter
= 0.81).
Fig. 1. Total deposition of nitrogen (oxidized + reduced) 1988-92 (maximum total Nr
deposition in the monitoring period) and 1997-2001 (minimum total Nr deposition in the
monitoring period) in mainland Norway. The unit is mg N/m2 year. From Hole and
Tørseth (2002). Precipitation zones from Hanssen-Bauer (2005) are also indicated.
2.3 Statistical method
Precipitation data from seven monitoring stations are presented here as monthly values in
winter (December-February) and summer (June-August). In this way we can see seasonal
differences since strong anticyclones in the Atlantic with westerlies are particularly common
in winter during negative NAOI events. Precipitation concentrations were weighted
according to precipitation amount. Existence of a monotonic increasing or decreasing trend
in the time series 1980-2005 and 1990-2005 was tested with the nonparametric Mann-Kendall
test at the 10% significance level as a two-tailed test (Gilbert, 1987). Some of the stations
opened in the 1970s, but we choose to test for the same periods at all stations to be able to
compare trends. An estimate for the slope of a linear trend was calculated with the
nonparametric Sen’s method (Sen, 1968). The Sen’s method is not greatly affected by data
outliers, and it can be used when data are missing (Salmi et al., 2002).
It is likely that significant trends in deposition are partly a result of changes in emissions.
However, it is not obvious which emission areas contribute to deposition in Norway, even
though a sector analysis has been carried out for parts of the period studied (Tørseth et al,
Inuence of climate variability on reactive nitrogen deposition in temperate and Arctic climate 99
five-year periods from 1978-1982 to 1997-2001 by interpolating national and EMEP
(European Monitoring and Evaluation Programme) station measurements to the EMEP
50x50 km grid. They found that the total (wet+dry) Nr deposition in the last period had
been reduced with 16% compared to the first period although the total precipitation had
increased with 10% (Fig 1). However the decline in deposition since the early 1980s is not
steady since EMEP area NOx emissions reached a peak around 1990 and the period 1988-
1992 was the wettest in Norway of the periods studied. Grid cell total deposition for NOx in
the last period varied from 0.04 to 1.2 g N m
-2
yr
-1
while corresponding numbers for NHy
was 0.06 to 0.9 g N m
-2
yr
-1
.
According to Hanssen-Bauer (2005) mean annual precipitation in Norway has increased in
9 of 13 climate regions into which Norway is divided (Fig. 1), with a 15-20% increase in
northwestern regions (between Bergen and Trondheim) in the last century.
2. Trend analysis of nitrogen deposition and relation to climate variability
2.1 Measurement network studied
In the following, we explore relations between climate variability and wet N deposition at 7
locations in south Norway, including a range in annual precipitation and atmospheric Nr
deposition. We have tested whether various climate indices are significantly correlated with
i) bulk concentrations of Nr in precipitation ii) monthly precipitation iii) Nr deposition
during summer and winter. Our main focus is deposition. We have separated summer and
winter data to test whether there are seasonal differences in the correlations. More details on
the measurement network can be found in Hole et al. (2008).
2.2 Climate indices
Different climate indices have been tested for correlation with Nr deposition, precipitation
and Nr concentration in precipitation. In addition to the North Atlantic Oscillation Index
(NAOI) we have tested for the Arctic Oscillation Index (AOI), the European Blocking Index
(EUI), the Scandinavian blocking Index (ScandI) and the East Atlantic Index (EAtlI).
The Arctic oscillation (AO) is the dominant pattern of non-seasonal sea-level pressure (SLP)
variations north of 20N, and it is characterized by SLP anomalies of one sign in the Arctic
and anomalies of opposite sign centered about 37-45N. The North Atlantic oscillation
(NAOI) is a climatic phenomenon in the North Atlantic Ocean of fluctuations in the
difference of sea-level pressure between Iceland and the Azores. It controls the strength and
direction of westerly winds and storm tracks across the North Atlantic and is a close relative
of the
AO (www.cpc.noaa.gov).
The European blocking index is based on observations of pentad (5-day average) wind over
the region 15W to 25E and 35n to 55N. If the pentad zonal wind equals the climatological
value for that time period, the index is zero. If the pentad zonal wind is less than average
the index is positive (a blocking high pressure persist over central Europe), while the
opposite is true if the index is negative. Similarly, positive ScandI and EatlI are associated
with blocking anticyclones over Scandinavia and the East Atlantic, respectively. Jet stream
intensity and orientation at the storm trackexit, and in the vicinity of Norway in particular,
vary with the phase of these climate patterns. (Orsolini and Doblas-Reyes, 2003).
The winter of 1990 (which was warm and wet with prevailing westerlies in S Norway) was a
strong positive event in NAOI whilst the dry and cold winter of 1996 was a prolonged
negative event. It also appears that the NAOI and AOI behave similarly and they are also
correlated, particularly in winter (R
summer
= 0.55, R
winter
= 0.81).
Fig. 1. Total deposition of nitrogen (oxidized + reduced) 1988-92 (maximum total Nr
deposition in the monitoring period) and 1997-2001 (minimum total Nr deposition in the
monitoring period) in mainland Norway. The unit is mg N/m2 year. From Hole and
Tørseth (2002). Precipitation zones from Hanssen-Bauer (2005) are also indicated.
2.3 Statistical method
Precipitation data from seven monitoring stations are presented here as monthly values in
winter (December-February) and summer (June-August). In this way we can see seasonal
differences since strong anticyclones in the Atlantic with westerlies are particularly common
in winter during negative NAOI events. Precipitation concentrations were weighted
according to precipitation amount. Existence of a monotonic increasing or decreasing trend
in the time series 1980-2005 and 1990-2005 was tested with the nonparametric Mann-Kendall
test at the 10% significance level as a two-tailed test (Gilbert, 1987). Some of the stations
opened in the 1970s, but we choose to test for the same periods at all stations to be able to
compare trends. An estimate for the slope of a linear trend was calculated with the
nonparametric Sen’s method (Sen, 1968). The Sen’s method is not greatly affected by data
outliers, and it can be used when data are missing (Salmi et al., 2002).
It is likely that significant trends in deposition are partly a result of changes in emissions.
However, it is not obvious which emission areas contribute to deposition in Norway, even
though a sector analysis has been carried out for parts of the period studied (Tørseth et al,
Climate Change and Variability100
2001). The relative contribution could also vary from year to year depending on transport
climate. Here, we have tested whether removing significant trends in the data have any
influence on the correlations we observe.
Fig. 2. Monthly average NO
3
wet deposition summer and winter (mg/m
2
). Solid lines are
1990-2005 trends, dashed lines are 1980-2005 trends.
2.4. Observed trends
Significant Sen slopes (10% level) in nitrate and ammonia deposition for 1980-2005 and 1990-
2005 are shown in Figures 2-3. Trends in nitrate concentrations since 1980 corresponds to a
reduction of up to 50% at Kårvatn in summer (Aas et al, 2006) and less at the other stations.
For the longest period, there are negative trends (summer, winter or both) in nitrate wet
deposition at five out of seven sites. For the shortest period there are negative trends in
nitrate wet deposition at four of seven sites, including the most coastal site (Haukeland),
where there is also a very strong increase in summer precipitation (32 mm/decade). For the
longest period there are few sites with significant trends in nitrate wet deposition and this
could be caused by increasing precipitation in the period, although the data analysed here
show significant increase in precipitation at only three sites. For 1990- 2005 decreasing
nitrate concentration in precipitation is accompanied by decreasing nitrate wet deposition
only at the driest site (Langtjern). The positive trend in ammonia wet deposition at
Tustervatn could be caused by changes in local farming activity. We should keep in mind
that the 25 year studied here is a very short time to detect climatic trends, since there is
much variability on decadal scale (Hanssen-Bauer, 2005).
Fig. 3. Monthly average NH4 wet deposition summer and winter (mg/m2). Solid lines are
1990-2005 trends, dashed lines are 1980-2005 trends.
2.5 Climate indices and connection to concentrations, precipitation and deposition
First, we test correlations between Nr concentrations and climate indices. For most stations
there was no correlation. The strongest correlation found was R=-0.45 for nitrate
concentration and NAOI at Haukeland in winter. Nitrate wet deposition at the western sites
(Haukeland and Skreådalen) are well correlated with NAOI and strongest in winter (R=0.60
at Skreådalen) (Table 1). A cluster analysis where the western sites are combined gives
R=0.56 for the western sites in winter, and a much lower correlation (R=0.22) for the
southern sites (Birkenes and Treungen). For precipitation the corresponding correlations
coefficients are 0.75 and 0.38 respectively. Interestingly AOI has a similar regional
correlation pattern, but it has a higher correlation at the northern site Tustervatn (R = 0.47 in
winter). This regional pattern reflexes the correlation with precipitation in which again
corresponds well with Hanssen-Bauer (2005). High correlations with NAOI and AOI in
winter is not surprising since strong cyclonic systems in the Atlantic leads to high
precipitation at the west coast. Local air temperature is also strongly correlated with winter
nitrate wet
Inuence of climate variability on reactive nitrogen deposition in temperate and Arctic climate 101
2001). The relative contribution could also vary from year to year depending on transport
climate. Here, we have tested whether removing significant trends in the data have any
influence on the correlations we observe.
Fig. 2. Monthly average NO
3
wet deposition summer and winter (mg/m
2
). Solid lines are
1990-2005 trends, dashed lines are 1980-2005 trends.
2.4. Observed trends
Significant Sen slopes (10% level) in nitrate and ammonia deposition for 1980-2005 and 1990-
2005 are shown in Figures 2-3. Trends in nitrate concentrations since 1980 corresponds to a
reduction of up to 50% at Kårvatn in summer (Aas et al, 2006) and less at the other stations.
For the longest period, there are negative trends (summer, winter or both) in nitrate wet
deposition at five out of seven sites. For the shortest period there are negative trends in
nitrate wet deposition at four of seven sites, including the most coastal site (Haukeland),
where there is also a very strong increase in summer precipitation (32 mm/decade). For the
longest period there are few sites with significant trends in nitrate wet deposition and this
could be caused by increasing precipitation in the period, although the data analysed here
show significant increase in precipitation at only three sites. For 1990- 2005 decreasing
nitrate concentration in precipitation is accompanied by decreasing nitrate wet deposition
only at the driest site (Langtjern). The positive trend in ammonia wet deposition at
Tustervatn could be caused by changes in local farming activity. We should keep in mind
that the 25 year studied here is a very short time to detect climatic trends, since there is
much variability on decadal scale (Hanssen-Bauer, 2005).
Fig. 3. Monthly average NH4 wet deposition summer and winter (mg/m2). Solid lines are
1990-2005 trends, dashed lines are 1980-2005 trends.
2.5 Climate indices and connection to concentrations, precipitation and deposition
First, we test correlations between Nr concentrations and climate indices. For most stations
there was no correlation. The strongest correlation found was R=-0.45 for nitrate
concentration and NAOI at Haukeland in winter. Nitrate wet deposition at the western sites
(Haukeland and Skreådalen) are well correlated with NAOI and strongest in winter (R=0.60
at Skreådalen) (Table 1). A cluster analysis where the western sites are combined gives
R=0.56 for the western sites in winter, and a much lower correlation (R=0.22) for the
southern sites (Birkenes and Treungen). For precipitation the corresponding correlations
coefficients are 0.75 and 0.38 respectively. Interestingly AOI has a similar regional
correlation pattern, but it has a higher correlation at the northern site Tustervatn (R = 0.47 in
winter). This regional pattern reflexes the correlation with precipitation in which again
corresponds well with Hanssen-Bauer (2005). High correlations with NAOI and AOI in
winter is not surprising since strong cyclonic systems in the Atlantic leads to high
precipitation at the west coast. Local air temperature is also strongly correlated with winter
nitrate wet
Climate Change and Variability102
Station name NAOI AOI European
blocking
Scandinavian
blocking
East Atlantic
blocking
Birkenes 0.15 -0.01 -0.06 0.31
Summer
Treungen 0.09 0 0.01 0.24
Langtjern 0.10 -0.03 -0.05 0.11
Kårvatn 0.20 0.21 -0.20 0.08
Haukeland 0.46 0.30 -0.18 0.13
Skreådalen 0.38 0.21 -0.19 0.37
Tustervatn 0.11 0.14 0.19 -0.01
Birkenes 0.24 0.16 -0.45 0.25 0.24
Winter
Treungen 0.25 0.13 -0.47 0.25 0.23
Langtjern 0.21 0.06 -0.46 0.23 0.32
Kårvatn 0.04 0.16 0.14 -0.27 -0.15
Haukeland 0.53 0.60 0.13 -0.20 0.20
Skreådalen 0.60 0.57 -0.20 -0.22 0.39
Tustervatn 0.28 0.47 0.24 -0.12 0.22
Table 1. Correlation coefficients, R, for nitrate deposition vs climate indices 1980-2005.
deposition at the coastal sites (R=0.84), suggesting that mild, humid winter weather with
strong transport from west and south-west (positive NAOI) brings high deposition, mostly
as rain, and transport from the UK. For the other sites R<0.2. The European blocking index
is strongest (and negatively) correlated with winter deposition at the drier, eastern site,
Langtjern, (Table 1). This suggests that a certain orientation of the isobars brings in
precipitation from the south at these sites. The other blocking indices do not show very high
correlation with nitrate wet deposition. However, ScandI shows high correlation (R = -0.49)
with winter precipitation at Skreådalen, although much lower than NAOI (R=0.77) and AOI
(R=0.73). The pattern for ammonia wet deposition is similar and will not be discussed here.
2.6 Discussion of trend analysis and climate variability
Reductions in nitrate wet deposition are probably a consequence of emission reductions in
the EMEP area (EMEP, 2006). There has been a steady decrease in oxidised nitrogen (NOx)
emissions in most of Europe since 1990 and looking at the trend 1980-2004 the decrease has
been particularly strong in Eastern Europe. Ammonia emission estimates are highly
uncertain since agriculture is the main source. Emissions seem to be rather steady in most
areas, except in Eastern Europe where reductions have been up to 50% in the 1990s. Sutton
et al., (2003) studied trends in reduced nitrogen in different parts of Central Europe and the
UK to assess the effectiveness of ammonia abatement. For a range of countries it was shown
that atmospheric interactions complicate the expected changes, particularly since sulphur
emissions have decreased steadily in the last two decades.
Precipitation is better correlated than deposition with NAOI and AO. This is an indication
that deposition is depending more on precipitation amount than on transport sector. NAOI
seems to also partly control the variation in atmospheric nitrate concentrations (R = -0.45 at
the coastal sites), i.e. westerly wind brings lower concentrations. It is already established
that precipitation amounts, particularly on the west coast, are well correlated with NAOI
Fig. 4. Monthly average NO
3
concentration in precipitation (mg/l) vs monthly precipitation
(mm) 1980-2005.
(Hanssen-Bauer, 2005). On the other hand, it has been shown that transport from continental
Europe in south and east is likely to result in higher concentration levels than transport from
the Atlantic in west and north (Tørseth et al., 2001). Probably since emissions trends for
nitrate are relatively weak and continuous (28% reduction from maximum in 1989 to 2003) it
was not possible to establish a correlation between emissions in the EMEP area and wet
deposition here. For nitrate concentration in precipitation (Fig. 4) it is clear that the driest
months bring the highest concentrations at all sites. The negative correlation between nitrate
wet deposition and precipitation amount is weakest at the driest sites (Treungen and
Langtjern). In Norway high precipitation events are associated with weather systems with a
S component, generally SW wind on the W coast and SE wind in E Norway. We would also
expect that these directions with transport from UK and E Europe would give the highest
concentrations. Figure 4 suggests a dilution effect in rainy months. Modelling results in Hole
and Enghardt (2008) also show that the severe increase in precipitation in W Norway
expected in the coming decades (in the order of 50%) will indeed result in lower
concentrations. Because 1990 was the warmest (and consequently one of the wettest) year on
record in Norway, there are no significant trends in precipitation in 1990-2005 except for a
strong increase in winter precipitation at Kårvatn. However, there are significant reductions
in nitrate concentration in precipitation at several stations (Hole et al., 2008).
Inuence of climate variability on reactive nitrogen deposition in temperate and Arctic climate 103
Station name NAOI AOI European
blocking
Scandinavian
blocking
East Atlantic
blocking
Birkenes 0.15 -0.01 -0.06 0.31
Summer
Treungen 0.09 0 0.01 0.24
Langtjern 0.10 -0.03 -0.05 0.11
Kårvatn 0.20 0.21 -0.20 0.08
Haukeland 0.46 0.30 -0.18 0.13
Skreådalen 0.38 0.21 -0.19 0.37
Tustervatn 0.11 0.14 0.19 -0.01
Birkenes 0.24 0.16 -0.45 0.25 0.24
Winter
Treungen 0.25 0.13 -0.47 0.25 0.23
Langtjern 0.21 0.06 -0.46 0.23 0.32
Kårvatn 0.04 0.16 0.14 -0.27 -0.15
Haukeland 0.53 0.60 0.13 -0.20 0.20
Skreådalen 0.60 0.57 -0.20 -0.22 0.39
Tustervatn 0.28 0.47 0.24 -0.12 0.22
Table 1. Correlation coefficients, R, for nitrate deposition vs climate indices 1980-2005.
deposition at the coastal sites (R=0.84), suggesting that mild, humid winter weather with
strong transport from west and south-west (positive NAOI) brings high deposition, mostly
as rain, and transport from the UK. For the other sites R<0.2. The European blocking index
is strongest (and negatively) correlated with winter deposition at the drier, eastern site,
Langtjern, (Table 1). This suggests that a certain orientation of the isobars brings in
precipitation from the south at these sites. The other blocking indices do not show very high
correlation with nitrate wet deposition. However, ScandI shows high correlation (R = -0.49)
with winter precipitation at Skreådalen, although much lower than NAOI (R=0.77) and AOI
(R=0.73). The pattern for ammonia wet deposition is similar and will not be discussed here.
2.6 Discussion of trend analysis and climate variability
Reductions in nitrate wet deposition are probably a consequence of emission reductions in
the EMEP area (EMEP, 2006). There has been a steady decrease in oxidised nitrogen (NOx)
emissions in most of Europe since 1990 and looking at the trend 1980-2004 the decrease has
been particularly strong in Eastern Europe. Ammonia emission estimates are highly
uncertain since agriculture is the main source. Emissions seem to be rather steady in most
areas, except in Eastern Europe where reductions have been up to 50% in the 1990s. Sutton
et al., (2003) studied trends in reduced nitrogen in different parts of Central Europe and the
UK to assess the effectiveness of ammonia abatement. For a range of countries it was shown
that atmospheric interactions complicate the expected changes, particularly since sulphur
emissions have decreased steadily in the last two decades.
Precipitation is better correlated than deposition with NAOI and AO. This is an indication
that deposition is depending more on precipitation amount than on transport sector. NAOI
seems to also partly control the variation in atmospheric nitrate concentrations (R = -0.45 at
the coastal sites), i.e. westerly wind brings lower concentrations. It is already established
that precipitation amounts, particularly on the west coast, are well correlated with NAOI
Fig. 4. Monthly average NO
3
concentration in precipitation (mg/l) vs monthly precipitation
(mm) 1980-2005.
(Hanssen-Bauer, 2005). On the other hand, it has been shown that transport from continental
Europe in south and east is likely to result in higher concentration levels than transport from
the Atlantic in west and north (Tørseth et al., 2001). Probably since emissions trends for
nitrate are relatively weak and continuous (28% reduction from maximum in 1989 to 2003) it
was not possible to establish a correlation between emissions in the EMEP area and wet
deposition here. For nitrate concentration in precipitation (Fig. 4) it is clear that the driest
months bring the highest concentrations at all sites. The negative correlation between nitrate
wet deposition and precipitation amount is weakest at the driest sites (Treungen and
Langtjern). In Norway high precipitation events are associated with weather systems with a
S component, generally SW wind on the W coast and SE wind in E Norway. We would also
expect that these directions with transport from UK and E Europe would give the highest
concentrations. Figure 4 suggests a dilution effect in rainy months. Modelling results in Hole
and Enghardt (2008) also show that the severe increase in precipitation in W Norway
expected in the coming decades (in the order of 50%) will indeed result in lower
concentrations. Because 1990 was the warmest (and consequently one of the wettest) year on
record in Norway, there are no significant trends in precipitation in 1990-2005 except for a
strong increase in winter precipitation at Kårvatn. However, there are significant reductions
in nitrate concentration in precipitation at several stations (Hole et al., 2008).
Climate Change and Variability104
3. Trends in concentrations of sulphur and nitrogen compounds in the Arctic
3.1 Long range transport of air pollution to the Arctic
Arctic acidification in areas with both sensitive ecology and levels of acid deposition
elevated to a point that exceeds the system’s acid neutralizing capacity. Sulphur is the most
important acidifying substance in the Arctic, with nitrogen of secondary importance
(Kämäri et al., 1998). Significant anthropogenic sources of sulphur emissions, and to a lesser
extent nitrogen emissions, exist within the Arctic region. In addition, long-range transported
air pollutants contribute to acidification and Arctic haze. Emissions from natural sources
within the Arctic (volcanoes, marine algae, and forest fires) are difficult to quantify and
project (Kämäri et al., 1998).
Based on firn core analysis from the Canadian high Arctic, Barrie et al. (1985) suggested that
in the first-half of the 20th century the level of winter-time air pollution remained roughly
constant, consistent with a pattern of little change in European sulphur dioxide (SO
2
)
emissions. However, between 1956 and 1977 there was a 75% increase of Arctic air pollution
which seems to be associated with a marked increase in SO
2
and total NO
x
emissions in the
industrialized world Barrie et al. (1985). Weiler et al. (2005) analysed an ice core from a
North Siberian ice cap and found that maximum sulphate and nitrate concentrations in the
ice could be related to maximum SO
2
and NO
x
anthropogenic emissions in the 1970s,
probably caused by the nickel- and copper-producing industries in Norilsk and on the Kola
peninsula or by industrial combustion processes occurring in the Siberian Arctic. In
addition, they found that during recent decades, sulphate (SO
4
2-
) and nitrate (NO
3
-
)
concentrations declined by 80% and 60%, respectively, reflecting a decrease in
anthropogenic pollution of the Arctic basin.
Kämäri et al., (1998) concluded that there were no trends in atmospheric concentrations of
acidifying compounds in Canada and Alaska during the 1980s, but that there were
decreasing trends on Svalbard. Background data from Russia were not presented. It was
considered that about 75% of the deposition could be dry deposition, but that there was a
lack of observations and knowledge at this point. Model output for SO
2
and SO
4
2-
compared
well with time series observations series at one station (Nord, Greenland) and for long term
averages at a number of EMEP stations.
Although atmospheric lifetimes of SO
2
, NO
x
and their oxidation products are of the order of
a some days at temperate latitudes (Schwarz, 1979; Levine and Schwarz, 1982, Logan, 1983),
the atmospheric half-life of SO
4
2-
have been reported to reach even two weeks or more in
the high Arctic during winter (Barrie, 1986). The transport distances range from hundreds to
thousands of kilometres (Seinfeld and Pandis, 1998). Thus, many factors, besides the
primary emissions, affect the observed concentrations and trends of the compounds
involved in the acid deposition process, including their relative concentrations in the
atmosphere, the reversible nature of some of the reactions and the meteorological situation.
Trend analysis for several indicators of Arctic haze has been performed for the spring
months by Quinn et al. (2007). The monthly average SO
4
2-
concentration in air in March and
April has decreased in the Canadian, Norwegian and Finnish Arctic by 30-70% from the
early 1990s to early 2000. NO
3
-
concentration in air has increased by 50% in Alert, Canada
during the same period.
3.2 Monitoring Arctic air pollution
There is a lack of long time series of background concentrations in main atmospheric
compounds in the high Arctic. Also there are few stations with co-located air and
precipitation sampling. The AMAP
1
atmospheric monitoring network consist of a number of
stations spread across the Arctic. Most of these are EMEP stations that also report to the
AMAP database. In addition, a few national stations report data. Some stations have been
reporting data since the mid 1970s. As of 2002, 24 stations reported data to AMAP relevant
for acidification and eutrophication (Hole et al,. 2006a). Most stations are located in the
European sector. The nitrogen compounds in air are measured at the EMEP stations as a
sum of particulate nitrate and gas phase nitric acid and, respectively, a sum of particulate
ammonium and gas phase ammonia. They are referred later in the text as total nitrate and
total ammonium in air. The station Alert measure particulate nitrate and ammonium.
The Russian national network for monitoring of precipitation chemical composition and
acidity consists of 110 monitoring stations. Precipitation samples collected at these stations
are then analysed in regional analytical laboratories for the main atmospheric compounds.
The coordinating and analytical centre for the precipitation chemistry monitoring network is
the Voieykov Main Geophysical Observatory, Roshydromet whose data are mainly used for
this article. In addition to these stations, there are 105 monitoring sites where only pH value
is analysed. Stations are unevenly distributed over the territory of Russia. Less than 40% of
the stations are situated in the vast Siberian region. The period of observations reaches up to
40 years for some stations. For analysis of the acid precipitation and acidity we have used
nine background monitoring stations situated in the Russian Arctic. For these stations,
average summer (June-August) and winter (December-February) values were reported.
Except for the two EMEP-stations reported here (Janiskoski and Pinega), there are no
background air concentrations monitoring sites situated in the Arctic region of Russia.
As pointed out by MacDonald et al. (2005), detection of recent trends in the Arctic is difficult
due to the combination of short or incomplete data records at some sites and interference
from natural variations on seasonal, annual and decadal timescales (Quinn et al., 2007). In
order to remove seasonal variability from the trend analyses, we focus here on monthly
concentrations for winter (December-February) and summer (June-August) separately.
It is likely that significant trends in deposition are partly a result of changes in emissions.
However, it is not obvious which emission areas contribute to deposition. The relative
contributions of different regions could also vary from year to year depending on
atmospheric transport paths.
3.3 Description of Danish Eulerian Hemispherical Model
The Danish Eulerian Hemispheric Model (DEHM) system consists of a weather forecast
model, the PSU/NCAR Mesoscale Model version 5 (MM5) modelling subsystem (see Grell
et al, 1994), which is driven by meteorological data from ECMWF, and a 3-D atmospheric
transport model, the DEHM model. The model has a horizontal resolution of 150 km x 150
km and 20 irregularly spaced vertical layers up to 16 km. The coverage is close to
hemispheric from nearly 10 degrees N at the corners and 25 degrees N at midpoints of the
model domain boundaries.
The original version of the DEHM model was developed for studying the long-range
1 Arctic Monitoring and Assessment Programme, www.amap.no.
Inuence of climate variability on reactive nitrogen deposition in temperate and Arctic climate 105
3. Trends in concentrations of sulphur and nitrogen compounds in the Arctic
3.1 Long range transport of air pollution to the Arctic
Arctic acidification in areas with both sensitive ecology and levels of acid deposition
elevated to a point that exceeds the system’s acid neutralizing capacity. Sulphur is the most
important acidifying substance in the Arctic, with nitrogen of secondary importance
(Kämäri et al., 1998). Significant anthropogenic sources of sulphur emissions, and to a lesser
extent nitrogen emissions, exist within the Arctic region. In addition, long-range transported
air pollutants contribute to acidification and Arctic haze. Emissions from natural sources
within the Arctic (volcanoes, marine algae, and forest fires) are difficult to quantify and
project (Kämäri et al., 1998).
Based on firn core analysis from the Canadian high Arctic, Barrie et al. (1985) suggested that
in the first-half of the 20th century the level of winter-time air pollution remained roughly
constant, consistent with a pattern of little change in European sulphur dioxide (SO
2
)
emissions. However, between 1956 and 1977 there was a 75% increase of Arctic air pollution
which seems to be associated with a marked increase in SO
2
and total NO
x
emissions in the
industrialized world Barrie et al. (1985). Weiler et al. (2005) analysed an ice core from a
North Siberian ice cap and found that maximum sulphate and nitrate concentrations in the
ice could be related to maximum SO
2
and NO
x
anthropogenic emissions in the 1970s,
probably caused by the nickel- and copper-producing industries in Norilsk and on the Kola
peninsula or by industrial combustion processes occurring in the Siberian Arctic. In
addition, they found that during recent decades, sulphate (SO
4
2-
) and nitrate (NO
3
-
)
concentrations declined by 80% and 60%, respectively, reflecting a decrease in
anthropogenic pollution of the Arctic basin.
Kämäri et al., (1998) concluded that there were no trends in atmospheric concentrations of
acidifying compounds in Canada and Alaska during the 1980s, but that there were
decreasing trends on Svalbard. Background data from Russia were not presented. It was
considered that about 75% of the deposition could be dry deposition, but that there was a
lack of observations and knowledge at this point. Model output for SO
2
and SO
4
2-
compared
well with time series observations series at one station (Nord, Greenland) and for long term
averages at a number of EMEP stations.
Although atmospheric lifetimes of SO
2
, NO
x
and their oxidation products are of the order of
a some days at temperate latitudes (Schwarz, 1979; Levine and Schwarz, 1982, Logan, 1983),
the atmospheric half-life of SO
4
2-
have been reported to reach even two weeks or more in
the high Arctic during winter (Barrie, 1986). The transport distances range from hundreds to
thousands of kilometres (Seinfeld and Pandis, 1998). Thus, many factors, besides the
primary emissions, affect the observed concentrations and trends of the compounds
involved in the acid deposition process, including their relative concentrations in the
atmosphere, the reversible nature of some of the reactions and the meteorological situation.
Trend analysis for several indicators of Arctic haze has been performed for the spring
months by Quinn et al. (2007). The monthly average SO
4
2-
concentration in air in March and
April has decreased in the Canadian, Norwegian and Finnish Arctic by 30-70% from the
early 1990s to early 2000. NO
3
-
concentration in air has increased by 50% in Alert, Canada
during the same period.
3.2 Monitoring Arctic air pollution
There is a lack of long time series of background concentrations in main atmospheric
compounds in the high Arctic. Also there are few stations with co-located air and
precipitation sampling. The AMAP
1
atmospheric monitoring network consist of a number of
stations spread across the Arctic. Most of these are EMEP stations that also report to the
AMAP database. In addition, a few national stations report data. Some stations have been
reporting data since the mid 1970s. As of 2002, 24 stations reported data to AMAP relevant
for acidification and eutrophication (Hole et al,. 2006a). Most stations are located in the
European sector. The nitrogen compounds in air are measured at the EMEP stations as a
sum of particulate nitrate and gas phase nitric acid and, respectively, a sum of particulate
ammonium and gas phase ammonia. They are referred later in the text as total nitrate and
total ammonium in air. The station Alert measure particulate nitrate and ammonium.
The Russian national network for monitoring of precipitation chemical composition and
acidity consists of 110 monitoring stations. Precipitation samples collected at these stations
are then analysed in regional analytical laboratories for the main atmospheric compounds.
The coordinating and analytical centre for the precipitation chemistry monitoring network is
the Voieykov Main Geophysical Observatory, Roshydromet whose data are mainly used for
this article. In addition to these stations, there are 105 monitoring sites where only pH value
is analysed. Stations are unevenly distributed over the territory of Russia. Less than 40% of
the stations are situated in the vast Siberian region. The period of observations reaches up to
40 years for some stations. For analysis of the acid precipitation and acidity we have used
nine background monitoring stations situated in the Russian Arctic. For these stations,
average summer (June-August) and winter (December-February) values were reported.
Except for the two EMEP-stations reported here (Janiskoski and Pinega), there are no
background air concentrations monitoring sites situated in the Arctic region of Russia.
As pointed out by MacDonald et al. (2005), detection of recent trends in the Arctic is difficult
due to the combination of short or incomplete data records at some sites and interference
from natural variations on seasonal, annual and decadal timescales (Quinn et al., 2007). In
order to remove seasonal variability from the trend analyses, we focus here on monthly
concentrations for winter (December-February) and summer (June-August) separately.
It is likely that significant trends in deposition are partly a result of changes in emissions.
However, it is not obvious which emission areas contribute to deposition. The relative
contributions of different regions could also vary from year to year depending on
atmospheric transport paths.
3.3 Description of Danish Eulerian Hemispherical Model
The Danish Eulerian Hemispheric Model (DEHM) system consists of a weather forecast
model, the PSU/NCAR Mesoscale Model version 5 (MM5) modelling subsystem (see Grell
et al, 1994), which is driven by meteorological data from ECMWF, and a 3-D atmospheric
transport model, the DEHM model. The model has a horizontal resolution of 150 km x 150
km and 20 irregularly spaced vertical layers up to 16 km. The coverage is close to
hemispheric from nearly 10 degrees N at the corners and 25 degrees N at midpoints of the
model domain boundaries.
The original version of the DEHM model was developed for studying the long-range
1 Arctic Monitoring and Assessment Programme, www.amap.no.
Climate Change and Variability106
transport of SO
2
, SO
4
2-
and Pb to the Arctic (Christensen, 1997) and has been used since 1991.
The sulphur version has been used in the first and the second phase of the AMAP program
(see Kämäri et al., 1998, Hole et al., 2006a, 2006b) and the Pb version was used in the last
AMAP heavy metal assessment. It has been further developed to study transport,
transformation and deposition of reactive and elemental mercury, and this version was also
used in the heavy metal assessment, see also (Heidam et al. (2004). Other versions calculate
the concentrations and depositions of various pollutants (Frohn et al., 2002) through the
inclusion of the extensive chemistry scheme, and transport and exchange of atmospheric
carbon dioxide (Geels et al., 2004) and Persistant Organic Pollutants (Hansen et al, 2004).
In this work we are using the extensive chemical version which includes 63 species of which
4 relate to primary particulates (PM25, PM10, TSP and sea salt), other species are SO
x
, NO
x
,
total reduced nitrogen (NH
y
), VOC’s and secondary inorganic particulates (Frohn et al,
2003). The chemical scheme was based on a scheme with 51 species presented in Flatøy and
Hov, 1996, which were an ozone chemistry scheme with most of the important inorganic
species and as well the most abundant hydrocarbons (explicit treatment of alkanes up to C4,
longer alkanes lumped, explicit treatment alkenes up to C3, longer alkenes lumped, xylene,
toluene and isoprene). There were added reactions to extend the chemistry to eutrophication
issues by using ammonium chemistry based on the old EMEP acidification model and
adding reactions in order extend to acidification issues by using aqueous chemistry based
on Jonson et al. (2000). The scheme contains 120 chemical reactions where 17 are photolysis
reactions calculated by the Phodis routine (Kylling et al, 1998) depending on sun-angle,
altitude, Dobson unit and 3-d cloud cover. The used chemical scheme is quite similar to the
EMEP scheme described in Simpson et al, 2006.
The dry deposition module used in the DEHM model is based on the resistance method and
is very similar to the dry deposition module of the EMEP model (for details and
documentation see Simpson et al., 2006). This module calculates deposition of both gaseous
species and particulates to 16 different land-use categories based on Olson World Ecosystem
Classes, version 1.4D. The dry depositions of gaseous species to water surfaces are
depending on the wind speed (surface roughness) and on solubility of the chemical species
(see Hertel et al., 1995).
Wet deposition is parameterized by a scavenging ratio formulation, where the scavenging is
divided into two contributions. The first contribution is the in-cloud scavenging, which
represents the uptake in droplets inside a cloud. The second contribution originates from
precipitation events and is uptake in droplets below the cloud base. The scavenging
coefficients are also very similar to the EMEP model. Further information about the model
run and emission data applied can be found in Hole et al., 2009.
3.4 Trends in concentrations in air and precipitation, 1980-2005 and 1990-2005
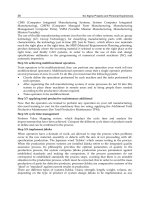
Figure 5 shows summer and winter trends after 1990 for non sea salt SO
4
2-
and NH
4
+
in
precipitation. For the SO
4
2-
concentration, the values are usually higher during summer
months than during winter months. Low concentrations are measured at the Oulanka,
Pinega and Snare Rapids stations.
Fig. 5. Significant trends (within 10%) in SO
4
2-
and NH
4
+
in precipitation after 1990 for
winter (December-February) and summer (June-August). No trend is shown as green. NO3
-
is not shown because of few significant trends. Units are mg S l
-1
and mg N l-1.
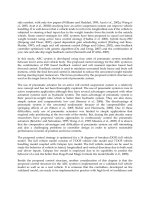
Fig. 6. Development of SOx, NOx and NHy concentration in air and dry+wet deposition
north of the Arctic circle from industrialization to 2020. Solid lines: Business as Usual
scenario (BAU). Dashed lines: Most Feasible Reduction scenario (MFR).
Inuence of climate variability on reactive nitrogen deposition in temperate and Arctic climate 107
transport of SO
2
, SO
4
2-
and Pb to the Arctic (Christensen, 1997) and has been used since 1991.
The sulphur version has been used in the first and the second phase of the AMAP program
(see Kämäri et al., 1998, Hole et al., 2006a, 2006b) and the Pb version was used in the last
AMAP heavy metal assessment. It has been further developed to study transport,
transformation and deposition of reactive and elemental mercury, and this version was also
used in the heavy metal assessment, see also (Heidam et al. (2004). Other versions calculate
the concentrations and depositions of various pollutants (Frohn et al., 2002) through the
inclusion of the extensive chemistry scheme, and transport and exchange of atmospheric
carbon dioxide (Geels et al., 2004) and Persistant Organic Pollutants (Hansen et al, 2004).
In this work we are using the extensive chemical version which includes 63 species of which
4 relate to primary particulates (PM25, PM10, TSP and sea salt), other species are SO
x
, NO
x
,
total reduced nitrogen (NH
y
), VOC’s and secondary inorganic particulates (Frohn et al,
2003). The chemical scheme was based on a scheme with 51 species presented in Flatøy and
Hov, 1996, which were an ozone chemistry scheme with most of the important inorganic
species and as well the most abundant hydrocarbons (explicit treatment of alkanes up to C4,
longer alkanes lumped, explicit treatment alkenes up to C3, longer alkenes lumped, xylene,
toluene and isoprene). There were added reactions to extend the chemistry to eutrophication
issues by using ammonium chemistry based on the old EMEP acidification model and
adding reactions in order extend to acidification issues by using aqueous chemistry based
on Jonson et al. (2000). The scheme contains 120 chemical reactions where 17 are photolysis
reactions calculated by the Phodis routine (Kylling et al, 1998) depending on sun-angle,
altitude, Dobson unit and 3-d cloud cover. The used chemical scheme is quite similar to the
EMEP scheme described in Simpson et al, 2006.
The dry deposition module used in the DEHM model is based on the resistance method and
is very similar to the dry deposition module of the EMEP model (for details and
documentation see Simpson et al., 2006). This module calculates deposition of both gaseous
species and particulates to 16 different land-use categories based on Olson World Ecosystem
Classes, version 1.4D. The dry depositions of gaseous species to water surfaces are
depending on the wind speed (surface roughness) and on solubility of the chemical species
(see Hertel et al., 1995).
Wet deposition is parameterized by a scavenging ratio formulation, where the scavenging is
divided into two contributions. The first contribution is the in-cloud scavenging, which
represents the uptake in droplets inside a cloud. The second contribution originates from
precipitation events and is uptake in droplets below the cloud base. The scavenging
coefficients are also very similar to the EMEP model. Further information about the model
run and emission data applied can be found in Hole et al., 2009.
3.4 Trends in concentrations in air and precipitation, 1980-2005 and 1990-2005
Figure 5 shows summer and winter trends after 1990 for non sea salt SO
4
2-
and NH
4
+
in
precipitation. For the SO
4
2-
concentration, the values are usually higher during summer
months than during winter months. Low concentrations are measured at the Oulanka,
Pinega and Snare Rapids stations.
Fig. 5. Significant trends (within 10%) in SO
4
2-
and NH
4
+
in precipitation after 1990 for
winter (December-February) and summer (June-August). No trend is shown as green. NO3
-
is not shown because of few significant trends. Units are mg S l
-1
and mg N l-1.
Fig. 6. Development of SOx, NOx and NHy concentration in air and dry+wet deposition
north of the Arctic circle from industrialization to 2020. Solid lines: Business as Usual
scenario (BAU). Dashed lines: Most Feasible Reduction scenario (MFR).
Climate Change and Variability108
The level of the monthly SO
4
2-
concentration in the beginning of the monitoring period is
higher than at the end of the period but there is not a significant trend at all of the stations.
For the NO
3
-
concentration, values are on the contrary higher during the winter months than
during the summer months (Hole et al. (2009)). The inter annual variation in the NO
3
-
concentration is larger than in the sulphate concentration. The level of the nitrate
concentration at the end of the monitoring period is lower than in the beginning at only the
Pinega station. At the Jäniskoski station, the concentration has increased during the winter
months. There are increasing trends in sulphate in precipitation at Ust-Moma in east Siberia
in winter but at this station background concentrations are very low. This could be due to
changes in Norilsk (NE Siberia, 69°21’ N 88°12’ E) emission or variability in transport
pattern (Hole et al., 2006b). However, Norilsk emissions are not well quantified, so no clear
conclusions can be drawn.
SO
4
2-
concentrations measured in air at monitoring stations in the High Arctic (Alert,
Canada; and Zeppelin, Svalbard) and at several monitoring stations in subarctic areas of
Fennoscandia and northwestern Russia show decreasing trends since the 1990s, which
corresponds well with Quinn et al. (2007). At many stations there are significant downward
trends for SO
4
2-
and SO
2
in air, both summer and winter. There are significant reductions of
SO
2
in Svanvik probably because emissions in the area are strongly reduced. For the air
concentration of the nitrogen compounds there is no clear pattern, but it is interesting to see
a positive trend in summer total NO
3
-
concentration at 3 stations. Total ammonium in air
also has both positive and negative trends in summer.
3.5 Historical and expected trends 2000-2030 with “constant” climate
The DEHM model with extensive chemistry has been run with two different emissions
scenarios: The “Business As Usual” (BAU) and the “Maximum technically Feasible
Reduction” (MFR), as described in in Hole et al. (2006b). For each emission scenario the
DEHM model has been run for the same meteorological input for the period 1991-1993 in
order to reduce the meteorological variations of the model results. The pollution penetrates
further north in the eastern Arctic compared to the western Arctic. This is in accordance
with Stohl (2006) and Iversen and Jordanger (1985) and is a result of differences in
circulation patterns and higher temperatures in the Barents sea region which allows air
masses from temperate regions to move to higher latitudes without being lifted.
In Fig. 6 we present the overall development of concentration and deposition of SO
x
and
NOx and NHy in the Arctic since 1860, based on DEHM model runs and emission climate
data as described earlier. The patterns for NHy and NOx are very similar to each other. It is
not clear why concentrations and deposition do not have exactly the same development, but
changes in temperature and precipitation patterns will influence the historical deposition
development. This development with an accelarating depositon during the 19
th
century and
a decline after about 1980, corresponds well with ice core observations such as Weiler et al.,
2005.
4. Climate change impact on future atmospheric nitrogen deposition in a
temperate climate
4.1 Background
Climate change, with increased air temperatures and changed precipitation patterns, is likely to
affect the biogeochemical nitrogen (N) cycle in northwestern Europe significantly (deWit et al.,
2008). The >40 years of historical weather data (ERA40) and dynamically downscaled climate
scenarios for Europe to the year 2100 have been used to assess the linkage between climate
variability and N deposition by means of the MATCH (Multi-scale Atmospheric Transport and
Chemistry) model (Hole & Enghardt, 2008).
Total nitrate (NO
3
)and total ammonium (NH
4
) concentrations in precipitation decreased
significantly at the Swedish EMEP stations from the mid 1980s to 2000 (Lövblad et al., 2004).
During the same period the pH of precipitation increased from ~4.2 to 4.6. Data from the national
throughfall network (Nettelblad et al., 2005) measurements of air- and precipitation chemistry at
around 100 sites across Sweden confirm the downward trend in concentrations of NO
3
and NH
4
in rain. The trend was particularly pronounced in southern Sweden. Due to increasing
precipitation amounts during the same period, however, the total deposition of reactive nitrogen
(NO
3
and NH
4
) has not decreased; instead it has remained roughly unchanged.
Increasing precipitation in a region will obviously result in increasing wet deposition if
atmospheric N concentrations are unchanged. Altered precipitation patterns and temperatures
are also likely to affect mobilisation of N pools in the soil and runoff to rivers, lakes and fjords (de
Wit et al., 2008). Since many aquatic ecosystems in Scandinavia are N limited, increasing N
fertilization will disturb the natural biological activity.
In the following we focus on future N deposition in northern Europe (Fennoscandia and the
Baltic countries) as a result of future climate change. There are substantial regional differences in
factors such as topography, annual mean temperature and precipitation in this area, and hence a
regional discussion is required. Our purposes are to examine (1) regional and seasonal
differences in climate change effects on nitrogen deposition, (2) whether changes in wet
deposition are proportional to changes in precipitation, and (3) the distribution between dry and
wet deposition. The MATCH model and the experimental set-up applied is described in Hole &
Enghardt (2008) and references therein.
4.2 Deposition in future climate – comparison with current climate
Figures 7 and 8 show the calculated relative change in annual mean deposition of NO
y
and NH
x
over northern Europe. The figures display the difference of the 30-year mean of annually
accumulated deposition during a future 30-year period minus the 30-year period labelled
“current climate” normalised by the “current climate”.
The Norwegian coast will experience a large increase in total N deposition due to increased
precipitation projected by the present climate change scenario (ECHAM4/OPYC3–RCA3, SRES
A2). The changes are most likely connected to the projected changes in precipitation in northern
Europe. On an annual basis the whole of Fennoscandia is expected to receive more precipitation
in 2071-2100 compared to “current climate”.
The deposition of NO
y
and NH
x
display similar increasing trends along the coast of Norway. In
northern Fennoscandia and in parts of southeast Sweden NH
x
decreases, while NO
y
is projected
to increase. East and south of the Baltic Sea, the increase in NH
x
deposition is much smaller than
the increase in NO
y
deposition. This is mostly because scavenging of NH
x
is more effective in
Inuence of climate variability on reactive nitrogen deposition in temperate and Arctic climate 109
The level of the monthly SO
4
2-
concentration in the beginning of the monitoring period is
higher than at the end of the period but there is not a significant trend at all of the stations.
For the NO
3
-
concentration, values are on the contrary higher during the winter months than
during the summer months (Hole et al. (2009)). The inter annual variation in the NO
3
-
concentration is larger than in the sulphate concentration. The level of the nitrate
concentration at the end of the monitoring period is lower than in the beginning at only the
Pinega station. At the Jäniskoski station, the concentration has increased during the winter
months. There are increasing trends in sulphate in precipitation at Ust-Moma in east Siberia
in winter but at this station background concentrations are very low. This could be due to
changes in Norilsk (NE Siberia, 69°21’ N 88°12’ E) emission or variability in transport
pattern (Hole et al., 2006b). However, Norilsk emissions are not well quantified, so no clear
conclusions can be drawn.
SO
4
2-
concentrations measured in air at monitoring stations in the High Arctic (Alert,
Canada; and Zeppelin, Svalbard) and at several monitoring stations in subarctic areas of
Fennoscandia and northwestern Russia show decreasing trends since the 1990s, which
corresponds well with Quinn et al. (2007). At many stations there are significant downward
trends for SO
4
2-
and SO
2
in air, both summer and winter. There are significant reductions of
SO
2
in Svanvik probably because emissions in the area are strongly reduced. For the air
concentration of the nitrogen compounds there is no clear pattern, but it is interesting to see
a positive trend in summer total NO
3
-
concentration at 3 stations. Total ammonium in air
also has both positive and negative trends in summer.
3.5 Historical and expected trends 2000-2030 with “constant” climate
The DEHM model with extensive chemistry has been run with two different emissions
scenarios: The “Business As Usual” (BAU) and the “Maximum technically Feasible
Reduction” (MFR), as described in in Hole et al. (2006b). For each emission scenario the
DEHM model has been run for the same meteorological input for the period 1991-1993 in
order to reduce the meteorological variations of the model results. The pollution penetrates
further north in the eastern Arctic compared to the western Arctic. This is in accordance
with Stohl (2006) and Iversen and Jordanger (1985) and is a result of differences in
circulation patterns and higher temperatures in the Barents sea region which allows air
masses from temperate regions to move to higher latitudes without being lifted.
In Fig. 6 we present the overall development of concentration and deposition of SO
x
and
NOx and NHy in the Arctic since 1860, based on DEHM model runs and emission climate
data as described earlier. The patterns for NHy and NOx are very similar to each other. It is
not clear why concentrations and deposition do not have exactly the same development, but
changes in temperature and precipitation patterns will influence the historical deposition
development. This development with an accelarating depositon during the 19
th
century and
a decline after about 1980, corresponds well with ice core observations such as Weiler et al.,
2005.
4. Climate change impact on future atmospheric nitrogen deposition in a
temperate climate
4.1 Background
Climate change, with increased air temperatures and changed precipitation patterns, is likely to
affect the biogeochemical nitrogen (N) cycle in northwestern Europe significantly (deWit et al.,
2008). The >40 years of historical weather data (ERA40) and dynamically downscaled climate
scenarios for Europe to the year 2100 have been used to assess the linkage between climate
variability and N deposition by means of the MATCH (Multi-scale Atmospheric Transport and
Chemistry) model (Hole & Enghardt, 2008).
Total nitrate (NO
3
)and total ammonium (NH
4
) concentrations in precipitation decreased
significantly at the Swedish EMEP stations from the mid 1980s to 2000 (Lövblad et al., 2004).
During the same period the pH of precipitation increased from ~4.2 to 4.6. Data from the national
throughfall network (Nettelblad et al., 2005) measurements of air- and precipitation chemistry at
around 100 sites across Sweden confirm the downward trend in concentrations of NO
3
and NH
4
in rain. The trend was particularly pronounced in southern Sweden. Due to increasing
precipitation amounts during the same period, however, the total deposition of reactive nitrogen
(NO
3
and NH
4
) has not decreased; instead it has remained roughly unchanged.
Increasing precipitation in a region will obviously result in increasing wet deposition if
atmospheric N concentrations are unchanged. Altered precipitation patterns and temperatures
are also likely to affect mobilisation of N pools in the soil and runoff to rivers, lakes and fjords (de
Wit et al., 2008). Since many aquatic ecosystems in Scandinavia are N limited, increasing N
fertilization will disturb the natural biological activity.
In the following we focus on future N deposition in northern Europe (Fennoscandia and the
Baltic countries) as a result of future climate change. There are substantial regional differences in
factors such as topography, annual mean temperature and precipitation in this area, and hence a
regional discussion is required. Our purposes are to examine (1) regional and seasonal
differences in climate change effects on nitrogen deposition, (2) whether changes in wet
deposition are proportional to changes in precipitation, and (3) the distribution between dry and
wet deposition. The MATCH model and the experimental set-up applied is described in Hole &
Enghardt (2008) and references therein.
4.2 Deposition in future climate – comparison with current climate
Figures 7 and 8 show the calculated relative change in annual mean deposition of NO
y
and NH
x
over northern Europe. The figures display the difference of the 30-year mean of annually
accumulated deposition during a future 30-year period minus the 30-year period labelled
“current climate” normalised by the “current climate”.
The Norwegian coast will experience a large increase in total N deposition due to increased
precipitation projected by the present climate change scenario (ECHAM4/OPYC3–RCA3, SRES
A2). The changes are most likely connected to the projected changes in precipitation in northern
Europe. On an annual basis the whole of Fennoscandia is expected to receive more precipitation
in 2071-2100 compared to “current climate”.
The deposition of NO
y
and NH
x
display similar increasing trends along the coast of Norway. In
northern Fennoscandia and in parts of southeast Sweden NH
x
decreases, while NO
y
is projected
to increase. East and south of the Baltic Sea, the increase in NH
x
deposition is much smaller than
the increase in NO
y
deposition. This is mostly because scavenging of NH
x
is more effective in
Climate Change and Variability110
source areas than scavenging of NO
y
.
Fig. 7. Relative change in annually accumulated deposition of oxidised nitrogen (NO
y
) from
the period 1961-1990 to 2021-2050 (top row) and from 1961-1990 to 2071-2100 (bottom row).
Left panel is total deposition, middle panel is wet deposition, right panel is dry deposition.
Fig. 8. Same as Fig. 7, but for reduced nitrogen (NH
x
).
The total deposition of NO
y
over Norway is expected to increase from 96 Gg N year
-1
during
current climate to 107 Gg N year
-1
by the year 2100 due only to changes in climate (Hole &
Enghardt, 2008). The corresponding values for Sweden are more modest, 137 Gg N year
-1
to
139 Gg N year
-1
. Finland, the Baltic countries, Poland and Denmark will also experience
increases in total NO
y
deposition. A large part of the increase in total NO
y
deposition south
and east of the Baltic is due to increased dry deposition. Reduced precipitation and
increased atmospheric lifetimes of NO
y
results in higher surface concentrations here, which
drive up the dry deposition. In Norway and Sweden the change in annual dry deposition
from current to future climate is only minor and virtually all change in total NO
y
deposition
emanates from changes in wet deposition.
The total deposition of NH
x
decreases marginally in many countries around the Baltic Sea.
Decreasing wet deposition of NH
x
causes the decrease in total deposition in Sweden, Poland
and Denmark. Norway will experience a moderate increase in total NH
x
deposition in both
during 2021-2050 and 2071-2100 compared to “current climate” (52 Gg N year
-1
and 53 Gg N
year
-1
compared to 50 Gg N year
-1
).
Trends in deposition pattern for the two compounds are not identical because primary
emissions occur in different parts of Europe and because their deposition pathways differ.
NH
x
generally has a shorter atmospheric lifetime than NO
y
; the increased scavenging over
the coast of Norway will leave very little NH
x
to be deposited in northern Finland and the
Kola Peninsula, where NH
x
emissions are minor.
The relative increase in deposition is slightly smaller than the predicted increase in
precipitation. In Fig. 9 this dilution effect for NO
y
is apparent along the Norwegian coast
(where precipitation will increase most), but further north and east it is stronger because
much of the NO
y
is scavenged out before it reaches these areas.
Fig. 9. Relative change in concentration of oxidised nitrogen in precipitation from the period
1961-1990 to 2021-2050 (left) and from 1961-1990 to 2071-2100 (right).
Inuence of climate variability on reactive nitrogen deposition in temperate and Arctic climate 111
source areas than scavenging of NO
y
.
Fig. 7. Relative change in annually accumulated deposition of oxidised nitrogen (NO
y
) from
the period 1961-1990 to 2021-2050 (top row) and from 1961-1990 to 2071-2100 (bottom row).
Left panel is total deposition, middle panel is wet deposition, right panel is dry deposition.
Fig. 8. Same as Fig. 7, but for reduced nitrogen (NH
x
).
The total deposition of NO
y
over Norway is expected to increase from 96 Gg N year
-1
during
current climate to 107 Gg N year
-1
by the year 2100 due only to changes in climate (Hole &
Enghardt, 2008). The corresponding values for Sweden are more modest, 137 Gg N year
-1
to
139 Gg N year
-1
. Finland, the Baltic countries, Poland and Denmark will also experience
increases in total NO
y
deposition. A large part of the increase in total NO
y
deposition south
and east of the Baltic is due to increased dry deposition. Reduced precipitation and
increased atmospheric lifetimes of NO
y
results in higher surface concentrations here, which
drive up the dry deposition. In Norway and Sweden the change in annual dry deposition
from current to future climate is only minor and virtually all change in total NO
y
deposition
emanates from changes in wet deposition.
The total deposition of NH
x
decreases marginally in many countries around the Baltic Sea.
Decreasing wet deposition of NH
x
causes the decrease in total deposition in Sweden, Poland
and Denmark. Norway will experience a moderate increase in total NH
x
deposition in both
during 2021-2050 and 2071-2100 compared to “current climate” (52 Gg N year
-1
and 53 Gg N
year
-1
compared to 50 Gg N year
-1
).
Trends in deposition pattern for the two compounds are not identical because primary
emissions occur in different parts of Europe and because their deposition pathways differ.
NH
x
generally has a shorter atmospheric lifetime than NO
y
; the increased scavenging over
the coast of Norway will leave very little NH
x
to be deposited in northern Finland and the
Kola Peninsula, where NH
x
emissions are minor.
The relative increase in deposition is slightly smaller than the predicted increase in
precipitation. In Fig. 9 this dilution effect for NO
y
is apparent along the Norwegian coast
(where precipitation will increase most), but further north and east it is stronger because
much of the NO
y
is scavenged out before it reaches these areas.
Fig. 9. Relative change in concentration of oxidised nitrogen in precipitation from the period
1961-1990 to 2021-2050 (left) and from 1961-1990 to 2071-2100 (right).
Climate Change and Variability112
4.3 What can we say from these model results?
The accuracy of our results is determined by the accuracy of the utilised models and the
input to the models. MATCH has been used in a number of previous studies and has proven
capable to realistically simulate most species of interest. The model has, however, always
had limitations in its capability to simulate NH
x
species. This we have attributed to
relatively larger uncertainties in the emission inventory of NH
3
and to the fact that subgrid
emission/deposition processes not fully resolved in the system.
The model (RCA3) used to create the meteorological data in the present study has been
evaluated in Kjellström et al. (2005). Using observed meteorology (ERA40 from ECMWF;
“perfect boundary condition”) on the boundaries they compare the model output with
observations from a number of different sources. The increase in resolution from ERA40
produces precipitation fields more in line with observations although many topographical
and coastal effects are still not resolved. This could explain the underestimation of
precipitation at the sites located in western Norway. The precipitation in northern Europe is
also generally overestimated in RCA3 when ECHAM4/OPYC3 is used on its boundaries.
The degree of certainty we can attribute to RCA3’s predictions of future climate is not only
dependent on the climate model’s ability to describe “current climate” and how the regional
climate will respond to the increased greenhouse gas forcing. The RCA3 results are to a
large degree forced by the boundary data from the global climate model. The EU project
PRUDENCE and BALTEX presented a wide range of possible down-scaled scenarios for
northwestern Europe showing, for example, that winter precipitation can increase by 20 to
60% in Scandinavia (see (Christensen et al., 2007) and references therein). These
uncertainties are thus of the same order of magnitude as the projected changes in N
deposition.
Estimates of precursor (NO
X
, VOCs, CO etc.) emission strengths comprise a large
uncertainty when assessing future N deposition. In order to only study the impact that
possible climate changes may have on the deposition of N species we have kept emissions at
their 2000-levels. This is a simplification and future N loading in north-western Europe will
also be affected by changes in Europe as well as America and Asia. This study has focussed
on the change in N deposition due to climate change and not evaluated the relative
importance of altered precursor emissions or changed inter-hemispheric transport. The
change in deposition over an area may not always be the result of changes in the driving
meteorology over that area. It can of course also be due to changes in atmospheric transport
pathways or deposition en route to the area under consideration.
5. Discussion and conclusions
In section 2 we studied observations of N deposition and its relation to climate variability.
We showed that 36 % of the variation in winter nitrate wet deposition is described by the
North Atlantic Oscillation Index in coastal stations, while deposition at the inland station
Langtjern seems to be more controlled by the European blocking index. The Arctic
Oscillation Index gives good correlation at the northernmost station in addition to the
coastal (western) stations. Local air temperature is highly correlated (R=0.84) with winter
nitrate deposition at the western stations, suggesting that warm, humid winter weather
results in high wet deposition. For concentrations the best correlation was found for the
coastal station Haukeland in winter (R=-0.45). In addition, there was a tendency in the data
that high precipitation resulted in lower Nr concentrations. Removing trends in the data did
not have significant influence on the correlations observed. However, a careful sector
analysis for each month and for each station could improve the understanding of the
separate effects of emission variability and climate variability on the deposition.
For the Business as Usual (BAU) emission scenarios, northern hemisphere sulphur
emissions will only decline from 52.3 mt to 51.3 mt from 2000 to 2020 (section 3). For the
Most Feasible Reduction (MFR) scenario 2020 emissions will be only 20.2 mt. However, the
two different scenarios show much smaller differences in concentration and deposition of
sulphur in the Arctic. This is because the largest potential for improvement in SO
2
emissions
is in China and SE Asia. These regions have little influence on Arctic pollution according to
Stohl (2006) and others. For oxidized and reduced nitrogen compounds there is more
reduction in the emissions in Russia and Europe in the MFR scenario, and hence the
potential for improvement in the Arctic is larger.
SO
4
2-
concentrations are decreasing significantly at many Arctic stations. For NO
3
-
and NH
4
+
the pattern is unclear (some positive and some negative trends). There are few signs of
significant trends in precipitation for the period studied here (last 3 decades). However,
expected future occurrence of rain events in both summer and winter can result in
increasing wet deposition in the Arctic (ACIA, 2004, www.amap.no/acia).
There is relatively good monitoring data coverage in Fennoscandia and on Kola peninsula in
Russia, but there are otherwise few stations for background air and precipitation
concentration measurements in the Arctic. In our observations there are few differences
between summer and winter observations, although NO
3
-
wet deposition is higher in winter
in some stations in NW Russia and Fennoscandia (Pinega, Oulanka, Bredkal and Karasjok).
The explanation for this is not clear, but in Hole et al (2006b) seasonal exposure differences
for SO
2
at Oulanka are revealed which can indicate that transport path differences are part
of the explanation for the seasonal pattern.
Because of new technologies and climate change, future emissions and deposition are
particularly uncertain due to the expected increase in human activities in the polar and sub-
polar regions. Increased extraction of natural resources and increased sea traffic can be
expected. Climate change is also likely to influence transport and deposition patterns
(ACIA, 2004, www.amap.no/acia). There is a need for a deeper insight in plans and
consequences with respect to the Arctic. Modelling results presented here seem to rule out
SE Asia as an important contributor to pollution close to the surface in the Arctic
atmosphere. This is in accordance with earlier studies (e.g. Iversen and Jordanger, 1985,
Stohl, 2006) giving thermodynamic arguments why SE Asian emissions will have minor
influence in the Arctic.
As for the relation between future Nr deposition and climate scenarios in temperate climate
(section 4), our results suggest that prediction of future Nr deposition for different climate
scenarios most of all need good predictions of precipitation amount and precipitation
distribution in space and time. Climate indices can be a tool to understand this connection.
Regional differences in the expected changes are large. This is due to expected large increase
in precipitation along the Norwegian coast, while other areas can expect much smaller
changes. Country-averaged changes are moderate. Wet deposition will increase relatively
less than precipitation because of dilution. In Norway the contribution from dry deposition
will be relatively reduced because most of the N will be effectively removed by wet
deposition. In the Baltic countries both wet and dry deposition will increase. Dry deposition
Inuence of climate variability on reactive nitrogen deposition in temperate and Arctic climate 113
4.3 What can we say from these model results?
The accuracy of our results is determined by the accuracy of the utilised models and the
input to the models. MATCH has been used in a number of previous studies and has proven
capable to realistically simulate most species of interest. The model has, however, always
had limitations in its capability to simulate NH
x
species. This we have attributed to
relatively larger uncertainties in the emission inventory of NH
3
and to the fact that subgrid
emission/deposition processes not fully resolved in the system.
The model (RCA3) used to create the meteorological data in the present study has been
evaluated in Kjellström et al. (2005). Using observed meteorology (ERA40 from ECMWF;
“perfect boundary condition”) on the boundaries they compare the model output with
observations from a number of different sources. The increase in resolution from ERA40
produces precipitation fields more in line with observations although many topographical
and coastal effects are still not resolved. This could explain the underestimation of
precipitation at the sites located in western Norway. The precipitation in northern Europe is
also generally overestimated in RCA3 when ECHAM4/OPYC3 is used on its boundaries.
The degree of certainty we can attribute to RCA3’s predictions of future climate is not only
dependent on the climate model’s ability to describe “current climate” and how the regional
climate will respond to the increased greenhouse gas forcing. The RCA3 results are to a
large degree forced by the boundary data from the global climate model. The EU project
PRUDENCE and BALTEX presented a wide range of possible down-scaled scenarios for
northwestern Europe showing, for example, that winter precipitation can increase by 20 to
60% in Scandinavia (see (Christensen et al., 2007) and references therein). These
uncertainties are thus of the same order of magnitude as the projected changes in N
deposition.
Estimates of precursor (NO
X
, VOCs, CO etc.) emission strengths comprise a large
uncertainty when assessing future N deposition. In order to only study the impact that
possible climate changes may have on the deposition of N species we have kept emissions at
their 2000-levels. This is a simplification and future N loading in north-western Europe will
also be affected by changes in Europe as well as America and Asia. This study has focussed
on the change in N deposition due to climate change and not evaluated the relative
importance of altered precursor emissions or changed inter-hemispheric transport. The
change in deposition over an area may not always be the result of changes in the driving
meteorology over that area. It can of course also be due to changes in atmospheric transport
pathways or deposition en route to the area under consideration.
5. Discussion and conclusions
In section 2 we studied observations of N deposition and its relation to climate variability.
We showed that 36 % of the variation in winter nitrate wet deposition is described by the
North Atlantic Oscillation Index in coastal stations, while deposition at the inland station
Langtjern seems to be more controlled by the European blocking index. The Arctic
Oscillation Index gives good correlation at the northernmost station in addition to the
coastal (western) stations. Local air temperature is highly correlated (R=0.84) with winter
nitrate deposition at the western stations, suggesting that warm, humid winter weather
results in high wet deposition. For concentrations the best correlation was found for the
coastal station Haukeland in winter (R=-0.45). In addition, there was a tendency in the data
that high precipitation resulted in lower Nr concentrations. Removing trends in the data did
not have significant influence on the correlations observed. However, a careful sector
analysis for each month and for each station could improve the understanding of the
separate effects of emission variability and climate variability on the deposition.
For the Business as Usual (BAU) emission scenarios, northern hemisphere sulphur
emissions will only decline from 52.3 mt to 51.3 mt from 2000 to 2020 (section 3). For the
Most Feasible Reduction (MFR) scenario 2020 emissions will be only 20.2 mt. However, the
two different scenarios show much smaller differences in concentration and deposition of
sulphur in the Arctic. This is because the largest potential for improvement in SO
2
emissions
is in China and SE Asia. These regions have little influence on Arctic pollution according to
Stohl (2006) and others. For oxidized and reduced nitrogen compounds there is more
reduction in the emissions in Russia and Europe in the MFR scenario, and hence the
potential for improvement in the Arctic is larger.
SO
4
2-
concentrations are decreasing significantly at many Arctic stations. For NO
3
-
and NH
4
+
the pattern is unclear (some positive and some negative trends). There are few signs of
significant trends in precipitation for the period studied here (last 3 decades). However,
expected future occurrence of rain events in both summer and winter can result in
increasing wet deposition in the Arctic (ACIA, 2004, www.amap.no/acia).
There is relatively good monitoring data coverage in Fennoscandia and on Kola peninsula in
Russia, but there are otherwise few stations for background air and precipitation
concentration measurements in the Arctic. In our observations there are few differences
between summer and winter observations, although NO
3
-
wet deposition is higher in winter
in some stations in NW Russia and Fennoscandia (Pinega, Oulanka, Bredkal and Karasjok).
The explanation for this is not clear, but in Hole et al (2006b) seasonal exposure differences
for SO
2
at Oulanka are revealed which can indicate that transport path differences are part
of the explanation for the seasonal pattern.
Because of new technologies and climate change, future emissions and deposition are
particularly uncertain due to the expected increase in human activities in the polar and sub-
polar regions. Increased extraction of natural resources and increased sea traffic can be
expected. Climate change is also likely to influence transport and deposition patterns
(ACIA, 2004, www.amap.no/acia). There is a need for a deeper insight in plans and
consequences with respect to the Arctic. Modelling results presented here seem to rule out
SE Asia as an important contributor to pollution close to the surface in the Arctic
atmosphere. This is in accordance with earlier studies (e.g. Iversen and Jordanger, 1985,
Stohl, 2006) giving thermodynamic arguments why SE Asian emissions will have minor
influence in the Arctic.
As for the relation between future Nr deposition and climate scenarios in temperate climate
(section 4), our results suggest that prediction of future Nr deposition for different climate
scenarios most of all need good predictions of precipitation amount and precipitation
distribution in space and time. Climate indices can be a tool to understand this connection.
Regional differences in the expected changes are large. This is due to expected large increase
in precipitation along the Norwegian coast, while other areas can expect much smaller
changes. Country-averaged changes are moderate. Wet deposition will increase relatively
less than precipitation because of dilution. In Norway the contribution from dry deposition
will be relatively reduced because most of the N will be effectively removed by wet
deposition. In the Baltic countries both wet and dry deposition will increase. Dry deposition
Climate Change and Variability114
will increase here probably because of increased occurrence of wet surfaces.
According to our model results, northwestern Europe will generally experience small
changes in N deposition as a consequence of climate change. The exception is the west coast
of Norway, which will experience an increase in N deposition of 10-20% in the period 2021-
2050 and 20-40% in 2071-2100 (compared to current climate). Although Norway as a whole
will only experience a moderate increase in N deposition of about 10%, there are large
regional differences. RCA3/MATCH forced by ECHAM4/OPYC3 (SRES A2) prescribes
that a large part of the Norwegian coast is expected to receive at least 50% increase of the
precipitation during the period 2071-2100 compared to period 1961-1990, which is in line
with other regional climate scenarios. This region has already experienced increasing
precipitation in recent decades. The total effect on soil and watercourse chemistry of the
dramatic change in these regions remains to be thoroughly understood.
Our studies shows that expected reduction in future N deposition (as a consequence of
emission reductions in Europe) could be partly offset due to increasing precipitation in some
regions in the coming century. Future long term N emissions in Europe are difficult to
predict, however, since they depend on highly uncertain factors such as the future use of
fossil fuels and farming technology. The same uncertainty obviously also applies to the
greenhouse gas emission scenarios.
6. References
Aas, W.; Solberg, S.; Berg, T.; Manø, S. & Yttri, K. E. (2006). Monitoring of long range
transported pollution in Norway. Atmospheric transport, 2005. (In Norwegian).
Norwegian Pollution Control Authority. Rapport 955/2006. TA-2180/2006. NILU OR
36/2006. www.nilu.no.
Barrie L.A., 1986. Arctic air pollution: An overview of current knowledge. Atm. Env. 20, 643-663.
Barrie, L.A.; Fisher, D. & Koerner, R.M. (2005). Twentieth century trends in Arctic air
pollution revealed by conductivity and acidity observations in snow and ice in the
Canadian High Arctic. Atmospheric Environment, 19 (12), 2055-2063.
Bobbink, R.; Hornung, M. & Roelofs, J.G.M. (1998). The effects of air-borne nitrogen
pollutants on species diversity in natural and semi-natural European vegetation.
Journal Of Ecology 86(5): 717-738.
Christensen, J. (1997). The Danish Eulerian Hemispheric Model - A Three Dimensional Air
Pollution Model Used for the Arctic. Atm. Env, 31, 4169-4191.
Christensen, J.H.; Carter, T.R.; Rummukainen M. & Amanatidis, G. (2007). Evaluating the
performance and utility of climate models: the PRUDENCE project. Climatic
Change, Vol 81. doi:10.1007/s10584-006-9211-6.
de Wit, H.A.; Hindar, A. & Hole, L. (2008). Winter climate affects long-term trends in
streamwater nitrate in acid-sensitive catchments in southern Norway. Hydrology
and Earth System Sciences, 12, 393-403.
Delwiche, C. C. (1970). The nitrogen cycle. Sci. Am. 223: 137-146, 1970.
EMEP (2006). Transboundary acidification, eutrophication and ground level ozone in
Europe since 1990 to 2004. EMEP Status Report1/2006. The Norwegian
Meteorological Institute, Oslo, EMEP/MSC-W Report 1/97
Flatøy, F. & Hov, Ø. (1996). Three-dimensional model studies of the effect of NOx emissions
from aircrafts on ozone in the upper troposphere over Europe and the North
Atlantic. J. Geophys. Res., 101, 1401-1422.
Fowler, D.; Smith, R. I.; Muller, J. B. A.; Hayman, G. & Vincent, K. J. (2006). Changes in the
atmospheric deposition of acidifying compounds in the UK between 1986 and 2001.
Env. Poll., 137(1): 15-25.
Frohn, L.M.; Christensen, J. H.; Brandt, J.; Geels, C. & Hansen, K. (2003). Validation of a 3-D
hemispheric nested air pollution model. Atmospheric Chemistry and Physics, 3,3543-3588
Frohn, L.M.; Christensen, J. H. & Brandt, J., (2002). Development and testing of numerical
methods for two-way nested air pollution modelling. Physics and Chemistry of the
Earth, Parts A/B/C, 27 (35), P. 1487-1494
Galloway, J. N.; Dentener, F. J.; Capone, D. G.; Boyer, E. W.; Howarth, R. W.; Seitzinger, S.
P.; Asner, G. P.; Cleveland, C.; Green, P.; Holland, E.; Karl, D. M.; Michaels, A. F.;
Porter, J. H. Townsend, A. & Vörösmarty, C. (2004). Nitrogen Cycles: Past, Present
and Future. Biogeochemistry 70: 153-226.
Geels, C.; Doney, S.C.; Dargaville, R. J. Brandt, J.; Christensen, J.H. (2004). Investigating the
sources of synoptic variability in atmospheric CO2 measurements over the
Northern Hemisphere continents: a regional model study. Tellus B 56 (1), 35–50.
doi:10.1111/j.1600-0889.2004.00084.x
Gilbert, R. O.: Statistical methods for environmental pollution monitoring. Van Nostrand
Reinhold , New York, 1987.
Grell, G.; J. Dudhia, and Stauffer, D. (1994). A description of the Fifth-Generation Penn
State/NCAR Mesoscale Model (MM5), NCAR Tech. Note TN-398, Natl. Cent. for
Atmos. Res., Boulder, Colo
Hansen, K.M.; Christensen, J.H.; Brandt, J.; Frohn, L.M.; & Geels, C.(2004). Modelling
atmospheric transport of α-hexachlorocyclohexane in the Northern Hemispherewith a
3-D dynamical model: DEHM-POP, Atmos. Chem. Phys., 4, 1125-1137.
Hanssen-Bauer, I. (2005). Regional temperature and precipitation series for Norway:
Analyses of time-series updated to 2004. Met.no report 15/2005.
Heidam, N.Z.; Christensen, J.; Wåhlin, P. & Skov, H. (2004). Arctic atmospheric
contaminants in NE Greenland: levels, variations, origins, transport,
transformations and trends 1990–2001 Science of The Total Environment, 331 (1-3).
Pages 5-28.
Hertel, O.; Christensen, J.; Runge, E.H.; Asman, W.A.H.; Berkowicz, R.& Hovmand, M.F.
(1995). Development and Testing of a new Variable Scale Air Pollution Model -
ACDEP. Atmospheric Environment, 29 1267-1290.
Hole, L. R. & Tørseth, K. (2002). Deposition of major inorganic compounds in Norway 1978-
1982 and 1997-2001: status and trends. Naturens tålegrenser. Norwegian Pollution
Control Authority. Report 115. NILU OR 61/2002, ISBN: 82-425-1410-0.
www.nilu.no , 2002.
Hole, L.R, Christensen, J.; Ruoho-Airola, T.; Wilson, S.; Ginzburg, V. A.; Vasilenko, V.N.;
Polishok, A.I. & Stohl, A.I. (2006). Acidifying pollutants, Arctic Haze and Acidification
in the Arctic. AMAP assessment report 2006, ch. 3, pp 11-31.
Hole, L.R. & Engardt, M.; (2008) . Climate change impact on atmospheric nitrogen
deposition in northwestern Europe – a model study. AMBIO 37 (1), 9-17.
Inuence of climate variability on reactive nitrogen deposition in temperate and Arctic climate 115
will increase here probably because of increased occurrence of wet surfaces.
According to our model results, northwestern Europe will generally experience small
changes in N deposition as a consequence of climate change. The exception is the west coast
of Norway, which will experience an increase in N deposition of 10-20% in the period 2021-
2050 and 20-40% in 2071-2100 (compared to current climate). Although Norway as a whole
will only experience a moderate increase in N deposition of about 10%, there are large
regional differences. RCA3/MATCH forced by ECHAM4/OPYC3 (SRES A2) prescribes
that a large part of the Norwegian coast is expected to receive at least 50% increase of the
precipitation during the period 2071-2100 compared to period 1961-1990, which is in line
with other regional climate scenarios. This region has already experienced increasing
precipitation in recent decades. The total effect on soil and watercourse chemistry of the
dramatic change in these regions remains to be thoroughly understood.
Our studies shows that expected reduction in future N deposition (as a consequence of
emission reductions in Europe) could be partly offset due to increasing precipitation in some
regions in the coming century. Future long term N emissions in Europe are difficult to
predict, however, since they depend on highly uncertain factors such as the future use of
fossil fuels and farming technology. The same uncertainty obviously also applies to the
greenhouse gas emission scenarios.
6. References
Aas, W.; Solberg, S.; Berg, T.; Manø, S. & Yttri, K. E. (2006). Monitoring of long range
transported pollution in Norway. Atmospheric transport, 2005. (In Norwegian).
Norwegian Pollution Control Authority. Rapport 955/2006. TA-2180/2006. NILU OR
36/2006. www.nilu.no.
Barrie L.A., 1986. Arctic air pollution: An overview of current knowledge. Atm. Env. 20, 643-663.
Barrie, L.A.; Fisher, D. & Koerner, R.M. (2005). Twentieth century trends in Arctic air
pollution revealed by conductivity and acidity observations in snow and ice in the
Canadian High Arctic. Atmospheric Environment, 19 (12), 2055-2063.
Bobbink, R.; Hornung, M. & Roelofs, J.G.M. (1998). The effects of air-borne nitrogen
pollutants on species diversity in natural and semi-natural European vegetation.
Journal Of Ecology 86(5): 717-738.
Christensen, J. (1997). The Danish Eulerian Hemispheric Model - A Three Dimensional Air
Pollution Model Used for the Arctic. Atm. Env, 31, 4169-4191.
Christensen, J.H.; Carter, T.R.; Rummukainen M. & Amanatidis, G. (2007). Evaluating the
performance and utility of climate models: the PRUDENCE project. Climatic
Change, Vol 81. doi:10.1007/s10584-006-9211-6.
de Wit, H.A.; Hindar, A. & Hole, L. (2008). Winter climate affects long-term trends in
streamwater nitrate in acid-sensitive catchments in southern Norway. Hydrology
and Earth System Sciences, 12, 393-403.
Delwiche, C. C. (1970). The nitrogen cycle. Sci. Am. 223: 137-146, 1970.
EMEP (2006). Transboundary acidification, eutrophication and ground level ozone in
Europe since 1990 to 2004. EMEP Status Report1/2006. The Norwegian
Meteorological Institute, Oslo, EMEP/MSC-W Report 1/97
Flatøy, F. & Hov, Ø. (1996). Three-dimensional model studies of the effect of NOx emissions
from aircrafts on ozone in the upper troposphere over Europe and the North
Atlantic. J. Geophys. Res., 101, 1401-1422.
Fowler, D.; Smith, R. I.; Muller, J. B. A.; Hayman, G. & Vincent, K. J. (2006). Changes in the
atmospheric deposition of acidifying compounds in the UK between 1986 and 2001.
Env. Poll., 137(1): 15-25.
Frohn, L.M.; Christensen, J. H.; Brandt, J.; Geels, C. & Hansen, K. (2003). Validation of a 3-D
hemispheric nested air pollution model. Atmospheric Chemistry and Physics, 3,3543-3588
Frohn, L.M.; Christensen, J. H. & Brandt, J., (2002). Development and testing of numerical
methods for two-way nested air pollution modelling. Physics and Chemistry of the
Earth, Parts A/B/C, 27 (35), P. 1487-1494
Galloway, J. N.; Dentener, F. J.; Capone, D. G.; Boyer, E. W.; Howarth, R. W.; Seitzinger, S.
P.; Asner, G. P.; Cleveland, C.; Green, P.; Holland, E.; Karl, D. M.; Michaels, A. F.;
Porter, J. H. Townsend, A. & Vörösmarty, C. (2004). Nitrogen Cycles: Past, Present
and Future. Biogeochemistry 70: 153-226.
Geels, C.; Doney, S.C.; Dargaville, R. J. Brandt, J.; Christensen, J.H. (2004). Investigating the
sources of synoptic variability in atmospheric CO2 measurements over the
Northern Hemisphere continents: a regional model study. Tellus B 56 (1), 35–50.
doi:10.1111/j.1600-0889.2004.00084.x
Gilbert, R. O.: Statistical methods for environmental pollution monitoring. Van Nostrand
Reinhold , New York, 1987.
Grell, G.; J. Dudhia, and Stauffer, D. (1994). A description of the Fifth-Generation Penn
State/NCAR Mesoscale Model (MM5), NCAR Tech. Note TN-398, Natl. Cent. for
Atmos. Res., Boulder, Colo
Hansen, K.M.; Christensen, J.H.; Brandt, J.; Frohn, L.M.; & Geels, C.(2004). Modelling
atmospheric transport of α-hexachlorocyclohexane in the Northern Hemispherewith a
3-D dynamical model: DEHM-POP, Atmos. Chem. Phys., 4, 1125-1137.
Hanssen-Bauer, I. (2005). Regional temperature and precipitation series for Norway:
Analyses of time-series updated to 2004. Met.no report 15/2005.
Heidam, N.Z.; Christensen, J.; Wåhlin, P. & Skov, H. (2004). Arctic atmospheric
contaminants in NE Greenland: levels, variations, origins, transport,
transformations and trends 1990–2001 Science of The Total Environment, 331 (1-3).
Pages 5-28.
Hertel, O.; Christensen, J.; Runge, E.H.; Asman, W.A.H.; Berkowicz, R.& Hovmand, M.F.
(1995). Development and Testing of a new Variable Scale Air Pollution Model -
ACDEP. Atmospheric Environment, 29 1267-1290.
Hole, L. R. & Tørseth, K. (2002). Deposition of major inorganic compounds in Norway 1978-
1982 and 1997-2001: status and trends. Naturens tålegrenser. Norwegian Pollution
Control Authority. Report 115. NILU OR 61/2002, ISBN: 82-425-1410-0.
www.nilu.no , 2002.
Hole, L.R, Christensen, J.; Ruoho-Airola, T.; Wilson, S.; Ginzburg, V. A.; Vasilenko, V.N.;
Polishok, A.I. & Stohl, A.I. (2006). Acidifying pollutants, Arctic Haze and Acidification
in the Arctic. AMAP assessment report 2006, ch. 3, pp 11-31.
Hole, L.R. & Engardt, M.; (2008) . Climate change impact on atmospheric nitrogen
deposition in northwestern Europe – a model study. AMBIO 37 (1), 9-17.
Climate Change and Variability116
Hole, L.R.; Brunner, S.H.; J.E. Hansen & L. Zhang, (2008). Low cost measurements of
nitrogen and sulphur dry deposition velocities at a semi-alpine site: Gradient
measurements and a comparison with deposition model estimates. Env. Poll., 154,
473-481. Special issue on biosphere-atmosphere fluxes, .
Hole, L.R.; Christensen, J. Forsius, M.; Nyman, M.; Stohl, A. & Wilson, S. (2006b). Sources of
acidifying pollutants and Arctic haze precursors. AMAP assessment report ,
chapter 2.
Hole, L.R.; de Wit, H.; & Aas, W. (2008). Trends in N deposition in Norway: A regional
perspective. Hydrology and Earth System Sciences 12, 405-414.
Iversen, T. & Jordanger, E. (2008). Arctic air pollution and large scale atmospheric flows,
Atm. Env., 19, 2099-2108.
Jonson, J.E. , Kylling, A. , Berntsen, T. , Isaksen, I.S.A. , Zerefos, C.S. , & Kourtidis, K. (2000),
Chemical effects of UV fluctuations inferred from total ozone and tropospheric
aerosol variations, J. Geophys. Res., 105, 14561-14574.
Kämäri, J. & Joki-Heiskala, P., (eds), (1998). AMAP assessment report ch. 9, 621-658.
Acidifying Pollutants, Arctic haze, and Acidification in the Arctic. Arctic Monitoring
and Assessment Programme, www.amap.no.
Kjellström, E.; Bärring, L.; Gollvik, S.; Hansson, U.; Jones, C.; Samuelsson, P.;
Rummukainen, M.; Ullerstig, A.; Willén, U. & Wyser, K. (2005). A 140-year
simulation of the European climate with the new version of the Rossby Centre regional
atmospheric climate model (RCA3). SMHI Reports Meteorology and Climatology No.
108, SMHI, SE-60176 Norrköping, Sweden 54 pp.
Kylling, A. , Bais, A.F. , Blumthaler, M. , Schreder, J. , Zerefos, C. S. , & Kosmidis, E. , (1998),
The effect of aerosols on solar UV irradiances during the Photochemical Activity
and Solar Radiation campaign, J. Geophys. Res., 103, 21051-26060
Langner, J.; Bergström, R. & Foltescu, V. (2005). Impact of climate change on surface ozone
and deposition of sulphur and nitrogen in Europe. Atm. Env., 39 (6), 1129-1141.
Levine S.Z. & Schwarz S.E.; (1982). In-cloud and below-cloud scavenging of nitric acid
vapor. Atm. Env. 16, 1725-1734.
Logan J.A.; (1983). Nitrogen oxides in the troposphere; global and regional budgets. J.
Geophys. Res. 88, 10785-10807.
Lövblad, G.; Henningsson, E.; Sjöberg, K.; Brorström-Lundén, E.; Lindskog, A. & Munthe, J.
(2004). Trends in Swedish background air 1980-2000. In: EMEP Assessment part II
National Contributions. (. pp. 211-220. Oslo ISBN-82-7144-032-2.
MacDonald, R.W.; Harner, T. and Fyfe, J. (2005). Recent climate change in the Arctic and its
impact on contaminant pathways and interpretation of temporal trend data. Sci.
Tot. Environ. 342, 5–86.
Nettelblad, A.; Westling, O.; Akselsson, C.; Svensson, A. & Hellsten, S. (2006). Air pollution at
forest sites – results until September 2005. (In Swedish). IVL Rapport B 1682. 50 pp. (In
Swedish).
Orsolini, Y. J. & Doblas-Reyes, F. J. (2002) Ozone signatures of climate patterns over the
Euro-Atlantic sector in the spring, Q. J. R. Meteorol. Soc., 129, 3251-3263.
Quinn PK, Shaw G, Andrews E, Dutton EG, Ruoho-Airola T, & Gong SL. (2007) Arctic haze:
current trends and knowledge gaps Tellus
B 59 (1): 99-114.
Salmi, T.; Määttä, A.; Anttila, P.; Ruoho-Airola, T. & Amnell, T. (2002). Detecting trends of
annual values of atmospheric pollutants by the Mann-Kendall test and Sen’s slope
estimates – the Excel template application MAKESENS, Publications on Air Quality,
no. 31, FMI-AQ-31, FMI, Helsinki, Finland.
Schwarz S.E. (1979). Residence times in reservoirs under non-steady-state conditions:
application to atmospheric SO2 and aerosol sulphate. Tellus 31, 520-547.
Seinfeld J.H. & Pandis S.N. (1998). Atmospheric Chemistry and Physics: From Air Pollution to
Climate Change, John Wiley & Sons, Inc., New York.
Sen P. K. (1968). Estimates of the regression coefficient based on Kendall’s tau. J. of the
American Statistical Association, 63, 1379-1389.
Simpson, D.; Fagerli, H.; Hellsten, S.; Knulst, K.; Westling, O. (2006). Comparison of
modelled and monitored deposition fluxes of sulphur and nitrogen to ICP-forest
sites in Europe. Biogeosciences 3, 337–355.
Stoddard, J. L. Long-Term Changes In Watershed Retention Of Nitrogen - Its Causes And
Aquatic Consequences (1994). Environmental Chemistry Of Lakes And Reservoirs. 237:
223-284.
Stohl, A. (2006). Characteristics of atmospheric transport into the Arctic troposphere. J.
Geophys. Res. 111, D11306, doi:10.1029/2005JD006888.
Sutton, M. A.; Asman, W. A. H.; Ellermann, T.; van Jaarsveld, J. A.; Acker, K.; Aneja, V.;
Duyzer, J.; Horvath, L.; Paramonov, S.; Mitosinkova, M.; Tang, Y. S.; Achtermann,
B.; Gauger, T.; Bartniki, J.; Neftel, A. and Erisma, J.W. (2003). Establishing the link
between ammonia emission control and measurements of reduced nitrogen
concentrations and deposition. Environ Monit. Asessm. 82:149-85.
Tietema, A.; A.W. Boxman, A.W.; Bredemeier M.; Emmett, B.A.; Moldan F.; Gundersen P.;
Schleppi P. & Wright R.F.: Nitrogen saturation experiments (NITREX) in
coniferous forest ecosystems in Europe: a summary of results. Environmental
Pollution 102: 433-437, 1998
Tørseth, K.; Aas, W. & Solberg, S. (2001). Trends in airborne sulphur and nitrogen
compounds in Norway during 1985-1996 in relation to airmass origin. Water, Air
and Soil. Poll. 130, 1493-1498
Weiler, K.; Fischer, H.; Fritzsche, Ruth, U.; Wilhelms, F. & Miller H. (2005). Glaciochemical
reconnaissance of a new ice core from Severnaya Zemlya, Eurasian Arctic. J.
Glaciology, Vol. 51, No. 172, 64-74.
Wesely M.L. & Hicks B.B. (2000). A review of the current status of knowledge on dry
deposition. Atm. Env. 34, 2261-2282.