Báo cáo hóa học: " Conductive-probe atomic force microscopy characterization of silicon nanowire" pptx
Bạn đang xem bản rút gọn của tài liệu. Xem và tải ngay bản đầy đủ của tài liệu tại đây (1.7 MB, 9 trang )
NANO EXPRESS Open Access
Conductive-probe atomic force microscopy
characterization of silicon nanowire
José Alvarez
1*
, Irène Ngo
1
, Marie-Estelle Gueunier-Farret
1
, Jean-Paul Kleider
1
, Linwei Yu
2
, Pere Rocai Cabarrocas
2
,
Simon Perraud
3
, Emmanuelle Rouvière
3
, Caroline Celle
3
, Céline Mouchet
3
, Jean-Pierre Simonato
3
Abstract
The electrical conduction properties of lateral and vertical silicon nanowires (SiNWs) were investigated using a
conductive-probe atomic force microscopy (AFM). Horizontal SiNWs, which were synthesized by the in-plane solid-
liquid-solid technique, are randomly deployed into an undop ed hydrogenated amorphous silicon layer. Loc al
current mapping shows that the wires have internal microstructures. The local current-voltage measurements on
these horizontal wires reveal a power law behavior indicating several transport regimes based on space-charge
limited conduction which can be assisted by traps in the high-bias regime (> 1 V). Vertical phosphorus-doped
SiNWs were grown by chemical vapor deposition using a gold catalyst-driving vapor-liquid-solid process on higly
n-type silicon substrates. The effect of phosphorus doping on the local contact resistance between the AFM tip
and the SiNW was put in evidence, and the SiNWs resistivity was estimated.
Introduction
Silicon nanowires (SiNWs) are promising nanostructures
which are expected to be integrated in building blocks
for future microelectronics and optoelectronics devices
[1-3]. Indeed, multiple studies have already shown the
great pote ntial of SiNWs as function al element to
develop transistors [4], biosensors [5], memory applica-
tions [6], and as electrical interconnects [7]. In addition,
SiNWs offer an interesting geometry for light trapping
and carrier collection which gives place to intensive
investigations in the photovoltaic field [8,9].
Several approaches and strategies e xist to grow,
deploy, and assemble SiNWs [10,11]. In order to guide
them, and more specifically to control the electrical
properties of SiNWs, it is required to characterize their
electronic transport properties.
Conductive-probe atomic force microscopy (CP-AFM)
[12] reveals itself as a powerful current sensing techni-
que for electrical characterizations in small-scale t ech-
nologies, which could help us to explore the electrical
properties and to reveal local conductivity fluctuations
in SiNWs.
In this study, the authors focus on the CP-AFM charac-
terization of horizontal SiNWs produced via in-plane
solid-liquid-solid (IPSLS) method and phospho rus-doped
vertical SiNWs obtained through vapor-liquid-so lid
(VLS) technique. Local resistance mapping and local
current-voltage (I-V) measurements have been performed
to evaluate the electrical properties of such semiconduct-
ing SiNWs.
Experimental details
Silicon nanowires
Horizontal SiNWs
The IPSLS [10,13,14] approach, using indium (In) cata-
lyst droplets and a hydrogenated amorphous silicon (a-
Si:H) layer, was used to grow horizontal SiNWs. More
precisely, In catalyst droplets were prepared by superfi-
cial reduction of an indium tin oxide (ITO) layer, wh ich
was then coated by an a-Si:H layer. The growth activa-
tion of SiNWs is done during an annealing process at
temperatures in the range of 300-500°C. The mechanism
for obtaining horizontal SiNWsisguidedbytheliquid
In drop which interacts with the predeposited a-Si:H
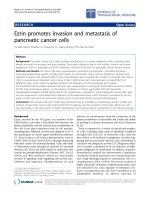
transforming it into crystalline SiNWs. Figure 1a illus-
trat es a scanning electron microscopy (SEM) image of a
horizontal Si wire of 400-nm diameter which extends
over one hundred of microns. The In catalyst is still
visible at the end of the wire.
* Correspondence:
1
Laboratoire de Génie Electrique de Paris, CNRS UMR 8507, SUPELEC, Univ P-
Sud, UPMC Univ Paris 6, 11 rue Joliot-Curie, Plateau de Moulon, 91192 Gif-
sur-Yvette Cedex, France
Full list of author information is available at the end of the article
Alvarez et al. Nanoscale Research Letters 2011, 6:110
/>© 2011 Alvarez et al; license e Springer. This is an Ope n Access article distributed under the terms of the Creative Commons Attribution
License (http://creativ ecommons.org/licenses/by/2.0) , which permits unrestricted use, distribution, and reproduction in any medium,
provided the original work is properl y cite d.
Vertical SiNWs
n-Type phosphorous-doped SiNWs were grown by che-
mical vapor deposition through the gold-ca talyzed VLS
method as described in [15,16], on n-type silicon sub-
strates (3-5 mΩ cm). The SiNW growth temperature
was in the range of 500-650°C, and the n-type doping
was achieved by adding PH
3
to SiH
4
,withPH
3
/SiH
4
ratios which can vary from 0 to 2 × 10
-2
. Subsequent to
the growth, the catalyst was removed, and in some
cases, a rapid thermal annealing at 750°C for 5 min was
done to activate dopant impurities. SiNWs wer e then
embedded into spin-on-glass matrix in order to be pla-
narized by chemical-mechanical polishing [16].
Table 1 describes the samples that were electrically
analyzed by CP-AFM. The samples were grown at the
same temperature (500°C), and they differentiate them-
selves on the nominal doping concentration. Figure 1b
illustrates a sample of vertical SiNWs on n-type Si wafer
with diameters in the range of 50-100 nm. The length
of wires after planarization was estimated around 1 μm.
Conductive-probe atomic force microscopy
Local electrical measuremen ts were performed using a
Digital Instruments Nanoscope IIIa Multimode AFM
associated with the home-made conducting probe exten-
sion called “ Resiscope” [12]. This setup allows us to
apply a stable DC bias voltage (from -10 to +10 V with
0.01Vresolution)tothedeviceandtomeasurethe
resulting current flowing through the tip as the sample
surface is scanned in contact mode. Local resistance
values can be measured in the range of 10
2
-10
12
Ω,
which allows investigations on a variety of materials
[17,18] and devices [19,20]. Measurement accuracy
based on calibrat ions is below 3% in the range of 10
2
-
10
11
Ω, and it can reach 10% for higher resistance
values.
Reliable and understandable electrical measurements
through CP-AFM setup require a well-characterized
conductive tip. Depending on the experimental condi-
tions, the AFM conductive tip should be the most suita-
ble in terms of serial resistance that must be taken into
account in the electrical analysis of SiNWs. B-doped
diamond- and PtIr-coated Si cantilevers, with an inter-
mediate spring constant of about 2 N/m, prove to be
suitable for our experimental conditions, since measured
resistance values are mostly greater than their i ntrinsic
resistances that are estimated at 5-10 and 0.3-1 kΩ,
respectively.
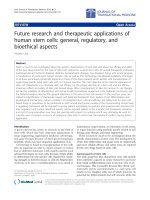
The CP-AFM details and more specifically the sample
configuration and biasing are displayed in Figure 2. In
case of horizontal SiNWs, the DC bias voltage was
applied to the ITO pad, while for vert ical SiN Ws it was
applied through the doped silicon wafer.
Results and disc ussion
Horizontal SiNWs
Figure 3 shows a large AFM scan illustrating the topo-
graphy and electrical image properties of the sample
structure based on an ITO pad (bottom of the image)
from the border of which in-plane nanowires are
Figure 1 SEM picture illustrating(a) a single horizontal Si wire and (b) a carpet of vertical SiNWs.
Table 1 Sample description of vertical SiNWs analyzed by the CP-AFM technique
Sample name Growth temp. (°C) Description Post-annealing treatment Nominal impurity concentration
CD-08-001 500 Undoped SiNWs/n-type Si (100) - Undoped
CD-08-125 500 Doped SiNWs/n-type Si (100) 5 min at 750°C [P] ≈ 1×10
18
cm
-3
CD-08-021 500 Doped SiNWs/n-type Si (100) 5 min at 750°C [P] ≈ 1×10
20
cm
-3
Alvarez et al. Nanoscale Research Letters 2011, 6:110
/>Page 2 of 9
distinguishable. In addition, the topo graphy allows it to
point out long channels that were dug during the
growth of SiNWs. Nevertheless, these long channels are
empty and indeed they are not electrically discernable
from the insulating a-Si:H layer that surro unds the
wires. On the contrary, SiNWs show electrical conduc-
tivity when the wires are not broken or disconnected
from the ITO pad.
In Figure 4, a 20 × 20 μm
2
surface scan which displays
the topography and the electrical properties of a micro-
meter-wide horizontal silicon oval shaped wire (1 μm wide
and 300 nm thick) is presented. The topography points out
an inhomogeneous surface morphology that is clearly con-
firmed by the local mapping of resistance. Indeed, conduc-
tive paths along the wire are put in evidence and linked to
the topographic features of the wire envelope. The accuracy
of these features depends essentially on convolution effects
associated to the AFM tip shape. It seems reasonable that
several SiNWs have been produced and have partially con-
tributed to the growth of this long and wide silicon wire
[10] explaining the electrical and surface microstructure.
In t he same figure, the empty growth channel result-
ing from the unexpected cut of the wire wi th the AFM
probe can also be noticed. Broken pieces of silicon
Figure 2 Sketch illustrating the details of CP-AFM measurements on (a) horizontal and (b) vertical SiNWs.
Alvarez et al. Nanoscale Research Letters 2011, 6:110
/>Page 3 of 9
Figure 3 40 × 40 μm
2
surface map illustrating the topograp hy (left side) and the local resistance (right side) of horizonta l SiNWs
grown from In droplets obtained after reduction of ITO.
Figure 4 Topography and local resistance maps illustrating a micrometer-wide horizontal silicon wire. The electrical image was obtained
under a bias of 2 V.
Alvarez et al. Nanoscale Research Letters 2011, 6:110
/>Page 4 of 9
remaining in the channel reveal a slight electrical con-
duction (10
11
Ω) although they are electrically isolated
through the undoped a-Si:H layer (10
12
Ω). Possible
explanations are that the whole surface of the remaining
piece of silicon in contact with the a-Si:H layer fully
contributes to d ecrease the electrical contact resistance
or that the friction of the AFM tip induces charging
effects which are electrically observable.
Horizontal SiNWs have also b een characterized under
different appl ied voltages. As illustrated in Figure 5, the
local resistance maps were measured in the same region
at 2, 6, and 10 V, respectively. The analysis of the elec-
trical images points out a local resistance that decreases
in function of the appl ied voltag e. More specifically, the
local resistance of SiNWs measured at 2 V decreases
one order of magnitude at 6 V and two orders of mag-
nitude at 10 V. Such behavior was also observed for
negative applied biases. An interesting observation
comes from the high bias regime (V >2V)which
underlines the increase of local resistance of the wire
Figure 5 Topography and local resistance maps depicting horizontal SiNWs randomly oriented. The electrical measurements were done
at different applied biases: 2, 6, and 10 V.
Alvarez et al. Nanoscale Research Letters 2011, 6:110
/>Page 5 of 9
versus its l ength. However, high bias regime can also
broaden the electrical images of wires.
In order to get more precise information about the
variation of the local resistance in function of the
applied bias, CP-AFM was locally used for investigating
the I-V characteristics on individual SiNWs. Figure 6
displays a log-lo g plot of the I-V characteristics where
two identifiable slopes are p ut in evidence. Indeed, the
analysis of the slopes following a power-law dependence
(I ∝ V
n
) allows us to estimate t wo transport regimes
with a transition around 1 V. The slope n =1.6(V <1
V) points out charge injection which is a characteristic
of a space-charge limited current (SCLC) [21]. The
slope n =3(V > 1 V) indicates a trap-limited SCLC,
that can be ana lyzed in the frame of a trap d istribution
with an increasing density of states toward the band
edge. Interface and surface states in low-dimensional
semiconductors such as nanowires are expected to be
the most common defects, which greatly influence the
electrical transport properties [22]. We also should keep
in mind that SiNWs were here obtained thanks to an a-
Si:H layer that is known to possess a quite large density
of states in the gap, with exponential band tails.
Vertical SiNWs
Figure7depictsa10×10μm
2
surface map that illus-
trates, from left to right, the topography and the electri-
cal properties of u ndoped SiNWs (CD-08-001). The
brightest spots (highest features) in the topography
image represent the SiNWs which are generally well
correlated with the conductive blue spots in the el ectri-
cal image. However, the zoom (4.2 × 4.2 μm
2
)allowsit
to point out sever al examples of SiNWs which are not
electrically conductive (dot-line circle) as distinct from
those showing conductive properties (full-line circle).
The oxide formation and the AFM tip loading force are
possible reasons that could explain that SiNWs appear
insulating in native.
The three samples were carefully imaged, and a statistic
was made in a few tenths of SiNWs. An example of
cross-sectional profiles involving SiNWs is illustrated in
Figure 8. The conducting wires are easily put in evidence
with a decrease of the local resistance by sev eral orders
of magnitude with respect to the background signal. For
the most highly doped sample, the local resistance of the
SiNW drops by more than six orders of magnitude,
whereas the intermediate doped and undoped samples
show a decrease of four and three orders of magnitude,
respectively. These measurements clea rly point out that
the SiNWs conductivity can be controlled by the incor-
poration of phosphorus impurities. However, the phos-
phorus doping efficiency and activation cannot be
directly discussed through such measurements. Resistiv-
ity measurements are indeed required.
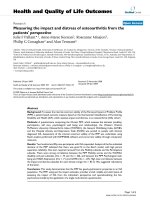
As illustrated in Figure 9, local I-V measurements
were performed for each sample on top of the SiNW
using a PtIr AFM tip. All the three samples show a lin-
ear behavior with inverse slopes of 1.9- 2.3 × 10
8
,5.3-6.7
×10
6
, and 4.5-10 × 10
4
Ω, respectively, for the undoped,
1×10
18
and 1 × 10
20
for the doped samples . These
values illustrate the total measured resistance R
tot
which
can be decomposed as follows:
RR R R R
tot AFMtip tip/SiNW SiNW back
≈+ ++,
(1)
where R
AFMtip
is the intrinsic resistance of the AFM tip,
R
tip/SiNW
refers to the contact resistance involving the
AFM tip and the SiNW, R
SiNW
designates the intrinsic
resistance of the SiNW, and R
back
the back contact resis-
tancebetweenthehighlydopedsiliconwaferandthe
SiNW. The intrinsic resistance of the SiNW (R
SiNW
)is
given by rl/S where r, l,andS are the resistivity, the
length of the wire, and the wire sectional area, respectively.
The presence of contact resistance often implies the pre-
sence of a barrier which gives rise to diode-like behavior
or sigmoidal I-V characteristics. In some cases, a linear
dependence on applied bias can be measured indicating
that the barrier resistance involved in the contact resis-
tance can be neglected. The contact resistance only con-
sists then in a geometrical resistance which depends on
the electrical radius [23]. In order to estimate the geome-
trical resistance, the Wexler resistance model [24,25] was
used, which describes the transition between the diffusive
and ballistic transport regimes in constricted contacts.
Wexler formula is described as
R
a
K
a
K
W
=+
4
32
Γ(),
(2)
Figure 6 I -V measurement on individual SiNW measured by
CP-AFM.
Alvarez et al. Nanoscale Research Letters 2011, 6:110
/>Page 6 of 9
Figure 7 Surface scan illustrating the topography (left) and the local resistance (right) performed on undoped vertical SiNWs (CD-08-
001). Image zoom shows several examples of electrically conductive (full-line circle) and non-conductive (dot-line circle) SiNWs.
Figure 8 Height and local resistance profile involving single SiNWs for different phosphorus doping levels : (a) undoped, (b) [P] ≈ 1×
10
18
cm
-3
, and (c) [P] ≈ 1×10
20
cm
-3
.
Alvarez et al. Nanoscale Research Letters 2011, 6:110
/>Page 7 of 9
where K = l/a is the ratio of the carrier mean free
path, l, to the electrical radius, a, and Γ(K) is a monoto-
nous function that takes the value 1 at K =0and
decreases slowly reaching the limit of 0.694.
For the estimation of R
tip/SiNW
, the electrical radius was
chosen equal to 10 nm, an d the electron mean free path
in the range 1-80 nm assuming bulk silicon values. From
these calculations, the resistivity values were estimated to
be in the range of 20-40 Ω cm for the undoped sample,
0.1-1.2 Ω cm for the intermediate doped sample, and
0.008-0.016 Ω cm for the highly doped sample. In terms
of electrically active phosphorus, it corresponds to 1-2 ×
10
14
,0.5-7×10
16
, and 2-6 × 10
18
cm
-3
, respectively.
These values, extract ed from bulk silicon values , indicate
that the phosphorus incorporation is not fully activated
despite the thermal anneal activation at 750° C. Recent
results of CP-AFM show that phosphorus activation in
SiNWs i s enhanced at higher temperatures growth (T >
500°C) without the need of post-annealing treatment.
From the point of view of the CP-AFM measurements
more accurate resistivity measurements could be
achieved in the future making a pre-calibration of the
technique using standard doped silicon wafers [26].
Conclusion
In this study, CP-AFM was used to electrically charac-
terize horizontal an d vertical SiNWs. CP-AFM techni-
que reveals itself as a powerful tool for se nsing current
inhomogeneities that were ob served in horizontal
SiNWs pointing ou t an internal microstructure. In addi-
tion, local I-V measurements allowed us to put in
evidence a SCLC transport regime that could be assisted
by traps.
The effect of phosphorus doping on the local contact
resistance was evidenced for verti cal SiNWs, and resis-
tivity values were estimated indicating that phosphorus
incorporation was not fully activated.
Abbreviations
CP-AFM: conductive-probe atomic force microscopy; IPSLS: in-plane solid-
liquid-solid; ITO: indium tin oxide; I-V: current-voltage; SCLC: space-charge
limited current; SEM: scanning electron microscopy; SiNWs: silicon nanowires;
VLS: vapor-liquid-solid.
Acknowledgements
This study has been supported by the French Research National Agency
(ANR) through Habitat intelligent et solaire photovoltaïque program (projet
SiFlex n°ANR-08-HABISOL-010).
Author details
1
Laboratoire de Génie Electrique de Paris, CNRS UMR 8507, SUPELEC, Univ P-
Sud, UPMC Univ Paris 6, 11 rue Joliot-Curie, Plateau de Moulon, 91192 Gif-
sur-Yvette Cedex, France
2
Laboratoire de Physique des Interfaces et des
Couches Minces, Ecole Polyte chnique, CNRS, 91128 Palaiseau, France
3
CEA,
Laboratoire des Composants pour la Récupération d’Energie (LITEN), 17 rue
des Martyrs, 38054 Grenoble Cedex 9, France
Authors’ contributions
JA carried out CP-AFM measurements and drafted the manuscript. IN
participated in the CP-AFM measurements for the horizontal SiNWs. MEGF
and JPK participated in the guidance of the study and gived the corrections
of manuscript. LY and PRIC grew the horizontal SiNWs and performed
optical characterizations. SP, ER, CC, CM and JPS grew the vertical SiNWs,
prepared them for the AFM analysis, and performed optical and electrical
characterizations.
Competing interests
The authors declare that they have no competing interests.
Figure 9 CP-AFM I-V measurements on single phosphorus-doped SiNWs for different doping levels : (a) undoped, (b) [P] ≈ 1×10
18
cm
-
3
, and (c) [P] ≈ 1×10
20
cm
-3
.
Alvarez et al. Nanoscale Research Letters 2011, 6:110
/>Page 8 of 9
Received: 12 September 2010 Accepted: 31 January 2011
Published: 31 January 2011
References
1. Hu J, Odom TW, Lieber CM: Chemistry and Physics in One Dimension:
Synthesis and Properties of Nanowires and Nanotubes. Acc Chem Res
1999, 32:435.
2. Dekker C: Carbon nanotubes as molecular quantum wires. Phys Today
1999, 52:22.
3. Cui Y, Lieber CM: Functional nanoscale electronic devices assembled
using silicon nanowire building blocks. Science 2001, 291:851.
4. Koo SM, Edelstein MD, Li Q, Richter CA, Vogel EM: Silicon nanowires as
enhancement-mode Schottky barrier field-effect transistors.
Nanotechnology 2005, 16:1482.
5. Park I, Li Z, Li X, Pisano AP, Williams RS: Towards the silicon nanowire-
based sensor for intracellular biochemical detection. Biosesen Bioelectron
2007, 22:2065.
6. Li Q, Zhu X, Xiong HD, Koo SM, Ioannou DE, Kopanski JJ, Suehle JS,
Richter CA: Silicon nanowire on oxide/nitride/oxide for memory
application. Nanotechnology 2007, 18:235204.
7. Wissner-Gross AD: Dielectrophoretic reconfiguration of nanowire
interconnects. Nanotechnology 2006, 17:4986.
8. Kelzenberg MD, Turner-Evans MD, Kayes BM, Filler MA, Putnam MC,
Lewis NS, Atwater HA: Photovoltaic measurements in single-nanowire
silicon solar cells. Nano Lett 2008, 8:710.
9. Kelzenberg MD, Boettcher SW, Petykiewicz JA, Turner-Evans DB,
Putnam MC, Warren EL, Spurgeon JM, Briggs RM, Lewis NS, Atwater HA:
Enhanced absorption and carrier collection in Si wire arrays for
photovoltaic applications. Nat Mater 2010, 9:239.
10. Yu L, Oudwan M, Moustapha O, Fortuna F, Rocai Cabarrocas P: Guided
growth of in-plane silicon nanowires. Appl Phys Lett 2009, 95:113106.
11. Wagner RS, Ellis WC: Vapor-liquid-solid mechanism of single crystal
growth. Appl Phys Lett 1964, 4:89.
12. Houzé F, Meyer R, Schneegans O, Boyer L: Imaging the local electrical
properties of metal surfaces by atomic force microscopy with
conducting probes. Appl Phys Lett 1996, 69:1975.
13. Yu L, Rocai Cabarrocas P: Initial nucleation and growth of in-plane solid-
liquid-solid silicon nanowires catalyzed by indium. Phys Rev B 2009,
80:085313.
14. Yu L, Rocai Cabarrocas P: Growth mechanism and dynamics of in-plane
solid-liquid-solid silicon nanowires. Phys Rev B 2010, 81:085323.
15. Latu-Romain L, Mouchet C, Cayron C, Rouviere E, Simonato JP: Growth
parameters and shape specific synthesis of silicon nanowires by the VLS
method.
J Nanopart Res 2008, 10:1287.
16. Perraud S, Poncet S, Noël S, Levis M, Faucherand P, Rouvière E, Thony P,
Jaussaud C, Delsol R: Full process for integrating silicon nanowire arrays
into solar cells. Sol Energy Mater Sol Cells 2009, 93:1568.
17. Kleider JP, Longeaud C, Brüggemann R, Houzé F: Electronic and
topographic properties of amorphous and microcrystalline silicon thin
films. Thin Solid Films 2001, 57:383.
18. Planès J, Houzé F, Chrétien P, Schneegans O: Conducting probe atomic
force microscopy applied to organic conducting blends. Appl Phys Lett
2001, 79:2993.
19. Alvarez J, Kleider JP, Houze F, Liao MY, Koide Y: Local photoconductivity
on diamond metal-semiconductor-metal photodetectors measured by
conducting probe atomic force microscopy. Diamond Relat Mater 2007,
16:1074.
20. Alvarez J, Houze F, Kleider JP, Liao MY, Koide Y: Electrical characterization
of Schottky diodes based on boron doped homoepitaxial diamond films
by conducting probe atomic force microscopy. Superlatt Microstruct 2006,
40:343.
21. Lampert A, Mark P: Current Injection in Solids New York: Academic Press;
1970.
22. Gu Y, Lauhon LJ: Space-charge-limited current in nanowires depleted by
oxygen adsorption. Appl Phys Lett 2006, 89:143102.
23. Weber L, Lehr M, Gmelin E: Electrical-properties of silicon point contacts.
Phys Rev B 1991, 43:4317.
24. Wexler G: Size effect and non-local Boltzmann transport equation in
orifice and disk geometry. Proc Phys Soc Lond 1966, 89 :927.
25. Celle C, Mouchet C, Rouviere E, Simonato JP, Mariolle D, Chevallier N,
Brioude A: Controlled in Situ n-Doping of Silicon Nanowires during VLS
Growth and Their Characterization by Scanning Spreading Resistance
Microscopy. J Phys Chem C 2010, 114:760.
26. Eyben P, Vandervorst W, Alvarez D, Xu M, Fouchier M: Scanning Probe
Microscopy. New York: Springer; 2007.
doi:10.1186/1556-276X-6-110
Cite this article as: Alvarez et al.: Conductive-probe atomic force
microscopy characterization of silicon nanowire. Nanoscale Research
Letters 2011 6:110.
Submit your manuscript to a
journal and benefi t from:
7 Convenient online submission
7 Rigorous peer review
7 Immediate publication on acceptance
7 Open access: articles freely available online
7 High visibility within the fi eld
7 Retaining the copyright to your article
Submit your next manuscript at 7 springeropen.com
Alvarez et al. Nanoscale Research Letters 2011, 6:110
/>Page 9 of 9