Báo cáo hóa học: " Review Article Machine Perception in Automation: A Call to Arms" pdf
Bạn đang xem bản rút gọn của tài liệu. Xem và tải ngay bản đầy đủ của tài liệu tại đây (1.65 MB, 9 trang )
Hindawi Publishing Corporation
EURASIP Journal on Embedded Systems
Volume 2011, Article ID 608423, 9 pages
doi:10.1155/2011/608423
Review A rticle
Machine Perception in Automation: A Call to Arms
Dietmar Bruckner,
1
Rosemarie Velik,
1, 2
and Yoseba Penya
3
1
Institute of Computer Technology, Vienna University of Technology, 1040 Vienna, Austria
2
Fatronik-Tecnalia, Biorobotics, 20009 Donostia-San Sebastian, Spain
3
University of Deusto, 20012 Donostia, Basque Country, Spain
Correspondence should be addressed to Dietmar Bruckner,
Received 28 June 2010; Revised 5 November 2010; Accepted 16 January 2011
Academic Editor: Klaus Kabitzsch
Copyright © 2011 Dietmar Bruckner et al. This is an open access article distributed under the Creative Commons Attribution
License, which permits unrestricted use, distribution, and reproduction i n any medium, provided the original work is properly
cited.
Automation systems strongly depend on the amount, quality, and richness of their sensor information. For decades, scientists have
investigated towards more accurate and cheaper sensors as well as new sensors for previously undetectable properties or substances.
With these enhancements the problem of too complex sensor information and sensor fusion raised. This paper is intended for
giving a retrospection on perception systems in automation, followed by reviewing state-of-the-art approaches for handling diverse
and complex sensor information as well as highlighting future requirements for more human-like systems that have the ability of
performing their actions in complex and unpredictable environments. For the latter requirement, a section introducing a number
of agent architectures for embedding the sensor fusion process into a comprehensive decision-making unit is given.
1. Introduction
The imaginary accumulated by science fiction through the
years has always fancied future worlds full of intelligent
autonomous machines that were able to perceive the reality
around. This abilit y of sensing the environment in which
they were immersed allowed robots to act consequently.
Decades ago, back in the true world, automation systems
designers started to follow the path that the literature had
drafted realizing that intelligence and perception go hand
in hand. For instance, very simple devices can only carry
out tasks that do not require perceiving and interacting with
the real world (say moving a certain piece 5 cm ahead in a
conveyor belt). Such an easy process may be seen like driving
blind a car: in case the piece falls off the belt, the device will
just fail to carry out its task being also unable to find a proper
reason for its failure. All living beings have incorporated
diverse sensing parts and strategies in their ascent of the
evolution chain, and so do machines: perception is the
turning point that al l ows automation systems to collect
the information needed to control their actions and the
consequences of them.
In the following sections, we will provide an overview
on how machine perception has been addressed in the past,
and what the promising approaches for perception in future
automation systems are in order to be able to fulfill useful
tasks in more general environments—as humans can. Addi-
tionally, a section introducing the embedding of the infor-
mation processing part into a whole decision-making frame-
work is presented. Afterwards, 4 different approaches will be
highlighted in detail that are currently developed in research
projects. Those address mainly two types of perceptive activ-
ities: related to human activities and related to machinery
routines as for example, in a factor y. The first two approaches
are generally in nature, but in their first description intended
for the first kind of tasks, the third one is targeted to factory
automation, whereas the approach detailed in Section 8 is
applicable to any kind of perceptive task. This compilation of
material will inspire engineers that are engaged in designing
automation devices in order to help them create more intel-
ligent or more flexible devices through better perception of
their environment. As the title implies, their exist approaches
to overcome limitations of previous methods of sensor data
processing, they only need to be applied.
2. Developments and Visions
The term perception has been used in computer and
automation systems from the 1950’s onwards, since the
foundation of Artificial Intelligence (AI). It was seen as
2 EURASIP Journal on Embedded Systems
one of the components of intelligence, being learning,
reasoning, problem-solving , and language-understanding.
Perception means acquiring, interpreting, selecting, and
organizing sensory information. The topic itself was not
new to automation, but h as gained a new quality from the
moment information processing could be separated from
energy flow and performed in completely new ways.
The development of machine perception has taken two
ways. The first one is related to industrial process control,
where machines are designed and built in order to increase
productivity, reduce costs as well as enhance quality and
flexibility in the production process. These machines mostly
need to perceive a well-known environment and therefore
possess a selected number of dedicated (and reliable, robust,
expensive, etc.) sensors. The sum of sensor views composes
the machine’s view of the world.
The second development path is concerned with per-
ception of humans and human activities, on the one
hand, and with implementing perception systems imitating
human perception for broader application areas, on the
other. Involved research fields are, among others, cognitive
sciences, artificial intelligence, image processing, audio data
processing, natural language processing, user interfaces, and
human-machine interfaces.
The research field related to perceiving information
about human users is called context-aware systems.The
common view in this community is that computers will
not only become cheaper, smaller, and more powerful, but
they will also more or less disappear and hide integrated
in normal, everyday objects [1, 2]. Thus, smart objects wil l
communicate, cooperate, and virtually amalgamate without
explicit user interaction or commands to form consortia in
order to offer or even fulfill tasks on behalf of a user. They
will be capable of not only sensing values, but also of deriving
context information about the reasons, intentions, desires,
and beliefs of the user. This information may be shared
over networks—like the internet—and used to compare and
classify activities, find connections to other people and/or
devices, look up semantic databases, and much more.
3. The Research Field of Sensor Fusion
One of the most active disciplines around autonomous
perception is sensor fusion. This research area aims at
combining sensorial data from diverse origins (and some-
times also other information sources) to achieve a “better
perception” of the environment.
There can be found various definitions of sensor fusion
differing slightly in the meaning. One states that sensor
fusion is “the combining of sensory data or data derived
from sensory data in order to produce enhanced data in
form of an internal representation of the process environment.
The achievements of sensor fusion are robustness, extended
spatial and temporal coverage, increased confidence, reduced
ambiguity and uncertainty, and improved resolution.” [3], to
whichwefullyagree.
Sensor data fusion is a relatively recent and dynamic
field, and a standard terminology has not yet been adopted.
The terms “sensor fusion”, “sensor integration”, “data fusion”,
“information fusion”, “multisensor data fusion”, and “mul-
tisensor integration” have been widely used in technical
literature to refer to a variety of techniques, technologies,
systems, and applications, which use data derived from
multiple information sources [4–6].
Data for sensor fusion can come from single sensors
taken from multiple measurements subsequently at different
instants of time, from multiple sensors of identical types, or
from sensors of different types. In the following, concepts,
models, methods, and applications for sensor fusion will be
summarized, mainly following the ideas of [7, 8].
Concepts for Fusion. Sensor fusion is generally based on the
combination of redundant or complementary information.
Among others, the works in [3, 5, 8] distinguish three types
of sensor data fusion, which are not mutually exclusive:
complementary fusion, competitive fusion, a nd cooperative
fusion.
Complementary fusion is the fusion of incomplete
sensor measurements from several disparate sources.
Sensor data do not directly depend on each other,
but are combined to give a more complete image of
a phenomenon under observation.
Competitive fusion is the fusion of redundant sensor
measurements from several sources. Each sensor
delivers independent measurements of the same
property. Competitive sensor configurations are also
called redundant configurations.
Cooperativ e fusion uses the information provided
by independent sensors to derive information that
would not be available from the single sensors. An
example for cooperative sensor fusion is stereovi-
sion. In contrast to complementary and competitive
fusion, cooperative fusion generally decreases accu-
racy and reliability.
Models for Fusion. Regarding the models for sensor fusion,
it has to be noted that sensor fusion models heavily depend
on the application they are used in. So far, there does not
exist a model for sensor fusion that is generally accepted,
and it seems unlikely that one technique or architecture will
provide a uniformly superior solution [3]. Therefore, there
exist numerous models for sensor fusion in the literature.
To mention only few of them: the JDL fusion model
architecture, the Waterfall model, the Intelligence cycle, the
Boyd loop, the LAAS architecture, the Omnibus model,
Mr. Fusion, the DFuse framework, and the Time-Triggered
Sensor Fusion Model.
Methods for Fusion. Therehavebeensuggestedvarious
methods for sensor fusion. Sensor fusion methods can
principally be divided into grid-based (geometric) and
parameter-based (numerical) approaches whereby in the
case of numeric approaches. A further distinction is
made between feature-based approaches (weighted average,
Kalman filter), probabilistic approaches (classical statistics,
Bayesian statistics), fuzzy methods, and neural approaches.
EURASIP Journal on Embedded Systems 3
In contrast, the work in [9] classifies fusion algorithms
into estimation methods (weig hted average, Kalman filter),
classification methods (cluster analysis, unsupervised or
self-organized learning algorithms), interference methods
(Bayesian interference, Dempster-Shafter evidential reason-
ing), and artificial intelligence methods (neural networks,
fuzzy logic). Similar to the models of sensor fusion, there
is also no one sensor fusion method suitable for all appli-
cations. Hence, new hierarchical approaches are sought to
combine the advantages of the basic mathematical ones.
Application Areas. Areasofapplicationsoffusionarebroad
and range from measurement engineering and production
engineering over robotics and navigation to medicine tech-
nology and military applications. Examples for applications
can be found in [4, 8, 9].
Biological Sensor Fusion. It is well appreciated that sensor
fusion in the perceptual system of the human brain is of far
superior quality than sensor fusion achieved with existing
mathematical methods [10, 11]. Therefore, it seems to be
particularly useful to study biological principles of sensor
fusion.
Such studies can, on the one hand, lead to better technical
models for sensor fusion and, on the other hand, to a
better understanding of how perception is performed in the
brain. Sensor fusion based on models derived from biology
is called biological sensor fusion. Approaches to biological
sensor fusion made so far can be found in [12–18].
Although there have already been introduced a number
of models for biological sensor fusion, yet success of
research efforts incorporating lessons learned from biology
into “smart algorithms” has been limited [10]. One reason
therefore might be that the use of biological models in actual
machines is often only metaphorical, using the biological
architecture as a general guideline [19].
4. Agent Architectures
The development in AI as briefly sketched in Section 2 can
be summarized to have taken four main scientific directions,
the so-called symbolic, statistical, emotional, and behavior-
based AI [20]. In symbolic AI sensor inputs are abstracted to
“symbols” and then processed. Symbolic AI’s major concern
is knowledge representation and the modeling of search
algorithms for identify ing situations. Statistic AI is used for
applications where the problem space cannot be defined
and in dynamic or unrestricted environments. The claim
[21] that human decision-making is influenced by subjective
evaluation based on emotion is taken into account by
emotional AI, while behavior-based AI focuses on observable
system world interaction.
The different theories overlap in practice. Based on these
theories a number of control architectures and frameworks
have been developed. They are applied for systems which
must be able to accomplish tasks by harking back on
predefined and learned knowledge.
The embodied approach to AI pioneered by Brooks
and his subsumption architecture follows the paradigm that
mobile agents need to have a body as origin for decisions
[22]. From a cognitive scientist’s perspective, it contributes
to the idea that intelligence can arise or emerge out of a large
number of simple, loosely coupled parallel processes [23, 24].
With the above ideas in mind several cognitive architec-
tures have been developed like SOAR [25], ACT-R [26], LIDA
[27], CogAff [28], OpenCog Prime [29], and so forth.
5. Recognizing Scenarios with
Statistical Methods
The following four approaches to machine perception have
been selected because the y give a representative overview
about the principles in advanced machine perception meth-
ods. All of them have a layered data processing architecture
that allows hierarchical infor mation processing. This is
necessary for complex processes. (Additionally, there are
approaches for formalizing the hierarchical representations
in taxonomies or ontologies. Their introduction is not within
the scope of this paper since we would like to give an intro-
duction to the mechanisms of perception and not to focus on
the organization of results.) For introductory purposes, they
are not presented including parameter learning capabilities
(except the Automatic Scenario Learning approach from this
Section, which, however, is a lso not intended to change
parameters after the initial structural training phase).
Scenario recognition tries to find sequences of particular
behaviors a nd groups it in a way humans would according
to similarities. Similarity in this case can be in time, in
space, or via similar events. The range of scenarios is
application dependent, such as “a person walking along
a corridor”, or “there happens a football match in a
stadium”. An additionally important aspect of scenarios is
the possible time span between some of them belonging to
the same operation (please note that the concept operation
is something very abstract and time consuming, such as
scenarios like “starting an operation”, “waiting for something
to happen”, “do something”, etc.). Moreover, related scenarios
can be discontinued by others, which are not concerned
with the mentioned operation. Therefore, a system which has
the target of detect ing human scenarios must be capable of
dealing with a multitude of operations like those a human
can perform.
Still, it is not within the scope of this work to deal with
human operations. On the one hand, the computational
effort would be far too large because of the huge number of
possibilities. On the other hand, the presented approach is
not intended to observe single persons in all aspects of their
lives. Quite the opposite: the system will be installed in a (e.g.,
public) building and therefore sees only small time frames
out of a particular person’s life. The detected scenarios and
operations refer more to the “life” of the building rather than
that of people.
An approach to scenario recognition based on fully
learned models is summarized below. This approach [30]can
be used to learn common models for scenarios which can
slightly vary in their generated sensor data. The approach is
based on hidden Markov models (HMMs) [31]. The states
of the model are interpreted as events of the scenario [32].
4 EURASIP Journal on Embedded Systems
The approach is mainly targeted for surveillance systems
(e.g., Ambient Assisted Living [33]) to model trajectories of
persons or to model routines within sensor environments.
One application uses motion detector sensor data to learn
about daily routines in the occupation of rooms.
A hidden Markov model consists of a transition matrix
(it gives the probability of going from one particular state
in the model at time t to another state at time t +1.
Usually, the transition matrix is time independent, which is
no hard restriction, since implicit time dependency can be
incorporated via self-transitions and parallel paths within the
model), an emission or confusion matrix (which models the
probability of outputting symbols from an alphabet or some
value from a continuous dist ribution), and an initial state
distribution vector. The latter gives the probabilities of being
in all the states at the first point in time. In the presented
approach it can be omitted with the introduction of an initial
and a final state, which have to be passed by each scenario.
In the motion detector application the initial state rep-
resents 0:00 in the morning, while the final state represents
midnight. In between these two there are different paths
which represent one particular daily routine. That sensor
sends a data packet with value 1 in case of detected motion.
When the sensor permanently detects moving objects, it
sends packets at a maximum speed of five seconds. After
detecting no moving object for more than 1 minute, the
sensor sends a packet with value 0. The system is not directly
supported with the motion detector’s sensor values, but with
averaged sensor values. The 24 hours of a day are divided
into 48 time slots, each 30 minutes long. In those time slots,
the mean of the sensor values is computed and rounded.
If no value is available during 30 minutes, the mean is set
to 0 which is synonymic to “no motion”. The chains of
48 values are then fed into the (empty) model and during
a procedure of several merging steps the structure of the
model is learned (see also [34]). Merging in combination
with the averaging of the sensor values will produce HMMs
with a manageable number of states. The number of states
of HMMs is a compromise between generalization (low
number of states, the model is applicable for a wide range
of different scenarios, but not able to distinguish between
particular ones) and specialization (rather high number of
states, not every possible scenario is depicted in the model
and quite similar scenarios can have different paths).
The following figures show the result of applying the
algorithms to the motion detector data. In this model every
path through the model represents a particular daily routine.
But, moreover, some of the states themselves also represent
particular—and by humans identifiable—parts of a daily
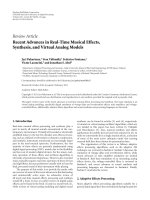
routine. In this model (Figure 1), all paths but one go
through state 1 and end in state 4. The only exception
is the transition from initial to final state with state 14
in between, which represents the weekends (and has a
transition probability of 28.6%, which is 2/7). Along with
the figures of all other daily routines (only one is shown
here), state 1 can be interpreted as the morning until the
first motion is detected and state 4 represents the evening
after everybody already left the office (i.e., no more motion
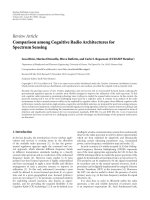
is detected). Figure 2 shows a normal day in the “observed”
0
156891011415
7
13
2
12
3
14
Figure 1: A path through the model. For a particular chain of
sensor values, the Viterbi algorithm (see [34]) finds the most
probable path. The path shown here together with its sensor values
is shown in Figure 2.
1
5
4
15
13
0
Cleaning
person
Normal activity All goneNobody
in
the office
Figure 2: A normal day in the office. The figure shows the Viterbi
path through the model and the 48 averaged sensor values for that
day. Vertical lines mark transitions between states.
office. One comment concerning the “sensor values”. In this
office the cleaning person comes every working day in the
morning to empty the wastebasket. We can see that state 5
covers a short motion followed by a longer “break” with no
motion, temporally located in the morning. This state thus
represents the cleaning person. Finally, state 13 represents
the period of constant activity during the day. In other paths
(representations of other prototype days) like the one with
most states or the one over state 7 the activity of the whole
day is interrupted with pauses at particular times which
can be interpreted, for example, as lunch breaks or external
meetings.
For another level of abstraction, models of single days
can be easily put together with their initial and final states
to create a model for a longer period, for example, a week.
For such purpose the t ransition probabilities from the initial
state to particular days can be modified with respect to their
position within the week. Hence, the first five models can
omit the weekend part (and renormalize the rest), while the
latter two could be modeled with only state 14 between initial
and final connection state.
6. Processing and Symbolization of
Ambient Sensor Data
Some recent approaches for processing and interpreting sen-
sor data are based on sy m bolic information processing, and
generally, on multilevel data processing [35–37]. One model
targeting the field of building automation for automatic
surveillance systems was de veloped by the work in [38, 39].
In this application area, relevant information has to be
EURASIP Journal on Embedded Systems 5
···
···
···
Representation
symbols
Microsymbols
Sensors
Snapshot
symbols
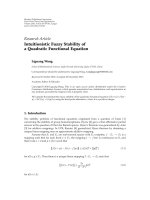
Figure 3: Example for symbolic processing of sensor data.
extracted from a huge amount of data coming from various
sensor types. For this sensor data processing, a layered model
was introduced. According to this model, sensor data is
processed by a bottom-up information process in three layers
in order to perceive different scenarios going on in a building.
Thelayersarereferredtoasmicrosymbol layer, snapshot sym-
bol layer, and representation symbol layer. A concrete example
is presented in Figure 3, in which the scenario that a (e.g.,
elderly) person falls down will be detected. In these three
layers, information is processed in terms of symbols, which
are called microsymbols, snapshot symbols,andrepresentation
symbols. A symbol is seen as a representation of a collection of
information. In the mentioned figure, the sensors themselves
(not drawn) provide s ensor data which is compared to
template microsymbols. If it matches well, the microsymbols
in the lower raw are activated. The microsymbols have
defined connections and weights to snapshot symbols, who
are activated, if enough microsymbols are active. Again, the
representation symbol is activated in case enough number of
the predefined connections to snapshot symbols are active.
With this architecture an evaluation of the current situation
for the purpose of scenario recognition can be implemented.
Symbols can be created, their properties can be updated,
and they can be deleted. Their level of sophistication
increases w ith each layer. The number of symbols is different
at each layer. At the lowest layer, a large number of
microsymbols occur. At the representation layer, only a
few symbols exist, where each symbol represents a lot of
information of a higher quality. The three types of symbols
aredefinedasfollows.
Microsymbols. Microsymbols are extracted from sensory
input data. They form the basis of the symbol alphabet and
bear the least amount of information. A microsymbol is
created from a few single sensor inputs at a specific instant of
time. Examples for microsymbols in the scenario of Figure 3
are motion (detected by motion sensors), footsteps (detected
by tactile floor sensors), objects or a person (detected by
video cameras), and so forth.
Snapshot Symbols. A group of microsymbols is combined to
create a snapshot symbol. They represent how the system
perceives the world at a given moment in time. Whenever the
system perceives a situation or an object of interest, it creates
an according snapshot symbol. The information is provided
either by the presence of microsymbols or the absence of
specific microsymbols. Examples for snapshot symbols in the
scenario of Figure 3 are a gait, a standing person, a falling
person, a lying person, and so forth. When the symbol is
activated it is determined by either if-then rules or fuzzy
rules. The if-then rule used for activating, for example, the
symbol gait looks as follows. In the other two layers, the same
type of rules are applied.
if (motion==true &&
footsteps==true &&
person==true)
gait==true;
end
Representation Symbols. The third level of symbolization is
the representation of the world. Similar to snapshot symbols,
representation symbols are used to represent what the system
perceives. The fundamental difference is that representation
symbols are created and updated by establishing associations
between snapshot symbols. The representation level contains
not only the information how the world is perceived at
the current instant but also the history of this world
representation. Compared to the lower levels of symbols,
there exist only a few representation symbols, and these
are seldom created or destroyed. Only their properties are
updated regularly. Following the example mentioned above,
on this level, it is detected that a person fell down and cannot
get up any more by integrating the information coming
from the snapshot symbols. It is important to note that the
world representation does not hold the entirety of all sensory
information available but just what is defined as relevant. If
for instance a person walks around, the world representation
does not present information at which exact positions the
person has placed its feet. Rather than that, it presents just a
position for this person, which may be more or less accurate.
The representation layer can be regarded as the interface
to applications. Applications are required to monitor the
world representation in order to obtain the information
needed to fulfill their specific tasks. This approach relieves
applications from handling large amounts of sensory infor-
mationandprovidesacondensedandfilteredcomposition
of all this information in a highly reusable way. When
an application is running, it searches the existing world
representation for scenarios that the application knows (e.g.,
an elderly person has collapsed on the floor) [35]. The
events that a re required for the scenario to take place
can be found on the representation level. Therefore, the
application augments the representation by noting that it has
found a scenario. It does so by creating a scenario symbol.
This makes it possible to study the output of applications
later. Additionally, an application can create higher-level
scenarios by linking together lower-level scenarios of other
applications. That way, the hierarchy can be even further
extended by having lower-level applications looking for
simple scenarios and higher-level applications using these
scenarios to find more complex scenarios.
6 EURASIP Journal on Embedded Systems
7. Perception in Factory Automation
There are many applications in which perception can be
a key success factor in factory automation. Traditionally,
automated machines have carried out quite simple tasks in
factories. At most, devices doing simple tasks work together
and, after a proper coordination, may execute more difficult
enterprises. Still, as already mentioned, perception enables
them to go beyond that turn point and star t fulfilling more
complex activities.
In this way, here we present a Bayesian-network-based
model that a llows error detection and prediction in high-
precision foundries. Basically, information queries are pro-
cessed by a trained Bayesian network, which issues its
prediction on whether the piece to be casted is going to
be valid or not. That is, as seen in Figure 3, the sensor
values are gathered into the microsymbol layer and the
Bayesian network, based upon that representation, produces
an snapshot symbol layer (error or not) that may be used
in the upper layer, the representation symbol one, to call
a reaction. By analyzing more representation symbols, a
surveillance application might deduce, for instance, that a
quality control is needed (in case more errors are detected
or predicted), try to infer their cause, update the production
plan (to reschedule pieces that will not be produced), and so
on. Later on, we will give an example of such an application
running on top of the representation layer.
Nowadays, the only used methodology to guarantee a
failure-free casting production (up to a given probability)
consists in performing random quality controls (which is a
common practice in many other industries). Such controls
proceed in the following manner: moulds considered to be
representative of a certain production time are extracted
and examined with ultrasounds to detect microshrinkages
(which is the error targeted by this application). In case
it is failure-free, the whole lot is labeled as correct and
dispatched. Yet, if a microshrinkage is found, then the failure
procedure starts. The first step is the assessment of the
damage, depending on the number of the pieces involved, the
position of the defect, its size, and so on, a microshrinkage
can be acceptable (i.e., the flaw is minor) and, therefore,
the piece must not be discarded. Otherwise, the responsible
person decides whether analyze the whole lot or discard
it.
Against this background, the alternative presented here
combines the power of Bayesian networks with the p ercep-
tion architecture described in Figure 3.Bayesiannetworks
[40] are probabilistic models that are very helpful when fac-
ing problems that require predicting the outcome of a system
consisting of a high number of interrelated variables. After a
training period, the Bayesian network learns the behavior of
the system and, thereafter it is able to foresee its outcome.
This Bayesian network was fed with real data of the
foundry and the training consisted in the simulation of
manufacturing situations whose output had been registered
beforehand. After the Bayesian network was tuned up
properly, it was applied to predict the outcome of several
normal production lots that were also double checked by
ultrasound techniques afterwards (see [41, 42]formore
accurate description of the training process followed, experi-
ments done, and results obtained).
In a first version presented in [41], the Bayesian
network concentrated on distinguishing pieces containing
microshrinkages. Therefore, there was only one symbol at
the snapshot layer. A second version (reported in [42]),
extended the number of symbols at that layer to define risk
models, which increased the accuracy of the predictions.
This time, the Bayesian network was able to distinguish
between valid and not valid microshrinkages. The risk levels
modeled the sensitivity of the system and, in this way, helped
better classify the outcome of each production situation (i.e.,
whether a microshrinkage will appear and whether it will be
valid or invalid).
The definition of these risk levels was performed as
follows: the Bayesian network used the analysis on the first
lot of the production series to infer the behavior of the rest.
According to this result, the risk of every lot was classified
into “Risk 0” (no microshrinkages foreseen), “Risk 1” (less
than 5 valid microshrinkages expected), “Risk 2” (more than
5 valid microshrinkages predicted), and “Risk 3” (invalid
microshrinkages foreseen). Thus, the prediction was more
accurate and gave more detailed information.
Still, the real power lies on the use of the information,
not on the information itself. Having the Bayesian network
issuing predictions on castings’ validity, that would not be
enough without giving those forecasts a proper use. In
this way, the Bayesian network predictor architecture was
fitted with an additional application (the so-called Sensitivity
Module,(SM)[41]), operating on top of the representation
symbol layer.
The SM studied the differentvaluesthateachvari-
able (i.e., microsymbols) adopted in order to trace the
influence of such values in the apparition of the different
microshrinkage risks (i.e., snapshot symbol). Note that a
variable may represent for instance using one or another
product in a certain phase of the process, applying one
certain methodology or not, and so on. In this way, if
a variable showed the type of cleaning method used and
there were 3 choices, the sensitivity module was able to
determine which one was the most convenient in terms of
preventing the apparition of microshrinkages. That is, the
SM evaluated the results obtained by the Bayesian network
and calculated the causal relationship between each type
of cleaning method (i.e., value of the variable cleaning
method) and the probability that a certain microshrinkage
risk appeared. Hence, the SM was able to recommend using
only the one that presented the smallest probability, that is,
prevent a certain (not desired) scenario to appear.
8. Bionics for Human-Like Machine Perception
Machine perception deals with designing machines that can
sense and interpret their environment. For restricted and
well-known environments, they can be already achieved,
quite promising results. However, the situation changes when
shifting to the so-called real-world environments with a
seemingly infinite number of possible occurring objects,
events, and situations. The problems that scientists are
EURASIP Journal on Embedded Systems 7
currently confronted with here show that this research
area is still in its infancy [43]. In contrast, it is well
accepted that humans are equipped with a preceptory
system that enables them to apprehend their environment
within reasonable time and accuracy [10]. This inspired
several research groups to use biology as archetype for
perceptual model development [44]. Success of most existing
approaches, however, has been limited so far. One reason
might be that in many cases, engineers just “grab” some
fancy sounding terms and concepts from biology for model
development without considering the overall functioning of
the biological system taken as archetype [17]. In contrast to
this, one quite promising approach to human-like machine
perception, which actually sticks to neuroscientific and
neuropsychological research findings about the structural
organization and function of the perceptual system of the
human brain, was made by the work in [45]. The basic idea
of this approach will briefly be sketched in the following.
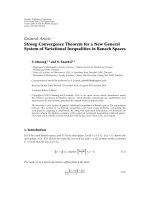
Figure 4 gi ves an overview of the developed model.
The blocks describe the different functional modules of
the model and the arrows indicate the flow of information
between them. The first step to make a machine perceive
its environment is to equip it with sensors. For reasons
of robustness, it is recommendable to use diverse and
partly redundant sensors for this purpose. The challenge
that next has to be faced is to merge and interpret the
information coming from these diverse sources. To do so, the
proposed model processes sensory information in a so-called
neurosymbolic network and additionally applies concepts like
memory, knowledge,andfocus of attention . In the following,
the basic function principle of the neurosymbolic network is
described. For details of the other modules see [46].
The basic processing units of the neurosymbolic network
are so-called neurosymbols (see Figure 5). Neurosymbolic
networks are made up of a number of interconnected, hier-
archically arranged neurosymbols. The inspiration for the
utilization of neurosymbols came from the fact that humans
think in terms of symbols (like e.g., objects, characters, fig-
ures, sounds, or colors), w hile the physiological foundation
is the information processed by neurons. Neurons can be
regarded as information processing units on a physiological
basis and symbols as infor mation processing units on a more
abstract level. The important question was now if and how
these two levels of abstraction are connected. Given the
fact that neurons were found in the human brain which
respond exclusively to certain perceptual images—symbolic
information like for example, a face—it was concluded that
there exists a connection between these levels.
This fact inspired the usage of neurosymbols. Neu-
rosymbols represent perceptual images like, for example,
acolor,aline,aface,aperson,asound,oravoiceand
show a number of analogies to neurons. A neurosymbol
has an ac tivation grade and is activated if the perceptual
image that it represents is perceived in the environment. To
be activated and to activate other neurosymbols, it has a
certain number of inputs and one output. Via the inputs,
information about the activation of other neurosymbols or
sensors is received. All incoming activations are summed
up and normalized to the number of inputs n. If this sum
Perception
Neuro-symbolic network
Focus of
attention
Memory
Knowledge
Sensor data
Figure 4: Model Overview.
Figure 5: Function principle of neurosymbols.
exceeds a certain threshold, the neurosymbol is activated.
The information about its activation is transmitted via the
output to other neurosymbols. Formula (1) define these facts
in mathematical terms.
ActivationGrade
=
1
n
n
i=1
ActivationOfInput
i
if
(
ActivationGrade ≥ ThresholdValue
)
ActivationOfOutput
= 1
if
(
ActivationGrade < ThresholdValue
)
ActivationOfOutput
= 0.
(1)
In order to perform complex perceptive tasks, a certain
number of neurosymbols are connected to a so-called
neurosymbolic network. The structural organization of this
network is similar to the modular hierarchical organization
of the perceptual system of the human brain as described by
[24, 47, 48]. Information of different sensory modalities is
first processed separately and in parallel and then merged in
higher hier archical levels. In a first processing step, simple
so-called feature symbols are extracted from sensor y raw
data. Information processing in this level correlates with
information processing performed in the primary cortex
of the brain. In the next two steps, feature symbols are
combined to subunimodal and unimodal symbols. These
two levels correspond to the function of the secondary
cortex of the brain. Afterwards, information of all sensory
modalities is merged to a multimodal perception, which is
in accordance with the function of the tertiary cortex of the
human brain. For application examples of this model, see
8 EURASIP Journal on Embedded Systems
[45]. In an application of the model, the meaning of the
neurosymbols has to be predefined, whereas the weigths can
be learned. This is done in a hierarchical way layer by layer,
where first the forward connections from the lower to the
higher layer are trained with the help of examples. After
finalizing the forwards, the feedbacks to the lower layers are
trained, again with examples. This procedure may generate
slightly different weights compared to learning forward
and backward connections at once but ensure stability and
effectivity of the lear ning approach.
Within a neurosymbolic layer, information is processed
in parallel, which allows high performance. Like in artificial
neural networks, connections and correlations between
neurosymbols can be acquired from examples in different
learning phases. Despite some similarities, neurosymbolic
networks show many differences to artificial neural networks.
In both cases, weighted input information is summed up
and compared with a threshold in the basic processing
units. Both combine basic processing units to perform
complex tasks and process information in parallel. However,
unlike in neural networks, where information is represented
in a distributed and generally not interpretable form via
weights of connections, every single neurosymbol has a
certain interpretable semantic meaning as each neurosymbol
represents a certain perceptual image. In artificial neural
networks, only the structure and function of a single nerve
cell serves as biological archetype. In contrast to this, in neu-
rosymbolic networks, also the structural organization of the
perceptual system of the human brain is used as archetype of
their architecture. Hence, neurosymbolic networks combine
advantages of neural and symbolic systems. For a more
detailed discussion of this topic, see [46].
9. Conclusion and Outlook
This paper has outlined four current approaches to overcome
the problem of complexity in sensor systems. Future automa-
tion systems will perceive their environment with myriads of
sensors (the so-called smart dust), having available a quality
of perception that may reach or even exceed human per-
ception. This situation implies some basic problems related
to initialization, reliability, and sensor fusion. The presented
approaches tackle the problem of sensor fusion from differ-
ent perspectives. Hierarchical systems are introduced—as are
used in the human brain—in order to reduce the complexity
and amount of data layer by layer while on the other hand
enriching the semantic meaning of data.
References
[1] R. R. Hainich, TheEndofHardware,ANovelApproachto
Augmented Reality, Booksurge, 2006.
[2] F. Mattern, “Ubiquitous computing: schlaue altagsgegenst
¨
a-
nde—die vision von der informatisierung des alltags,” in
Bulletin des SEV/VSE, vol. 19, pp. 9–13, 2004.
[3] W. Elmenreich, Sensor Fusion in Time-Triggered Syste ms,Ph.D.
thesis, Vienna Univertiy of Technology, 2002.
[4] J. Beyerer, F. Puente Leon, and K D. Sommer, Eds., Informa-
tionfusion in der Mess- und Sensortechnik, Universit
¨
atsverlag
Karlsruhe, 2006.
[5] J. van Dam, Environment modelling for mobile robots: neural
learning for sensor fusion, Ph.D. thesis, University of Amster-
dam, 1998.
[6] P. Vadakkepat, P. Lim, L. C. De Silva, L. Jing, and L. L.
Ling, “Multimodal approach to human-face detection and
tracking,” IEEE Transactions on Industrial Electronics, vol. 55,
no. 3, pp. 1385–1393, 2008.
[7] W. Elmenreich, “A review on system architectures for sensor
fusion applications,” in Software Technologies for Embedded
and Ubiquitous Systems, pp. 547–559, Springer, Berlin, Ger-
many, 2007.
[8] H. Ruser and F. P. Leon, “Informationfusion—eine
¨
uebersi-
cht,” Technisches Messen, vol. 74, no. 3, pp. 93–102, 2007.
[9]R.C.Luo,C.C.Yih,andK.L.Su,“Multisensorfusion
and integration: approaches, applications, and future research
directions,” IEEE Sensors Journal, vol. 2, no. 2, pp. 107–119,
2002.
[10] L. I. Perlovsky, B. Weijers, and C. W. Mutz, “Cognitive
foundations for model-based sensor fusion,” in Proceedings
of the International Society for Optical Engineering: Signal
Processing, Sensor Fusion, and Target Recognition, Proceedings
of SPIE, pp. 494–501, April 2003.
[11] R. Velik, R. Lang, D. Bruckner, and T. Deutsch, “Emulating
the perceptual system of the brain for the purpose of sensor
fusion,” in Proceedings of the Conference on Human System
Interaction (HSI ’08), pp. 657–662, May 2008.
[12] M. C. Costello and E. D. Reichle, “LSDNet: a neural network
for multisensory perception,” in Proceedings of the 6th Interna-
tional Conference on Cognitive Modeling, p. 341, 2004.
[13] J. Davis, “Biological sensor fusion inspires novel system
design,” in Proceedings of the Joint Service Combat Ident ification
Systems Conference, 1997.
[14] D. George and B. Jaros, The HTM Learning Algorithms,
Numenta, 2007.
[15] R. L. Harvey and K. G. Heinemann, “Biological vision models
for sensor fusion,” in Proceedings of the 1st IEEE Conference on
Control Applications, pp. 392–397, 1992.
[16] J. Hawkins and D. George, Hierarchical Temporal Memory—
Concepts, Theory, and Terminology, Numenta, 2006.
[17] P. Kammermeier, M. Buss, and G. Schmidt, “A systems theo-
retical model for human perception in multimodal presence
systems,” IEEE/ASME Transactions on Mechatronics, vol. 6, no.
3, pp. 234–244, 2001.
[18] R. R. Murphy, “Biological and cognitive foundations of
intelligent sensor fusion,” IEEE Transactions on Systems, Man,
and Cybernetics Part A, vol. 26, no. 1, pp. 42–51, 1996.
[19] M. Kam, X. Zhu, and P. Kalata, “Sensor fusion for mobile
robot navigation,” Proceedings of the IEEE,vol.85,no.1,pp.
108–119, 1997.
[20] S. J. Russell and P. Norvig,
Artificial Intelligence: A Modern
Appr oach , Pearson Education, 2003.
[21] A. Damasio, Descartes’ Error: Emotion, Reason, and the Human
Brain, Penguin, 1994.
[22] R. A. Brooks, “A robust layered control system for a mobile
robo t,” IEEE Journal of Robotics and Automation,vol.2,no.1,
pp. 14–23, 1986.
[23] R. Pfeifer and C. Scheier, Understanding Intelligence,MIT
Press, 1999.
[24] M. Solms and O. Turnbull, The Brain and the Inner World:
An Introduction to the Neuroscience of Subjective Experience,
Karnac/Other Press, Cathy Miller Foreign Rights Agency,
London, UK, 2002.
[25] A. Newell, Unified Theories of Cognition,HarvardUniversity
Press, Cambridge, Mass, USA, 1994.
EURASIP Journal on Embedded Systems 9
[26] M. D. Byrne, “ACT-R/PM and menu selection: applying a
cognitive architecture to HCl,” International Journal of Human
Computer Studies, vol. 55, no. 1, pp. 41–84, 2001.
[27]U.Ramamurthy,B.J.Baars,S.K.D’Mello,andS.Franklin,
“Lida: a working model of cognition,” in Proceedings of the 7th
International Conference on Cognitive Modeling, pp. 244–249,
2006.
[28] A. Sloman, R. Chrisley, and M. Scheutz, “The architectural
basis of affective states and processes,” in Who Needs Emotions?
The Brain Meets the Robot, M. Arbib and J M. Fellous, Eds.,
pp. 203–244, Oxford University Press, Oxford, UK, 2005.
[29] B. Goertzel, “Opencogprime: a cognitive synergy based archi-
tecture for artificial general intelligence,” in Proceedings of the
8th IEEE International Conference on Cognitive Informatics,pp.
60–68, 2009.
[30] D. Bruckner, Probabilistic models in building automation:
recognizing scenarios with statistical methods, Dissertation
Thesis, University of Technology, Vienna, Austria, 2007.
[31] L. R. Rabiner and B. H. Juang, “An introduction to hidden
Markov mod els,” IEEE ASSP Magazine, vol. 3, no. 1, pp. 4–16,
1986.
[32] T. Takeda, Y. Hirata, and K. Kosuge, “Dance step estimation
method based on HMM for dance partner robot,” IEEE
Transactions on Industrial Electronics, vol. 54, no. 2, pp. 699–
706, 2007.
[33] S. Tashiro and T. Murakami, “Step passage control of a power-
assisted wheelchair for a caregiver,” IEEE Transactions on
Industrial Electronics, vol. 55, no. 4, pp. 1715–1721, 2008.
[34] D. Bruckner, B. Sallans, and G. Russ, “Probabilistic construc-
tion of semantic symbols in building automation systems,” in
Proceedings of the IEEE International Conference on Industrial
Informatics (INDIN ’06), pp. 132–137, 2007.
[35] W. Burgstaller, Interpretation of Situations in Buildings,Ph.D.
thesis, Vienna University of Technology, 2007.
[36] D. Joyce, L. Richards, A. Cangelosi, and K. R. Coventry,
“On the foundations of perceptual symbol systems: specifying
embodied representations via connectionism,” in Proceedings
of the 5th International Conference on Cognitive Modeling,pp.
147–152, 2003.
[37] A. Richtsfeld, Szenarienerkennung durch symbolische Daten-
verar-beitung mit Fuzzy-Logic, M.S. thesis, Vienna University
of Technology, 2007.
[38] G. Pratl, Processing and symbolization of ambient sensor data,
Ph.D. thesis, Vienna University of Technology, 2006.
[39] S. O. Goetzinger, Sce nario recognition based on a bionic model
for multi-level symbolization, M.S. thesis, Vienna University of
Technology, 2006.
[40] J. Pearl, “Reverend Bayes on inference engines: a distributed
hierarchical approach,” in Proceedings of the National Confer-
ence on Artificial Intelligence, pp. 133–136, 1982.
[41] Y. K. Penya, P. G. Bringas, and A. Zabala, “Advanced fault pre-
diction in high-precision foundry production,” in Proceedings
of the IEEE International Conference on Industrial Informatics
(INDIN ’08), pp. 1672–1677, 2008.
[42] Y. K. Penya, P. G. Bringas, and A. Zabala, “Efficient failure-
free foundry production,” in Proceedings of the 13th IEEE
International Conference on Emerging Technologies and Factory
Automation (ETFA ’08), pp. 237–240, 2008.
[43] R. Velik, “A model for multimodal humanlike perception
based on modular hierarchical symbolic information process-
ing, knowledge integration, and learning,” in Proceedings of
the 2nd International Conference on Bio-Inspired Models of
Network, Information, and Computing Systems (BIONETICS
’07), pp. 168–175, December 2007.
[44] R. Velik, R. Lang, D. Bruckner, and T. Deutsch, “Emulating
the perceptual system of the brain for the purpose of sensor
fusion,” in Proceedings of the Conference on Human System
Interaction (HSI ’08), pp. 657–662, 2008.
[45] R. Velik, A bionic model for human-like machine perception,
Ph.D. thesis, Vienna University of Technology, 2008.
[46] R. Velik, ABionicModelforHuman-LikeMachinePerception,
VDH, 2008.
[47] E. Bruce Goldstein, Sensation and Perception,Wadsworth
Publishing, 2007.
[48] A. R. Luria, The Working Brain—An Introduction in Neuropsy-
chology, Basic Books, 2001.