Báo cáo hóa học: " Research Article Query-by-Example Music Information Retrieval by Score-Informed Source Separation and Remixing Technologies" potx
Bạn đang xem bản rút gọn của tài liệu. Xem và tải ngay bản đầy đủ của tài liệu tại đây (6.79 MB, 14 trang )
Hindawi Publishing Corporation
EURASIP Journal on Advances in Signal Processing
Volume 2010, Article ID 172961, 14 pages
doi:10.1155/2010/172961
Research Article
Query-by-Example Music Information Retrieval by
Score-Informed Source Separation and Remixing Technologies
Katsutoshi Itoyama,
1
Masataka Goto,
2
Kazunori Komatani,
1
Tetsuya Ogata,
1
and Hiroshi G. Okuno
1
1
Department of Intelligence Science and Technology, Graduate School of Informatics, Kyoto University, Sakyo-Ku,
Kyoto 606-8501, Japan
2
Media Interaction Group, Information Technology Research Institute (ITRI), National Institute of Advanced Industrial Science and
Technology (AIST), Tsukuba, Ibaraki 305-8568, Japan
Correspondence should be addressed to Katsutoshi Itoyama,
Received 1 March 2010; Revised 10 September 2010; Accepted 31 December 2010
Academic Editor: Augusto Sarti
Copyright © 2010 Katsutoshi Itoyama et al. This is an open access article distributed under the Creative Commons Attribution
License, which permits unrestricted use, distribution, and reproduction in any medium, provided the original work is properly
cited.
We describe a novel query-by-example (QBE) approach in music information retrieval that allows a user to customize query
examples by directly modifying the volume of different instrument parts. The underlying hypothesis of this approach is that
the musical mood of retrieved results changes in relation to the volume balance of different instruments. On the basis of this
hypothesis, we aim to clarify the relationship between the change in the volume balance of a query and the genre of the retrieved
pieces, called genre classification shift. Such an understanding would allow us to instruct users in how to generate alternative queries
without finding other appropriate pieces. Our QBE system first separ ates all instrument parts from the audio signal of a piece with
the help of its musical score, and then it allows users remix these parts to change the acoustic features that represent the musical
mood of the piece. Experimental results showed that the genre classification shift was actually caused by the volume change in the
vocal, guitar, and drum parts.
1. Introduction
One of the most promising approaches in music information
retrieval is query-by-example (QBE) retrieval [1–7], where
a user can receive a list of musical pieces ranked by their
similarity to a musical piece (example) that the user gives as
a query. This approach is powerful and useful, but the user
has to prepare or find examples of favorite pieces, and it is
sometimes difficult to control or change the retrieved pieces
after seeing them because another appropriate example
should be found and given to get better results. For example,
even if a user feels that vocal or drum sounds are too strong
in the retrieved pieces, it is difficult to find another piece
that has weaker vocal or drum sounds while maintaining the
basic mood and timbre of the first piece. Since finding such
music pieces is now a matter of trial and error, we need more
direct and convenient methods for QBE. Here we assume that
QBE retrieval system takes audio inputs and treat low-level
acoustic features (e.g., Mel-frequency cepstral coefficients,
spectral gradient, etc.).
We solve this inefficiency by allowing a user to create new
query examples for QBE by remixing existing musical pieces,
that is, changing the volume balance of the instruments. To
obtain the desired retrieved results, the user can easily give
alternative queries by changing the volume balance from
the piece’s original balance. For example, the above problem
can be solved by customizing a query example so that the
volume of the vocal or drum sounds is decreased. To remix
an existing musical piece, we use an original sound source
separation method that decomposes the audio signal of a
musical piece into different instrument parts on the basis
of its musical score. To measure the similarity between the
remixed query and each piece in a database, we use the Earth
Movers Distance (EMD) between their Gaussian Mixture
2 EURASIP Journal on Advances in Signal Processing
Models (GMMs). The GMM for each piece is obtained by
modeling the distribution of the original acoustic features,
which consist of intensity and timbre.
The underlying hypothesis is that changing the volume
balance of different instrument parts in a query grows
diversity of the retrieved pieces. To confirm this hypothesis,
we focus on the musical genre since musical diversity and
musical genre have a certain level of relationship. A music
database that consists of various genre pieces is suitable for
the purpose. We define the term genre classification shift as
the change of musical genres in the retrieved pieces. We
target genres that are mostly defined by organization and
volume balance of musical instruments, such as classical
music, jazz, and rock. We exclude genres that are defined
by specific rhythm patterns and singing style, e.g., waltz and
hip hop. Note that this does not mean that the genre of the
query piece itself can be changed. Based on this hypothesis,
our research focuses on clarifying the relationship between
the volume change of different instrument parts and the
shift in the musical genre of retrieved pieces in order
to instruct a user in how to easily generate a lternative
queries. To clarify this relationship, we conducted three
different experiments. The first experiment examined how
much change in the volume of a single instrument part is
needed to cause a genre classification shift using our QBE
retrieval system. The second experiment examined how the
volume change of two instrument parts (a two-instrument
combination for volume change) cooperatively affects the
shift in genre classification. This relationship is explored
by examining the genre distribution of the retrieved pieces.
These experimental results show that the desired genre
classification shift in the QBE results was easily achieved by
simply changing the volume balance of different instruments
in the query. The third experiment examined how the
source separation performance affects the shift. The retrieved
pieces using sounds separated by our method are compared
with those using original sounds before mixing down in
producing musical pieces. The experimental result showed
that the separation performance for predictable feature shifts
depends on an instrument part.
2. Query-by-Example Retrieval by
Remixed Musical Audio Signals
In this section, we describe our QBE retrieval system for
retrieving musical pieces based on the similarity of mood
between musical pieces.
2.1. Genre Classification Shift. Our original term “genre
classification shift” means a change in the musical genre
of pieces based on auditory features, which is caused by
changing the volume balance of musical instruments. For
example, by boosting the vocal and reducing the guitar and
drums of a popular song, auditory features are extracted
from the modified song are similar to the features of a jazz
song. The instrumentation and volume balance of musical
instruments affects the musical mood. The musical genre
does not have direct relation to the musical mood but
genre classification shift in our QBE approach suggests that
remixing query examples grow the diversity of retrieved
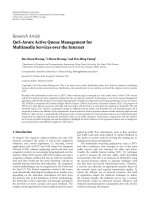
results. As shown in Figure 1, by automatically separating
the original recording (audio signal) of a piece into musical
instrument parts, a user can change the volume balance of
these parts to cause a genre classification shift.
2.2. Acoustic Feature Extraction. Acoustic features that rep-
resent the musical mood are designed as shown in Ta bl e 1
upon existing studies of mood extraction [8]. These features
extracted from the power spectrogram, X(t, f ), for each
frame (100 frames per second). The spectrogram is calcu-
lated by short-time Fourier transform of the monauralized
input audio signal, where t and f are the frame and
frequency indices, respectively.
2.2.1. Acoustic Intensity Features. Overall intensity for each
frame, S
1
(t), and intensity of each subband, S
2
(i, t), are
defined as
S
1
(
t
)
=
F
N
f =1
X
t, f
, S
2
(
i, t
)
=
F
H
(i)
f =F
L
(i)
X
t, f
,(1)
where F
N
is the number of frequency bins of the power
spectrogram and F
L
(i)andF
H
(i) are the indices of lower and
upper bounds for the ith subband, respectively. The intensity
of each subband helps to represent acoustic brightness. We
use octave filter banks that divide the power spectrogram into
n octave subbands:
1,
F
N
2
n−1
,
F
N
2
n−1
,
F
N
2
n−2
, ,
F
N
2
, F
N
,(2)
where n is the number of subbands, which is set to 7 in
our experiments. These filter banks cannot be constructed
because they have ideal frequency response; we implemented
these by division and sum of the power spectrogram.
2.2.2. Acoustic Timbre Features. Acoustic timbre features
consist of spectral shape features and spectral contrast
features, which are known to be effective in detecting musical
moods [8, 9]. The spectral shape features are represented by
spectral centroid S
3
(t), spectral width S
4
(t), spectral rolloff
S
5
(t), and spectral flux S
6
(t):
S
3
(
t
)
=
F
N
f =1
X
t, f
f
S
1
(
t
)
,
S
4
(
t
)
=
F
N
f =1
X
t, f
f − S
3
(
t
)
2
S
1
(
t
)
,
S
5
(
t
)
f =1
X
t, f
= 0.95S
1
(
t
)
,
S
6
(
t
)
=
F
N
f =1
log X
t, f
−
log X
t −1, f
2
.
(3)
EURASIP Journal on Advances in Signal Processing 3
A popular song
Sound source separation
Drums
Guitar
Vocal
Sound
source
Mixdown
Re-mixed
recordings
Volume balance
control by users
Genre-shifted
queries
Re etri val
results
Jazz songs
Dance songs
Popular songs
Popular songs
Dr. Gt. Vo.
Dr. Gt. Vo.
Dr.
Gt. Vo.
Jazz-like mix
Dance-like mix
Vol u meVol u meVolume
Original
recording
Popular-like mix
(same as the or iginal)
QBE-MIR
system
Figure 1: Overview of QBE retrieval system based on genre classification shift. Controlling the volume balance causes a genre classification
shift of a query song, and our system returns songs that are similar to the genre-shifted query.
Table 1: Acoustic features representing musical mood.
Acoustic intensity features
Dim. Symbol Description
1 S
1
(t) Overall intensity
2–8 S
2
(i, t) Intensity of each subband
∗
Acoustic timbre features
Dim. Symbol Description
9 S
3
(t)Spectralcentroid
10 S
4
(t) Spectral width
11 S
5
(t) Spectral rolloff
12 S
6
(t)Spectralflux
13–19 S
7
(i, t) Spectral peak of each subband
∗
20–26 S
8
(i, t) Spectralvalleyofeachsubband
∗
27–33 S
9
(i, t) Spectralcontrastofeachsubband
∗
∗
7-band octave filter bank.
Thespectralcontrastfeaturesareobtainedasfollows.Let
avector,
(
X
(
i, t,1
)
, X
(
i, t,2
)
, , X
(
i, t, F
N
(
i
)))
,(4)
be the power spectrogram in the tth frame and ith subband.
By sorting these elements in descending order, we obtain
another vector,
(
X
(
i, t,1
)
, X
(
i, t,2
)
, , X
(
i, t, F
N
(
i
)))
,(5)
where
X
(
i, t,1
)
>X
(
i, t,2
)
>
···>X
(
i, t, F
N
(
i
))
(6)
as shown in Figure 3 and F
N
(i) is the number of the ith
subband frequency bins:
F
N
(
i
)
= F
H
(
i
)
− F
L
(
i
)
. (7)
4 EURASIP Journal on Advances in Signal Processing
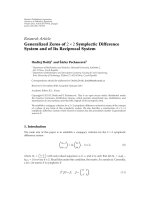
(a) −∞dB (b) −5dB (c) ±0dB (d) +5 dB (e) +∞dB
Figure 2: Distributions of the first and second principal components of extra cted features from the no. 1 piece of the RWC Music Database:
Popular Music. Five figures show the shift of feature distr ibution by changing the volume of the drum part. The shift of feature distribution
causes the genre classification shift.
X(i, t,1)
X(i, t,2)
X(i, t,3)
Power
spectrogram
Frequency index
Sort
Index
Power
Power
(X(i, t, 1), , X(i, t, F
N
(i)))
(X
(i, t, 1), , X
(i, t, F
N
(i)))
X
(i, t,1)
X
(i, t,2)
X
(i, t,3)
Figure 3: Sorted vector of power spectrogram.
Here, the spectral contrast features are represented by
spectral peak S
7
(i, t), spectral valley S
8
(i, t), and spectral
contrast S
9
(i, t):
S
7
(
i, t
)
= log
⎛
⎝
βF
N
(i)
f
=1
X
i, t, f
βF
N
(
i
)
⎞
⎠
,
S
8
(
i, t
)
= log
⎛
⎝
F
N
(i)
f
=(1−β)F
N
(i)
X
i, t, f
βF
N
(
i
)
⎞
⎠
,
S
9
(
i, t
)
= S
7
(
i, t
)
− S
8
(
i, t
)
,
(8)
where β is a parameter for extracting stable peak and valley
values, which is set to 0.2 in our experiments.
2.3. Similarity Calculation. Our QBE retrieval system needs
to calculate the similarity between musical pieces, that is, a
query example and each piece in a database, on the basis of
the overall mood of the piece.
To model the mood of each piece, we use a Gaussian
Mixture Model (GMM) that approximates the distribution
of acoustic features. We set the number of mixtures to 8
empirically, although a previous study [8]usedaGMMwith
16 mixtures since we used smaller database than that study
for experimental evaluation. Although the dimension of the
obtained acoustic features was 33, it was reduced to 9 by
using the principal component analysis where the cumulative
percentage of eigenvalues was 0.95.
To measure the similarity among feature distributions,
we utilized Earth Movers Distance (EMD) [10]. The EMD
is based on the minimal cost needed to transform one
distribution into another one.
3. Sound Source Separation Using
Integrated Tone Model
As mentioned in Section 1, musical audio signals should
be separated into instrument parts beforehand to boost
and reduce the volume of those parts. Although a number
of sound source separation methods [11–14]havebeen
studied, most of them still focus on dealing with music
performed on either pitched instruments that have harmonic
sounds or drums that have inharmonic sounds. For example,
most separation methods for harmonic sounds [11–14]
cannot separate inharmonic sounds, while most separation
methods for inharmonic sounds, such as drums [15], cannot
separate harmonic ones. Sound source separation methods
based on the stochastic properties of audio signals, for
example, independent component analysis and sparse coding
[16–18], treat par ticular kind of audio signals which are
recorded with a microphone array or have small number
of simultaneously voiced musical notes. However, these
methods cannot separate complex audio signals such as
commercial CD recordings. We describe our sound source
separation method which can separate complex audio signals
with both harmonic and inharmonic sounds in this section.
The input and output of our method are described as
follows:
input power spectrogram of a musical piece and its
musical score (standard MIDI file); standard MIDI
files for famous songs are often available thanks to
Karaoke applications; we assume the spectrogram
and the score have already been aligned (synchro-
nized) by using another method;
output decomposed spectrograms that correspond to
each instrument.
EURASIP Journal on Advances in Signal Processing 5
To separate the power spectrogram, we approximate the
power spectrogram which is purely additive. By playing back
each track of the SMF on a MIDI sound module, we prepared
a sampled sound for each note. We call this a template sound
and used it as prior information (and initial values) in the
separation. The musical audio signal corresponding to the
decomposed power spectrogram is obtained by using the
inverse short-time Fourier transform with the phase of the
input spectrogram.
In this section, we fi rst define the problem of separating
sound sources and the integrated tone model. This model
is based on a previous study [19], and we improved
implementation of the inharmonic models. We then derive
an iterative algorithm that consists of two steps: sound source
separation and model par ameter estimation.
3.1. Integrated Tone Model of Harmonic and Inharmonic Mod-
els. Separating the sound source means decomposing the
input power spectrogram, X(t, f ),intoapowerspectrogram
that corresponds to each musical note, where t and f are the
time and the frequency, respectively. We assume that X(t, f )
includes K musical instruments and the kth instrument
performs L
k
musical notes.
We use an integrated tone model, J
kl
(t, f ), to represent
the power spectrogram of the lth musical note performed by
the kth musical instrument ((k, l)th note). This tone model
is defined as the sum of harmonic-stru cture tone models,
H
kl
(t, f ), and inharmonic-structure tone models, I
kl
(t, f ),
multiplied by the whole amplitude of the model, w
(J)
kl
:
J
kl
t, f
=
w
(J)
kl
w
(H)
kl
H
kl
t, f
+ w
(I)
kl
I
kl
t, f
,(9)
where w
(J)
kl
and (w
(H)
kl
, w
(I)
kl
) satisfy the following constraints:
k,l
w
(J)
kl
=
X
t, f
dt df , ∀k, l : w
(H)
kl
+ w
(I)
kl
= 1. (10)
The harmonic tone model, H
kl
(t, f ), is defined as
a constrained two-dimensional Gaussian Mixture Model
(GMM), which is a product of two one-dimensional GMMs,
u
(H)
klm
E
(H)
klm
(t)and
v
(H)
kln
F
(H)
kln
( f ). This model is designed
by referring to the HTC source model [20]. Analogously,
the inharmonic tone model, I
kl
(t, f ), is defined as a con-
strained two-dimensional GMM that is a product of two
one-dimensional GMMs,
u
(I)
klm
E
(I)
klm
(t)and
v
(I)
kln
F
(I)
kln
( f ).
The temporal structures of these tone models, E
(H)
klm
(t)and
E
(I)
klm
(t), are defined as an identical mathematical formula,
but the frequency structures, F
(H)
kln
( f )andF
(I)
kln
( f ), are
defined as different forms. In the previous study [19], the
inharmonic models are implemented in a nonparametric
way. We changed the inharmonic model by implementing
in a parametric way. This change improves generalization of
the integrated tone model, for example, timbre modeling and
extension to a bayesian estimation.
The definitions of these models are as fol lows:
H
kl
t, f
=
M
H
−1
m=0
N
H
n=1
u
(H)
klm
E
(H)
klm
(
t
)
v
(H)
kln
F
(H)
kln
f
,
I
kl
t, f
=
M
I
−1
m=0
N
I
n=1
u
(I)
klm
E
(I)
klm
(
t
)
v
(I)
kln
F
(I)
kln
f
,
E
(H)
klm
(
t
)
=
1
√
2πρ
(H)
kl
exp
⎛
⎜
⎝
−
t −τ
(H)
klm
2
2
ρ
(H)
kl
2
⎞
⎟
⎠
,
F
(H)
kln
f
=
1
√
2πσ
(H)
kl
exp
⎛
⎜
⎝
−
f − ω
(H)
kln
2
2
σ
(H)
kl
2
⎞
⎟
⎠
,
E
(I)
klm
(
t
)
=
1
√
2πρ
(I)
kl
exp
⎛
⎜
⎝
−
t −τ
(I)
klm
2
2
ρ
(I)
kl
2
⎞
⎟
⎠
,
F
(I)
kln
f
=
1
√
2π
f + κ
log β
exp
−
F
f
− n
2
2
,
τ
(H)
klm
= τ
kl
+ mρ
(H)
kl
,
ω
(H)
kln
= nω
(H)
kl
,
τ
(I)
klm
= τ
kl
+ mρ
(I)
kl
,
F
f
=
log
f/κ
+1
log β
.
(11)
All parameters of J
kl
(t, f ) are listed in Tab le 2.Here,M
H
and
N
H
are the numbers of Gaussian kernels that represent tem-
poral and frequency structures of the harmonic tone model,
respectively, and M
I
and N
I
are the numbers of Gaussians
that represent those of the inharmonic tone model. β and κ
are coefficients that determine the arrangement of Gaussian
kernels for the frequency structure of the inharmonic model.
If 1/(log β)andκ are set to 1127 and 700, F ( f )isequivalent
to the mel scale of f Hz. Moreover u
(H)
klm
, v
(H)
kln
, u
(I)
klm
,andv
(I)
kln
satisfy the following conditions:
∀k, l :
m
u
(H)
klm
= 1,
∀k, l :
n
v
(H)
kln
= 1,
∀k, l :
m
u
(I)
klm
= 1,
∀k, l :
n
v
(I)
kln
= 1.
(12)
As shown in Figure 5,functionF
(I)
kln
( f )isderivedby
changing the variables of the following probability density
function:
N
g; n,1
=
1
√
2π
exp
−
g − n
2
2
, (13)
6 EURASIP Journal on Advances in Signal Processing
Power
Frequency
Time
∑
m
u
(H)
klm
E
(H)
klm
(t)
∑
n
v
(H)
kln
F
(H)
kln
( f )
(a) overview of harmonic tone model
Power
Time
∑
m
u
(H)
klm
E
(H)
klm
(t)
u
(H)
kl0
E
(H)
kl0
(t)
u
(H)
kl1
E
(H)
kl1
(t)
u
(H)
kl2
E
(H)
kl2
(t)
τ
kl
ρ
(H)
kl
(b) temporal structure of harmonic tone model
Frequency
Power
σ
(H)
kl
ω
(H)
kl
2ω
(H)
kl
3ω
(H)
kl
v
(H)
kl1
F
(H)
kl1
( f )
v
(H)
kl2
F
(H)
kl2
( f )
v
(H)
kl3
F
(H)
kl3
( f )
(c) frequency str ucture of harmonic tone model
Figure 4: Overall, temporal, and frequency structures of the harmonic tone model. This model consists of a two-dimensional Gaussian
Mixture Model, and it is factorized into a pair of one-dimensional GMMs.
Power
123 78
g
n
( f ) = v
(I)
kln
N (F ( f ); n,1)
g
1
( f )
g
7
( f )
g
2
( f )
g
8
( f )
g
3
( f )
F ( f )
Sum of these
(a) Equally-spaced Gaussian kernels along the log-scale frequency,
F ( f ).
f
Power
F
−1
(1) F
−1
(2) F
−1
(3) F
−1
(7) F
−1
(8)
H
n
( f ) ∝ (v
(I)
kln
/( f + k))N (F ( f ); n,1)
H
1
( f )
H
7
( f )
H
2
( f )
H
8
( f )
H
3
( f )
Sum of these
(b) Gaussian kernels obtained by changing the random variables
of the kernels in (a).
Figure 5: Frequency structure of inharmonic tone model.
EURASIP Journal on Advances in Signal Processing 7
Table 2: Parameters of integrated tone model.
Symbol Description
w
(J)
kl
Overall amplitude
w
(H)
kl
, w
(I)
kl
Relative amplitude of harmonic and inharmonic tone models
u
(H)
klm
Amplitude coefficient of temporal power envelope for harmonic tone model
v
(H)
kln
Relative amplitude of the nth harmonic component
u
(I)
klm
Amplitude coefficient of temporal power envelope for inharmonic tone model
v
(I)
kln
Relative amplitude of the nth inharmonic component
τ
kl
Onset time
ρ
(H)
kl
Diffusion of temporal power envelope for harmonic tone model
ρ
(I)
kl
Diffusion of temporal power envelope for inharmonic tone model
ω
(H)
kl
F0 of harmonic tone model
σ
(H)
kl
Diffusion of harmonic components along frequency axis
β, κ Coefficients that determine the arrangement of the frequency structure of inharmonic model
from g = F ( f )to f , that is,
F
(I)
kln
f
=
dg
df
N
F
f
; n,1
=
1
f + κ
log β
1
√
2π
exp
−
F
f
−
n
2
2
.
(14)
3.2. Iterative Separation Algorithm. The goal of this separa-
tion is to decompose X(t, f ) into each (k, l)th note by mul-
tiplying a spectrogram distribution function, Δ
(J)
(k, l; t, f ),
that satisfies
∀k, l, t, f :0≤ Δ
(J)
k, l; t, f
≤ 1,
∀t, f :
k,l
Δ
(J)
k, l; t, f
= 1.
(15)
With Δ
(J)
(k, l; t, f ), the separated power spectrogram,
X
(J)
kl
(t, f ), is obtained as
X
(J)
kl
t, f
= Δ
(J)
k, l; t, f
X
t, f
. (16)
Then, let Δ
(H)
(m, n; k, l, t, f )andΔ
(I)
(m, n; k, l, t, f )bespec-
trogram distribution functions that decompose X
(J)
kl
(t, f )
into each Gaussian distribution of the harmonic and inhar-
monic models, respectively. These functions satisfy
∀k, l, m, n, t, f :0≤ Δ
(H)
m, n; k, l, t, f
≤
1,
∀k, l, m, n, t, f :0≤ Δ
(I)
m, n; k, l, t, f
≤
1,
(17)
∀k, l, t, f :0≤
m,n
Δ
(H)
m, n; k, l, t, f
+
m,n
Δ
(I)
m, n; k, l, t, f
=
1.
(18)
With these functions, the separated power spectrograms,
X
(H)
klmn
(t, f )andX
(I)
klmn
(t, f ), are obtained as
X
(H)
klmn
t, f
=
Δ
(H)
m, n; k, l, t, f
X
(J)
kl
t, f
,
X
(I)
klmn
t, f
= Δ
(I)
m, n; k, l, t, f
X
(J)
kl
t, f
.
(19)
To evaluate the effectiveness of this separation, we use
an objective func tion defined as the Kullback-Leibler (KL)
divergence from X
(H)
klmn
(t, f )andX
(I)
klmn
(t, f ) to each Gaussian
kernel of the harmonic and inharmonic models:
Q
(Δ)
=
k,l
⎛
⎝
m,n
X
(H)
klmn
t, f
×
log
X
(H)
klmn
t, f
u
(H)
klm
v
(H)
kln
E
(H)
klm
(
t
)
F
(H)
kln
f
dt df
+
m,n
X
(I)
klmn
t, f
×
log
X
(I)
klmn
t, f
u
(I)
klm
v
(I)
kln
E
(I)
klm
(
t
)
F
(I)
kln
f
dt df
⎞
⎠
.
(20)
The spectrogram distribution functions are calculated by
minimizing Q
(Δ)
for the functions. Since the functions
satisfy the constraint given by (18), we use the method of
Lagrange multiplier. Since Q
(Δ)
is a convex function for
the spectrogram distribution functions, we first solve the
simulteneous equations, that is, der ivatives of the sum of Q
(Δ)
and Lagrange multipliers for condition (18)areequaltozero,
and then obtain the spectrogram distribution functions,
Δ
(H)
m, n; k, l, t, f
=
E
(H)
klm
(
t
)
F
(H)
kln
f
k,l
J
kl
t, f
,
Δ
(I)
m, n; k, l, t, f
=
E
(I)
klm
(
t
)
F
(I)
kln
f
k,l
J
kl
t, f
,
(21)
8 EURASIP Journal on Advances in Signal Processing
and decomposed spectrograms, that is, separated sounds, on
the basis of the parameters of the tone models.
Once the input spectrogram is decomposed, the like-
liest model parameters are calculated using a statistical
estimation. We use auxiliary objective functions for each
(k, l)th note, Q
(Y)
k,l
, to estimate robust parameters with power
spectrogram of the template sounds, Y
kl
(t, f ). The (k, l)th
auxiliary objective function is defined as the KL divergence
from Y
(H)
klmn
(t, f )andY
(I)
klmn
(t, f ) to each Gaussian kernel of
the harmonic and inharmonic models:
Q
(Y)
k,l
=
m,n
Y
(H)
klmn
t, f
log
Y
(H)
klmn
t, f
u
(H)
klm
v
(H)
kln
E
(H)
klm
(
t
)
F
(H)
kln
f
dt df
+
m,n
Y
(I)
klmn
t, f
log
Y
(I)
klmn
t, f
u
(I)
klm
v
(I)
kln
E
(I)
klm
(
t
)
F
(I)
kln
f
dt df ,
(22)
where
Y
(H)
klmn
t, f
=
Δ
(H)
m, n; k, l, t, f
Y
kl
t, f
,
Y
(I)
klmn
t, f
=
Δ
(I)
m, n; k, l, t, f
Y
kl
t, f
.
(23)
Then, let Q be a modified objective function that is defined
as the weig hted sum of Q
(Δ)
and Q
(Y)
k,l
with weight parameter
α:
Q
= αQ
(Δ)
+
(
1 − α
)
k,l
Q
(Y)
k,l
. (24)
We can prevent the overtraining of the models by gradually
increasing α from 0 (i.e., the estimated model should first
be close to the template spectrogram) through the iteration
of the separation and adaptation (model estimation). The
parameter update equations are derived by minimizing Q.
We experimentally set α to 0.0, 0.25, 0.5, 0.75, and 1.0 in
sequence and 50 iterations are sufficient for parameter con-
vergence with each alpha value. Note that this modification
of the objective function has no direct effect on the calcu-
lation of the distribution functions since the modification
never changes the relationship between the model and the
distribution function in the objective function. For all α
values, the optimal distribution functions are calculated from
only the models written in (21). Since the model parameters
are changed by the modification, the distribution functions
are also changed indirectly. The par ameter update equations
are described in the appendix.
We obtain an iterative algorithm that consists of two
steps: calculating the distribution function while the model
parameters are fixed and updating the parameters under the
distribution function. This iterative algorithm is equivalent
to the Expectation-Maximization (EM) algorithm on the
basis of the maximum a posteriori estimation. This fact
ensures the local convergence of the model parameter
estimation.
4. Exper imental Evaluation
We conducted two experiments to explore the relationship
between instrument volume balances and genres. Given the
Table 3: Number of musical pieces for each genre.
Genre Number of pieces
Popular 6
Rock 6
Dance 15
Jazz 9
Classical 14
query musical piece in which the volume balance is changed,
the genres of the retrieved musical pieces are investigated.
Furthermore, we conducted an experiment to explore the
influence of the source separation performance on this
relationship, by comparing the retrieved musical pieces
using clean audio signals before mixing down (original)and
separated signals (separated).
Ten musical pieces were excerpted for the query from
the RWC Music Database: Popular Music (RWC-MDB-P-
2001 no. 1–10) [21]. The audio signals of these musical
pieces were separated into each musical instrument part
using the standard MIDI files, which are provided as the
AIST annotation [22]. The evaluation database consisted
of 50 other musical pieces excerpted from the RWC
Music Databas e: Musical Genre (RWC-MDB-G-2001). This
excerpted database includes musical pieces in the following
genres: popular, rock, dance, jazz, and classical. The number
of pieces are listed in Tabl e 3.
In the experiments, we reduced or boosted the volumes
of three instrument parts—vocal, guitar, and drums. To shift
the genre of the retrieved musical piece by chang ing the
volume of these parts, the part of an instrument should
have sufficient duration. For example, the volume of an
instrument that is performed for 5 seconds in a 5-minute
musical piece may not affect the genre of the piece. Thus,
the above three instrument parts were chosen because they
satisfy the following two constraints:
(1) played in all 10 musical pieces for the query,
(2) played for more than 60% of the duration of each
piece.
At />∼itoyama/qbe/,sou-
nd examples of remixed signals and retrieved results are
available.
4.1. Volume Change of Single Instrument. TheEMDswere
calculated between the acoustic feature distributions of each
query song and each piece in the database as described
in Section 2.3, while reducing or boosting the volume of
these musical instrument parts between 20 and +20 dB.
Figure 6 shows the results of changing the volume of a single
instrument part. The vertical axis is the relative ratio of the
EMD averaged over the 10 pieces, which is defined as
EMD ratio
=
average EMD of each genre
average EMD of all genres
. (25)
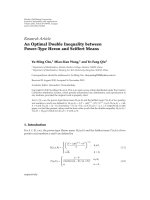
The results in Figure 6 clearly show that the genre
classification shift occurred by changing the volume of any
EURASIP Journal on Advances in Signal Processing 9
0.7
0.8
0.9
1
1.1
1.2
1.3
−20 −10
01020
Similar Dissimilar
EMD ratio
Volume control ratio of vocal part (dB)
JazzRock
Rock
Popular
Popular
Jazz
Dance
Classical
(a) genre classification shift caused by changing the volume of vocal. Genre
with the highest similarity changed from rock to popular and to jazz
0.7
0.8
0.9
1
1.1
1.2
1.3
−20 −10
01020
Volume control ratio of guitar part (dB)
Similar Dissimilar
EMD ratio
Rock
Popular
Rock
Popular
Jazz
Dance
Classical
(b) genre classification shift caused by changing the volume of guitar. Genre
with the highest similarity changed from rock to popular
0.7
0.8
0.9
1
1.1
1.2
1.3
−20 −10
01020
Volume control ratio of drums part (dB)
Similar Dissimilar
EMD ratio
Popular Rock Dance
Rock
Popular
Jazz
Dance
Classical
(c) genre classification shift caused by changing the volume of drums. Genre
with the highest similarity changed from popular to rock and to dance
Figure 6: Ratio of average EMD per genre to average EMD of all genres while reducing or boosting the volume of single instrument part.
Here, (a), (b), and (c) are for the vocal, guitar, and drums, respectively. Note that a smaller ratio of the EMD plotted in the lower area of
the graph indicates higher similarity. (a) Genre classification shift caused by changing the volume of vocal. Genre with the highest similarity
changed from rock to popular and to jazz. (b) Genre classification shift caused by changing the volume of guitar. Genre with the highest
similarity changed from rock to popular. (c) Genre classification shift caused by changing the volume of drums. Genre with the highest
similarity changed from popular to rock and to dance.
instrument part. Note that the genre of the retrieved pieces
at 0 dB (giving the original queries without any changes) is
the same for all three Figures 6(a), 6(b),and6(c). Although
we used 10 popular songs excerpted from the RWC Music
Database: Popular Music for the queries, they are considered
to be rock music as the genre with the highest similarity at
0 dB because those songs actually have the true rock flavor
with strong guitar and drum sounds.
By increasing the volume of the vocal from
−20 dB, the
genre with the highest similarity shifted from rock (
−20 to
4dB)topopular(5to9dB)andtojazz(10to20dB)as
shown in Figure 6(a). By changing the volume of the guitar,
the genre shifted from rock (
−20 to 7 dB) to popular (8 to
20 dB) as shown in Figure 6(b). Although it was commonly
observed that the genre shifted from rock to popular in both
cases of vocal and guitar, the genre shifted to jazz only in the
case of vocal. These results indicate that the vocal and guitar
would ha v e differentimportance in jazz music. By changing
the volume of the drums, genres shifted from popular (
−20
to
−7dB) to rock (−6 to 4 dB) and to dance (5 to 20 dB)
10 EURASIP Journal on Advances in Signal Processing
−20
−20
−10
−10
0
0
10
10
20
20
Volume control ratio of vocal part (dB)
Volume control ratio of guitar part (dB)
(a) genre classification shift caused by changing the volume of vocal and
guitar
−20
−20
−10
−10
0
10
10
20
20
0
Volume control ratio of vocal part (dB)
Volume control ratio of drums part (dB)
(b) genre classification shift caused by changing the volume of vocal and
drums
−20
−10
−10
0
10
10
20
20
0
−20
Volume control ratio of guitar part (dB)
Volume control ratio of drums part (dB)
(c) genre classification shift caused by changing the volume of guitar and
drums
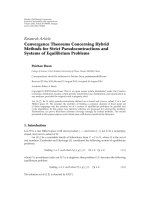
Figure 7: Genres that have the smallest EMD (the highest similarity) while reducing or boosting the volume of two instrument parts. (a),
(b), and (c) are the cases of the vocal-guitar, vocal-drums, and guitar-drums, respectively. (a) Genre classification shift caused by changing
the volume of vocal and guitar. (b) Genre classification shift caused by changing the volume of vocal and drums. (c) Genre classification shift
caused by changing the volume of guitar and drums.
as shown in Figure 6(c). These results indicate a reasonable
relationship between the instrument volume balance and the
genre classification shift, and this relationship is consistent
with typical impressions of musical genres.
4.2. Volume Change of Two Instruments (Pair). The EMDs
were calculated in the same way as the previous experiment.
Figure 7 shows the results of simultaneously changing the
volume of two instrument parts (instrument pairs). If one
of the parts is not changed (at 0 dB), the results are the same
as those in Figure 6.
Although the basic tendency in the genre classification
shifts is similar to the single instrument experiment, classical
music, which does not appear as the genre with the highest
EURASIP Journal on Advances in Signal Processing 11
−5
0510
15
−0.3
−0.2
−0.1
0
0.1
0.2
0.3
Shifted EMD
Volume control ratio of vocal part (dB)
Similar Dissimilar
Popular
Dance
Jazz
Original
Separated
Popular
Dance
Jazz
(a) normalized EMDs by changing the volume of vocal
−5
05
10
15
−0.3
−0.2
−0.1
0
0.1
0.2
0.3
Shifted EMD
Volume control ratio of vocal part (dB)
Similar Dissimilar
Popular
Dance
Jazz
Original
Separated
Popular
Dance
Jazz
(b) normalized EMDs by changing the volume of guitar
−5
05
10
15
−0.3
−0.2
−0.1
0
0.1
0.2
0.3
Shifted EMD
Volume control ratio of vocal part (dB)
Similar Dissimilar
Popular
Dance
Jazz
Original
Separated
Popular
Dance
Jazz
(c) normalized EMDs by changing the volume of drums
Figure 8: Normalized EMDs that are shifted to 0 when the volume control ratio is 0 dB for each genre while reducing or boosting the
volume. (a), (b), and (c) graphs are obtained by changing the volume of the vocal, guitar, and drum parts, respectively. Note that a smaller
EMD plotted in the lower area of each graph indicates higher similarity than the one without volume controlling. (a) Normalized EMDs by
changing the volume of vocal. (b) Normalized EMDs by changing the volume of guitar. (c) Normalized EMDs by changing the volume of
drums.
similarity in Figure 6,appearsinFigure 7(b) when the vocal
part is boosted and the drum part is reduced. The similarity
of rock music decreased when we separately boosted either
the guitar or the drums, but it is interesting that rock music
can keep the highest similarity if both the guitar and drums
are boosted together as shown in Figure 7(c). This result
closely matched with the typical impression of rock music,
and it suggests promising possibilities for this technique as a
tool for customizing the query for QBE retrieval.
4.3. Comparison between Original and Separated Sounds. The
EMDs were calculated while reducing or boosting the volume
of the musical instrument parts between
−5and+15dB.
Figure 8 shows the normalized EMDs that are shifted to 0
when the volume control ratio is 0 dB. Since all query songs
are popular music, EMDs between query songs and popular
pieces in the evaluation database tend to be smaller than
the pieces of other genres. In this experiment, EMDs were
normalized because we focused on the shifts in the acoustic
features.
By changing the volume of the drums, the EMDs plotted
in Figure 8(c) have similar curves in both of the original
and separated conditions. On the other hand, by changing
the volume of the guitar, the EMDs plotted in Figure 8(b)
showed that a curve of the original condition is different from
a curve of the separa tion condition. This result indicates
that the shifts of features in those conditions were different.
Average source separation performance of the guitar part
was
−1.77 dB, which was a lower value than those of vocal
and drum parts. Noises included in the separated sounds
12 EURASIP Journal on Advances in Signal Processing
of the guitar part induced this difference. By changing the
volume of the vocal, the plotted EMDs of popular and
dance pieces have similar curves, but the EMDs of jazz
pieces have different curves, although the average source
separation performance of the vocal part is the highest
among these three instrument parts. This result indicates
that the separation performance for predictable feature shifts
depends on the instrument part.
5. Discussions
The aim of this paper is achieving a QBE approach which
can retrieve diverse musical pieces by boosting or reducing
the volume balance of the instruments. To confirm the
performance of the QBE approach, evaluation using a music
database which has wide variations is necessar y. A music
database that consists of various genre pieces is suitable for
the purpose. We defined the term genre classification shift as
the change of musical genres in the retrieved pieces since we
focus on the diversity of the retrieved pieces not on musical
genre change of the query example.
Although we conducted objective experiments to evalu-
ate the effectiveness of our QBE approach, several questions
remain as open questions.
(1) More evidences of our QBE approach by subjective
experiments are needed whether the QBE retrieval
system can help users search better results.
(2) In our experiments, we used only popular musical
pieces as query examples. Remixing query examples
except popular pieces can shift genres of retrieved
results.
For source separation, we use the MIDI representation
of a musical signal. Mixed and separated musical signals
contain variable features: timbre difference from musical
instruments’ individuality, characteristic performances of
instrument players such as vibrato, and environments such
as room reverberation and sound effects. These features
can be controlled implicitly by changing the volume of
musical instruments and therefore QBE systems can retrieve
various musical pieces. Since MIDI representations do not
contain these features, diversity of retrieved musical pieces
will decrease and users cannot evaluate the mood difference
of the pieces if we use only musical signals which are
synthesized from MIDI representations.
In the experiments, we used precisely synchronized
SMFs at most 50 milliseconds of onset timing error. In
general, synchronization between CD recordings and their
MIDI representations is not enough for separation. Previous
studies on audio-to-MIDI synchronization methods [23, 24]
can help this problem. We experimentally confirmed that
onset timing error under 200 milliseconds does not decrease
source separation performance. Another problem is that
the proposed separation method needs a complete musical
score with melody and accompaniment instruments. A study
of source separation method with a MIDI representation
of specified instrument part [25] will help solving the
accompaniment problem.
In this paper, we aimed to analyze and decompose a mix-
ture of harmonic and inharmonic sounds by appending the
inharmonic model to the harmonic model. To achieve this,
a requirement must be satisfied: one-to-one basis-source
mapping based on structured and parameterized source
model. The HTC source model [20], on which our integrated
model is based, satisfies the requirement. Adaptive harmonic
spectral decomposition [26] has modeled a harmonic struc-
ture in a different way. They are suitable for multiple-pitch
analysis and applied to polyphonic music transcription. On
the other hand, the nonnegative matrix factorization ( NMF)
is usually used for separating musical instrument sounds
and extracting simple repeating patterns [27, 28]andonly
approximates complex audio mixture since the one-to-one
mapping is uncertified. Efficient feature extraction from
complex audio mixtures will be promising by combining
lower-order analysis using structured models such as the
HTC and higher-order analysis using unconstrained models
such as the NMF.
6. Conclusions
We have described how musical genres of retrieved pieces
shift by changing the volume of separated instrument parts
and explained a QBE retrieval approach on the basis of
such genre classification shift. This approach is important
because it was not possible for a user to customize the QBE
query in the past, which required the user to always find
different pieces to obtain different retr ieved results. By using
the genre classification shift based on our original sound
source separation method, it becomes easy and intuitive to
customize the QBE query by simply changing the volume
of instrument parts. Experimental results confirmed our
hypothesis that the musical genre shifts in relation to the
volume balance of instruments.
Although the current genre shift depends on only the
volume balance, other factors such as rhythm patterns, sound
effects, and chord progressions would also be useful for
causing the shift if we could control them. In the future,
we plan to pursue the promising approach proposed in this
paper and develop a better QBE retrieval system that easily
reflects the user’s intention and preferences.
Appendix
P arameter Update Equations
The update equation for each parameter derived from the
M-step of the EM algorithm is described here. We solved
the simultaneous equations, that is, derivatives of the sum of
the cost function (24), and Lagrange multipliers for model
parameter constraints, (10)and(12), are equal to zero. Here
we introduce the weighted sum of decomposed powers:
Z
kl
t, f
=
αΔ
(J)
k, l; t, f
X
t, f
+
(
1 − α
)
Y
kl
t, f
,
Z
(H)
klmn
t, f
= Δ
(H)
m, n; k, l, t, f
Z
kl
t, f
,
Z
(I)
klmn
t, f
= Δ
(I)
m, n; k, l, t, f
Z
kl
t, f
.
(A.1)
EURASIP Journal on Advances in Signal Processing 13
The summation or integration of the decomposed power
over indices, variables, and suffixes is denoted by omitting
these characters, for example,
Z
(H)
kl
t, f
=
m,n
Z
(H)
klmn
t, f
,
Z
(H)
klm
(
t
)
=
n
Z
(H)
klmn
t, f
df.
(A.2)
w
(J)
kl
is the overall amplitude:
w
(J)
kl
= Z
(H)
kl
+ Z
(I)
kl
. (A.3)
w
(H)
kl
and w
(I)
kl
are the relative amplitude of harmonic and
inharmonic tone models:
w
(H)
kl
=
Z
(H)
kl
Z
(H)
kl
+ Z
(I)
kl
,
w
(I)
kl
=
Z
(I)
kl
Z
(H)
kl
+ Z
(I)
kl
.
(A.4)
u
(H)
klm
is the amplitude coefficient of temporal power envelope
for harmonic tone model:
u
(H)
klm
=
Z
(H)
klm
Z
(H)
kl
. (A.5)
v
(H)
kln
is the relative amplitude of the nth harmonic compo-
nent:
v
(H)
kln
=
Z
(H)
kln
Z
(H)
kl
. (A.6)
u
(I)
kln
is the amplitude coefficient of temporal power envelope
for inharmonic tone model:
u
(I)
klm
=
Z
(I)
klm
Z
(I)
kl
. (A.7)
v
(I)
kln
is the relative amplitude of the nth inharmonic compo-
nent:
v
(I)
kln
=
Z
(I)
kln
Z
(I)
kl
. (A.8)
τ
kl
is the onset time:
τ
kl
=
m
t−mρ
(H)
kl
Z
(H)
klm
(
t
)
dt+
m
t−mρ
(I)
kl
Z
(I)
klm
(
t
)
dt
Z
(H)
kl
+Z
(I)
kl
(A.9)
ω
(H)
kl
ω
(H)
kl
is the F0 of harmonic tone model:
ω
(H)
kl
=
n
nfZ
(H)
kln
f
df
n
n
2
Z
(H)
kln
, (A.10)
σ
(H)
kl
is the diffusion of harmonic components along fre-
quency axis:
σ
(H)
kl
=
⎛
⎜
⎜
⎝
n
f − nω
(H)
kl
2
Z
(H)
kln
f
df
Z
(H)
kl
⎞
⎟
⎟
⎠
1/2
. (A.11)
Acknowledgments
This research was partially supported by the Ministry of
Education, Science, Sports and Culture, a Grant-in-Aid
for Scientific Research of Priority Areas, the Primordial
Knowledge Model Core of Global COE program, and the JST
CrestMuse Project.
References
[1] A. Rauber, E. Pampalk, and D. Merkl, “Using psycho-acoustic
models and self-organizingmaps to create a hierarchical
structuring of music bysound similarity,” in Proceedings of
the International Conference on Music Information Retrieval
(ISMIR ’02), pp. 71–80, 2002.
[2] C. C. Yang, “The MACSIS acoustic indexingframework for
music retrieval: an experimental study,” in Proceedings of
the International Conference on Music Information Retrieval
(ISMIR ’02), pp. 53–62, 2002.
[3] E. Allamanche, J. Herre, O. Hellmuth, T. Kastner, and
C. Ertel, “A multiple feature model for musical similarity
retrieval,” in Proceedings of the International Conference on
Music Information Retrieval (ISMIR ’03), pp. 217–218, 2003.
[4] Y. Feng, Y. Zhuang, and Y. Pan, “Music information retrieval
by detecting mood viacomputational media aesthetics,” in
Proceedings of the International Conference on Web Intelligence
(WI ’03), pp. 235–241, 2003.
[5] B. Thoshkahna and K. R. Ramakrishnan, “Projektquebex: a
query by example system for audioretrieval,” in Proceedings of
the Internat ional Conference on Multimedia and Expo (ICME
’05), pp. 265–268, 2005.
[6] F. Vignoli and S. Pauws, “A music retrievalsystem based on
user-driven similarity and its evaluation,” in Proceedings of
the International Conference on Music Information Retrieval
(ISMIR ’05), pp. 272–279, 2005.
[7] T. Kitahara, M. Goto, K. Komatani, T. Ogata, and H. G.
Okuno, “Musical instrument recognizer “instrogram” and
its application to music retrieval based on instrumentation
similarity,” in Proceedings of the Annual International Supply
Management Conference (ISM ’06), pp. 265–274, 2006.
[8] L. Lu, D. Liu, and H. J. Zhang, “Automatic mood detection and
tracking of music audio signals,” IEEE Transactions on Audio,
Speech and Language Processing, vol. 14, no. 1, pp. 5–18, 2006.
[9] D N. Jiang, L. Lu, H J. Zhang, J H. Tao, and L H. Cai,
“Music type classification by spectral contrast features,” in
Proceedings of the International Conference on Multimedia and
Expo (ICME ’02), pp. 113–116, 2002.
[10] Y.Rubner,C.Tomasi,andL.J.Guibas,“Ametricfordistribu-
tions with applications to image databases,” in Proceedings of
the International Conference On Computer Vision (ICCV ’98),
pp. 59–66, 1998.
[11] T. Virtanen and A. Klapuri, “Separation of harmonic sounds
using linear models for t he overtone series,” in Proceedings of
the International Conference on Acoustics, Speech and Signal
Processing (ICASSP ’02), vol. 2, pp. 1757–1760, 2002.
14 EURASIP Journal on Advances in Signal Processing
[12] M. R. Every and J. E. Szymanski, “A spectralfiltering approach
to music signal separation,” in Proceedings of the Con-
ference on Digital Audio Effects (DAFx ’04), pp. 197–200,
2004.
[13] J. Woodruff, P. Pardo, and R. Dannenberg, “Remixing stereo
music with score-informed source separation,” in Proceedings
of the International Conference on Music Information Retrieval
(ISMIR ’06), pp. 314–319, 2006.
[14] H. Viste and G. Evangelista, “A method for separation of
overlapping partials based on similarity of temporal envelopes
in multichannel mixtures,” IEEE Transactions on Audio, Speech
and Language Processing, vol. 14, no. 3, pp. 1051–1061,
2006.
[15] D. Barry, D. Fitzgerald, E. Coyle, and B. Lawlor, “Drum source
separation using percussive feature detection and spectral
modulation,” in Proceedings of the Irish Signals and Systems
Conference (ISSC ’05), pp. 13–17, 2005.
[16] H. Saruwatari, S. Kurita, K. Takeda, F. Itakura, T. Nishikawa,
and K. Shikano, “Blind source separation combining inde-
pendent component analysis and beamforming,” EURASIP
Journal on Applied Signal Processing, vol. 2003, no. 11, pp.
1135–1146, 2003.
[17] M. A. Casey and A. Westner, “Separation of mixed audio
sources by independent subspace analysis,” in Pro ceedings of
the International Computer Music Conference (ICMC ’00),pp.
154–161, 2000.
[18]M.D.Plumbley,S.A.Abdallah,J.P.Bello,M.E.Davies,G.
Monti, and M. B. Sandler, “Automatic music transcription and
audio source separation,” Cybernetics and Systems, vol. 33, no.
6, pp. 603–627, 2002.
[19] K. Itoyama, M. Goto, K. Komatani, T. Ogata, and H. G.
Okuno, “Integration and adaptation of harmonic and inhar-
monic models for separating polyphonic musical signals,” in
Proceedings of the International Conference on Acoustics, Speech
and Signal Processing (ICASSP ’07), pp. 57–60, 2007.
[20] H. Kameoka, T. Nishimoto, and S. Sagayama, “A multipitch
analyzer based on harmonic temporal structured clustering,”
IEEE Transactions on Audio, Speech and Language Processing,
vol. 15, no. 3, pp. 982–994, 2007.
[21] M. Goto, H. Hashiguchi, T. Nishimura, and R. Oka, “RWC
music database: popular, classical, and jazz music databases,”
in Proceedings of the International Conference on Music Infor-
mation Retrieval (ISMIR ’02), pp. 287–288, 2002.
[22] M. Goto, “AIST annotation for the RWC music database,” in
Proceedings of the International Conference on Music Informa-
tion Retrieval (ISMIR ’06), pp. 359–360, 2006.
[23] R. J. Turetsky and D. P. W. Ellis, “Groundtruth transcriptions
of real music from force-aligned MIDI synthesis,” in Pro-
ceedings of the International Conference on Music Information
Retrieval (ISMIR ’03), 2003.
[24] M. Muller, Information Retrieval for Musicand Motion,chapter
5, Springer, Berlin, Germany, 2007.
[25] N. Yasuraoka, T. Abe, K. Itoyama, K. Komatani, T. Ogata,
and G. Hiroshi, “Changing timbre and phrase in existing
musical performances as you like,” in Proceedings of the ACM
International Conference on Multimedia (ACM-MM ’09),pp.
203–212, 2009.
[26] E. Vincent, N. Bertin, and R. Badeau, “Adaptive harmonic
spectral decomposition for multiple pitch estimation,” IEEE
Transactions on Audio, Speech and Language Processing, vol. 18,
no. 3, pp. 528–537, 2010.
[27] M. N. Schmidt and M. Mørup, “Nonnegative matrix factor 2-
D deconvolution for blind single channel source separ ation,”
in Proceedings of the International Workshop on Independent
Component Analysis and Signal Separation (ICA ’06), pp. 700–
707, April 2006.
[28] P. Smaragdis, “Convolutive speech bases and their application
to supervised speech separation,” IEEE Transactions on Audio,
Speech and Language Processing, vol. 15, no. 1, pp. 1–12, 2007.