Báo cáo hóa học: " Research Article QoS-Aware Active Queue Management for Multimedia Services over the Internet" potx
Bạn đang xem bản rút gọn của tài liệu. Xem và tải ngay bản đầy đủ của tài liệu tại đây (870.85 KB, 12 trang )
Hindawi Publishing Corporation
EURASIP Journal on Wireless Communications and Networking
Volume 2011, Article ID 589863, 12 pages
doi:10.1155/2011/589863
Research Article
QoS-Aware Active Queue Management for
Multimedia Services over the Internet
Bor-Jiunn Hwang,
1
I-Shyan Hwang,
2
andPen-MingChang
2
1
Depar tment of Computer and Communication Engineering, Ming Chuan University, Tao-Yuan 33348, Taiwan
2
Department of Computer Science and Engineering, Yuan Ze University, Chung Li 32003, Taiwan
Correspondence should be addressed to I-Shyan Hwang,
Received 21 October 2010; Accepted 7 February 2011
Academic Editor: Fabrizio Granelli
Copyright © 2011 Bor-Jiunn Hwang et al. This is an open access article distributed under the Creative Commons Attribution
License, which permits unrestricted use, distribution, and reproduction in any medium, provided the original work is properly
cited.
Recently, with multimedia services such as IPTV, video conferencing has emerged as a main traffic source. When UDP coexists
with TCP, it induces not only congestion collapse but also an unfairness problem. In this paper, a new Active Queue Management
algorithm, called Traffic Sensitive Active Queue Management (TSAQM), is proposed for providing multimedia services in routers.
The TSAQM is comprised of Dynamic Weight Allocate Scheme (DWAS) and Service Guarantee Scheme (SGS). The purpose of
DWAS is to fairly allocate resources with high end-user utility, and the SGS is to determine the satisfactory threshold (TH) and
threshold region (TR). Besides, a multiqueue design for different priority traffic, and threshold TH and threshold region TR is
proposed to achieve the different QoS requirements. Several objectives of this proposed scheme include achieving high end user
utility for video services, considering the multicast as well as unicast proprieties to meet interclass fairness, and achieving the QoS
requirement by adaptively adjusting the thresholds based on the traffic situations. Performance comparisons with the GRED-I
are in terms of packet dropping rate and throughput to highlight the better behavior of the proposed schemes due to taking into
account the fairness and different weights for video layers.
1. Introduction
To improve the congestion collapse problem, the early TCP
protocol prompted the study of end-to-end congestion
avoidance and control algorithms [1]. Recently, several
applications, such as IPTV and VoIP, using User Datagram
Protocol (UDP) without employing end-to-end flow and
congestion control, are increasingly being deployed over the
Internet. When UDP coexists with TCP, it induces not only a
congestion collapse problem but also an unfairness problem
that each flow cannot get the same treatment, causing an
unstable Internet and lower link utilization. The congestion
control methodologies can be categorized as the Primal and
the Dual [2]. The Primal congestion control is the source
node dynamically adjusting the sending rate or window sizes
depending on the indication information fed back from
the Internet. Due to the limitations of Prime methodology,
the Dual plays a more important role through assisting in
the provision of more accurate and quick feedback. The
congest control algorithm for Dual is implemented in routers
gathering traffic flow information, such as flow numbers
and traffic load, and sends implicit or explicit feedback to
the sender or receiver node for revising the sending rate or
making active queue management.
The multimedia streaming applications, such as IPTV
and video conference, have emerged as one of the main
traffic sources with less tolerance for delay and jitters.
Usually, the scalable layered coding (SVC) [3] technique
is used to increase the end-user utility under diversified
environments. The SVC is an extension of H.264/AVC using
the layered structure scheme to generate multilayer with
one base layer and several enhancement layers. Therefore,
a receiver can subscribe an appropriate scenario based on
the network status and required transmission quality. To
ensure the efficient use of network resources, this kind
of application adapts the multicast technique to deliver
the contents. Besides, the multicast service over a wireless
environment results in enhanced resource efficiency and
reduced transmission power consumption due to the wireless
multicast advantage [4]property.
2 EURASIP Journal on Wireless Communications and Networking
When the wireless technique is mature enough to be the
last mile solution, the IPTV multicast services under the
wire and wireless environments, such as the integration of
EPON and WiMAX [5], will become a trend. However, all
the proposed active queue management mechanisms do not
consider the multicast services, and the proposed algorithms
assume the same weight for unicast and multicast connec-
tions. However, this is unfair for the multicast connection,
which will cause poor system performance in light of the
entire network average video quality. Therefore, in this paper,
we will propose a QoS-aware active queue management
method with multiqueues multithresholds, in which the
property of video coding as well as multicast delivery is taken
into account in one shot.
The rest of the paper is organized as follows. Section 2
surveys the related works. The system design is described
in detail in Section 3. The system performance is analyzed
and discussed in Section 4. Finally, the paper draws the
conclusions in Section 5.
2. Related Works
The Primal methodology has two types, which are classified
based on the way of reaction to congestion, adjusting
the congestion window size, termed Window-Based, or the
packet transmission gap, termed Rate-Based. The Rate-based
is more suitable for delivering real-time trafficbecauseit
can provide a more smooth transmission rate and it has no
need to wait for an ACK message from the receivers [6–
8]. The Primal methodologies [9, 10] use the fluid model
to analyze the Internet traffic load or use probing-based
methods including the probe gap model (PGM) and probe
rate model (PRM) to estimate the residue bandwidth in the
bottleneck [11–13]. In essence, those algorithms regarding
the amount of packet loss and value of RTT’s variation
imply that network congestion occurs. However, the packet
loss is not only due to congestion occurrence but also the
environment interference, that is, fading or interference in
the wireless channel or high bandwidth delay environment.
The Dual methodology, Active Queue Management
(AQM), can be divided into two main categories including
the closed-loop control and the open-loop control depending
on whether the algorithm uses feedback information. For
closed-loop control, the most well-known proposals are
RED, Adaptive-RED (ARED) [14], and BLUE [15]. The
RED’s main idea is using two predefined thresholds, mini-
mum and maximum thresholds to separate the queue length
as three congestion grades and adjust the packet dropping
rate according to different situations. The ARED dynamically
adjusts RED’s thresholds based on the observed queue length
and tries to maintain the queuing delay within a target
range. BLUE [15] uses packets loss and link-idle events as
the critical factors to adjust the packet dropping probability
rather than the queue length. In the open-loop control, the
most promising proposals are RAP [16], XCP [17], and its
extended researches [18, 19]. The main objective of this
category is to achieve the incoming data rate equal to the
output link capacity of the router, and each trafficflowis
allocated the same bandwidth simultaneously ensuring lower
queue sizes. This category can eliminate the high bandwidth-
delay product network effect on the TCP’s throughput, which
is inversely proportional to the RTT, to satisfy the TCP -
friendly property [8]. However, the above congestion control
algorithms only adopt the homogeneous fairness resource
allocation method.
The studies [20–22] alleviate this problem by modifying
the AQM design. In [20], the proposed algorithm rearranges
the order of packets in the queue of the router and dynami-
cally adjusts the packet dropping rate and the target queuing
average size based on the packet arrival time, incoming
traffic’s requirements, and delay hint. The study in [21]
uses three levels of RED to emulate the class-based design
that each level sets parameters according to different traffic
requirements and based on that determines if the incoming
packet is accepted. The research in [22]providesdifferent
dropping rate adjusting algorithms for TCP and UDP with
TCP-friendly property for the diversity traffi
c characteristics.
However, the above surveyed algorithms cannot satisfy the
delay and throughput requirements simultaneously since it
only adopts one-queue design for all types of traffic.
In regard to delivery video, several researches [23–26]
utilize the video coding technique to improve throughput
and end-user utility when congestion occurs. In view of the
video coding technique, the literature in [23] concerning
XCP extending research adds an addition header field to
record how many resources have been assigned to each
flow so the sender can know which layers should be
delivered. In the literatures [24–28], they support different
QoS using priority dropping queue management and a
packet marking technique. In [29], the authors adopt the
SCED+ scheduler for guaranteeing the delay requirement.
In researches [19, 25–30], the proposed various algorithms
satisfy the QoS requirements by utilizing the scheduler and
marking technique. However, it is too complex and results in
additional process overhead in the router.
In summary, current AQM algorithms have the following
problems: (1) most algorithms cannot achieve the delay
and throughput requirements simultaneously. On the other
hand, some AQM algorithms can satisfy each traffictype’s
requirement, but those algorithms are too complex and
unsuitable for high traffic load, causing heavy computing
overhead. (2) The above mentioned algorithms barely
consider the video traffic characteristics that only adopt
the homogeneous fairness bandwidth allocation policy. (3)
They do not consider the multicast service property, thus
leading to low bandwidth efficiency and poor system average
video quality. (4) Current AQM algorithms only utilize the
adjusting packet dropping rate to overcome the congestion
problem. However, it should not only adjust the packet
dropping rate but also consider the congestion level, and
theAQMwillbemoreefficientinreactingtovarioustraffic
loads. (5) Most AQM algorithms do not have the adaptabil-
ity, and those algorithms have to be trained or adjust a set
of parameters to meet the diverse trafficloadandrouter
link capacity. It is a challenge to overcome the congestion
problem to consider the video coding technique, bandwidth
efficiency, and different traffic’s QoS requirements for more
outstanding performance.
EURASIP Journal on Wireless Communications and Networking 3
Tr affic
Tr affic classification
λ
1
λ
2
λ
3
λ
4
q
1
q
2
q
3
q
4
UDP CBR
traffic
UDP multicast
VBR traffic
UDP
unicast VBR traffic
TCP traffic
th
1
α
1
α
1
tr
1
th
2
α
2
α
2
tr
2
th
3
α
3
α
3
tr
3
th
4
α
4
α
4
tr
4
μ
1
μ
2
μ
3
μ
4
w
1
w
2
w
3
w
4
Scheduler
BW
Queuesize:L
···
···
···
···
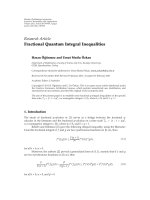
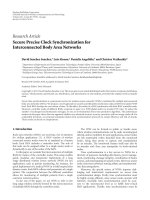
Figure 1: System design.
In this paper, the Traffic Sensitive Active Queue Man-
agement (TSAQM) scheme is proposed to overcome those
problems. Several objectives of this proposed scheme are
described as follows: first, a Dual methodology congestion
control algorithm is proposed to meet the QoS requirement
of different services using the multiqueues multithresholds
mechanism cooperating with the weight-based scheduler
algorithm; second, it achieves high end-user utility for video
service; third, it considers the multicast as well as unicast
proprieties to meet interclass fairness; fourth, it has the ability
to adaptively adjust the parameters of TSAQM according to
the time-varying trafficloads.
3. System Design
The system design, as shown in Figure 1,hasfourtypes
of traffic including UDP CBR (constant bit rate) traffic,
UDP VBR (variable bit rate) multicast traffic (MVBR),
UDP unicast traffic with VBR (UVBR), and TCP traffic.
The threshold TH denotes the mean of maximum and
minimum thresholds; the threshold region TR denotes the
value between maximum and minimum thresholds. The
Tr affic Sensitive Active Queue Management (TSAQM) with
Dynamic Weight Allocate Scheme (DWAS) and Service
Guarantee Scheme (SGS) is proposed for QoS-aware active
queue management.
3.1. System Environment. Based on Figure 1, the four queues
with four thresholds and weight-based scheduler are pro-
posed; in addition, four individual FIFO queues, Q
=
{
q
1
, q
2
, q
3
, q
4
},aresetfordifferent traffic classes, T =
{
t
1
, t
2
, t
3
, t
4
}, respectively, where the traffic class t
1
is the
UDP trafficwithCBR(B
CBR
), the traffic classes t
2
and t
3
are the multicast and the unicast UDP traffic with VBR, and
the traffic class t
4
is TCP traffic. For traffictypesofVBR,
each flow contains VL video layers and the bandwidth of
each layer is denoted as LB
={lb
1
,lb
2
,lb
3
, ,lb
VL
}.The
arrival rates and service rates for different traffic classes are
λ
={λ
1
, λ
2
, λ
3
, λ
4
} and μ ={μ
1
, μ
2
, μ
3
, μ
4
}, and the QoS
requirement vector is denoted as R
={r
1
, r
2
, r
3
, r
4
}, including
the delay, packet dropping rate, and throughput.
Since the performance of GRED-I [31] is better than both
RED and GRED [32, 33], each queue applies GRED-I buffer
management with threshold TH and threshold region TR
for different traffic classes in the proposed TSAQM scheme,
in which threshold TH and threshold region TR denote
the vector of each queue’s threshold and threshold region,
respectively. The purpose of the threshold for different traffic
classes, TH
={th
1
,th
2
,th
3
,th
4
}, is estimated to determine
the packet dropping rate, and the threshold region for
different traffic classes, TR
={tr
1
,tr
2
,tr
3
,tr
4
}, where the
tr
i
= (th
i
− σ
i
,th
i
+ σ
i
) with threshold range σ
i
for different
traffic classes, i
= 1, 2, 3,4, is cooperated with TH to estimate
suitable parameters for current traffic conditions. Further,
to achieve effective resource utilization, the dynamic weight-
based scheduler is adopted with weights for different traffic
classes, W
={w
1
, w
2
, w
3
, w
4
}, as a scheduler mechanism.
ThesystemterminologiesaresummarizedinTa bl e 1 .
3.2. Traffic Sensitive Active Queue Management (TSAQM).
The flowchart of TSAQM, shown in Figure 2, has two main
tasks: one is to allocate resources with fairness and high end-
user utility in the Dynamic Weight Allocate Scheme (DWAS),
and the other is to determine the satisfactory threshold (TH)
and threshold region (TR) in the Service Guarantee Scheme
(SGS).
The DWAS is used to allocate bandwidth and adjust
the weights mechanism of W for different traffic classes
to achieve better resource utilization. Differential service
fairness delimitation, termed Differ-TCP-Friendly,ispro-
posed to provide the minimum requirement of each class
first and then distribute residue bandwidth for TSAQM.
Then, the thresholds (TH) and threshold regions (TR)
are determined by a one-dimensional Markov-chain model
in the SGS to precisely adjust the thresholds to meet
the QoS requirement of each traffic class. The parameter
terminologies are summarized in Tab le 2 .
4 EURASIP Journal on Wireless Communications and Networking
Table 1: System terminologies.
Notation Description
T ={t
1
, t
2
, t
3
, t
4
}
t
1
is the CBR UDP traffic class, t
2
and t
3
are the multicast and the unicast VBR UDP traffic class, and t
4
is the TCP traffic class.
λ
={λ
1
, λ
2
, λ
3
, λ
4
} Vector of each traffic class’s arrival rate.
μ
={μ
1
, μ
2
, μ
3
, μ
4
} Vector of each traffic class’s service rate.
R
={r
1
, r
2
, r
3
, r
4
} Vector of each traffic class’s QoS requirement.
B
CBR
Constant bitrates traffic’s requirement bandwidth.
VL Number of video layers including one base layer and VL
−1 enhanced layers.
LB
={lb
1
,lb
2
,lb
N
} Vector of SVC video source’s each layer requirement bandwidth.
TH
={th
1
,th
2
,th
3
,th
4
} Vector of each queue’s threshold.
TR
={tr
1
,tr
2
,tr
3
,tr
4
} Vector of threshold region tr
i
= (th
i
− σ
i
,th
i
+ σ
i
).
σ
={σ
1
, σ
2
, σ
3
, σ
4
} Vector of the threshold range cooperated with TH as the reinitiated TSAQM critical term.
W
={w
1
, w
2
, w
3
, w
4
} Vector of each queue’s scheduler weight.
Start
DWAS dynamic
distributes bandwidth to
each class
SGS determines thresholds
and threshold regions
End
Figure 2: Flowchart of TSAQM.
3.2.1. Dynamic Weight Allocate Scheme (DWAS). The DWAS,
shown in Figure 3, has two phases: the first is to satisfy the
minimum throughput requirement of each traffic class, and
the second is to use the DRBS (Distribute Residue Bandwidth
Scheme) to distribute the residue bandwidth with Differ-
TCP-Friendly to all traffic classes, except the CBR traffic. The
DWAS distributes bandwidth to traffics T
={t
1
, t
2
, t
3
, t
4
}
based on the traffic priority and current active connections,
N
={n
1
, n
2
, n
3
, n
4
},fordifferent traffic classes. The traffic
classes t
1
, t
2
,andt
3
have the property that the data rate
is constant or has staircase-like bit rates, and traffic class,
t
4
, is throughput sensitive without a minimum throughput
requirement. However, to satisfy the Differ-TCP-Friendly,
the DWAS allocates bandwidth to traffic class, t
4
, using the
assumption that the minimum requirement of traffic class,
t
4
, is the maximum throughput requirement of CBR and
VBR.
The DWAS algorithm is shown in Algorithm 1,inwhich
the allocation procedure is in t
1
, t
2
, t
3
,andt
4
order. The
bandwidth allocation unit for VBR traffic is the bandwidth
of each layer of SVC. In DWAS, only the bandwidth of the
first video layer is allocated, that is, lb
1
, to meet minimum
requirement of t
2
and t
3
.Fort
4
, the bandwidth is allocated
as the maximum of both lb
1
and B
CBR
in DWAS. If there is
residue bandwidth, then DRBS is executed. The final step
of DWAS is to normalize the weights of each traffictype.
The purpose of DRBS is to allocate the residue bandwidth
in lb
2
,lb
3
,andlb
4
order. While all the layer’s bandwidthes
are met or the residue bandwidth is insufficient for any
class’s requirement, the resource will be equally divided to
all traffic classes, except CBR traffic, based on the proportion
of current active connection(s). The details of the procedure
of the DRBS algorithm are shown in Algorithm 2.
3.2.2. Service Guarantee Scheme (SGS). The SGS algorithm
is shown in Algorithm 3. If the incoming traffic class, t
i
,
is delay-sensitive traffic, it checks that the trend flag, tf
i
,
is in a decreasing trend (higher than the upper bound) or
an increasing trend (less than lower bound of threshold
region). When the trend flag indicates that the situation is
decreasing, then the threshold, th
i
,subtractsε
delay
; otherwise,
it adds ε
delay
,whereε
delay
is the adjusting TH unit. Then,
the SGS verifies the adjustment outcome using the Quality
Verification (QV) function to verify whether the current
threshold setting meets the required QoS.
The detail of the QV function is shown in Algorithm 4,
where the parameters in terms of throughput (TP), delay
time (DT), and packet dropping rate (PD) are obtained
from the one-dimensional Markov-chain model, and it will
be explained in detail in the next section. When the traffic
class is throughput sensitive, it uses the Modify BLUE LIKE
(MBL) function, shown in Algorithm 4,toberesponsiveto
the current traffic load by adjusting the packet dropping
rate. According to the QV function, it compares the QoS
requirements of the ith traffic class, r
i
,toTP,DT,and
PD, respectively, for verifying the current TH setting. In
case the requirements cannot be met, the SGS chooses the
minimum value as the TH setting value for guaranteeing the
delay requirement. According to the MBL function, if the
current queue size is longer than TR or equal to L, the th
i
subtracts ε
throughput
; otherwise, it adds ε
throughput
, while there
is no packet arrival in Freeze
time,inwhichε
throughput
is the
EURASIP Journal on Wireless Communications and Networking 5
Table 2: Parameter terminologies.
Notation Description
L System capacity.
Lc
={lc
1
,lc
2
lc
3
lc
1
} Current queue size.
B
w
Router’s link bandwidth.
B
rw
Router’s link residue bandwidth.
Freeze
time Used for adjusting the threshold of throughput-sensitive traffic.
Time
p
delay
From the previous update to the present time of the delay-sensitive traffic class.
Time
p
throughput
From the previous update to the present time of the throughput-sensitive traffic class.
ε
delay
Unit of the adjusting threshold for the delay-sensitive traffic class.
ε
throughput
Unit of the adjusting threshold for the throughput-sensitive traffic class.
N
={n
1
, n
2
, n
3
, n
4
} Vector of active connection(s) for each traffic.
TF
={tf
1
,tf
2
,tf
3
,tf
4
} This flag is used to indicate the queue’s growth trend.
Start
Satisfy the minimum
requirement of each class
Router has
residue bandwidth
Distribute the rest
resource by DRBS()
End
DWAS
Ye s
No
Figure 3: Flowchart of DWAS.
adjusting TH unit. Finally, the variation of connection (CV)
is used as a main critical factor based on the varying packet
queue for each connection to determine the threshold range
(σ
i
):
CV
=
1
PN
PN
k=1
(
x
k
− δ
i
)
2
×
1
PN
PN
k=1
θ
k
− ρ
i
2
,
(1)
where δ
i
and ρ
i
are the average number of connections and
service rates of traffic class i,respectively,χ
k
and θ
k
are the
number of current active connections and arrival rates of the
kth record, respectively, and PN is the history data quantity
from the previous update to the present time.
The TSAQM monitors the system condition and, based
on the result of the threshold region information, determines
the proper moment to update the system parameters. This
can avoid unnecessary initiation, since there is no additional
bandwidth for lower priority traffic, and the initial timing is
defined in Ta bl e 3.
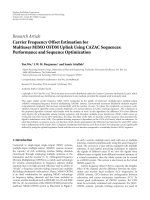
3.2.3. Description of TP, DT, and PD. The one-dimensional
Markov-chain model, shown in Figure 4,isadoptedto
estimate the throughput (TP), delay time (DT), and packet
dropping rate (PD), which is a M/M/1/L/th queuing system
under the First-In-First-Out (FIFO) service discipline. The
traffic arrival follows a Poisson process with an average
arrival rate λ and the service time is exponentially distributed
with mean 1/μ and the total system capacity is L with one
threshold:
d
i
=
⎧
⎪
⎪
⎨
⎪
⎪
⎩
1, 0 ≤ i ≤ th,
1
−
1 −
i − th + 1
L − th + 1
d
max
,th≤ i ≤ L.
(2)
Refering to [33, 34], the packet dropped behavior can
be regarded as the trend to decrease the arrival rate. A
linear dropping equation, d
i
, (obtained from (2)) is used to
represent the packet dropped behavior and the maximum
dropping probability, d
max
,is1.LetP
i
be the probability
of state i,0
≤ i ≤ L, and, based on Figure 8, the balance
equations, (3), (4), and (5) can be obtained:
d
0
× λ × P
0
= μ × P
1
,
(3)
d
i
×λ+μ
×
P
i
=
(
d
i−1
×λ
)
×P
i−1
+μ×P
i+1
,1≤i≤ L,(4)
μ
× P
L
=
(
d
L−1
× λ
)
× P
L−1
,(5)
L
i=0
P
i
= 1.
(6)
The probability P
0
and P
i
can be expressed as follows:
P
i
=
⎛
⎝
i−1
k=0
d
i
× λ
μ
⎞
⎠
P
0
,1≤ i ≤ L,(7)
P
0
=
⎡
⎣
1+
L
i=1
⎛
⎝
i−1
j=0
d
j
× λ
μ
⎞
⎠
⎤
⎦
−1
.
(8)
6 EURASIP Journal on Wireless Communications and Networking
DWAS (){
B
rw
= B
w
IF (n
1
× B
CBR
> 0) {
μ
1
= n
1
× B
CBR
IF (B
rw
− μ
1
≥ 0) {
B
rw
= B
rw
− μ
1
}
Else {
μ
1
= B
rw
B
rw
= 0
}
}
IF (n
2
× lb
1
> 0&&B
rw
> 0) {
μ
2
= n
2
× lb
1
IF (B
rw
− μ
2
≥ 0) {
B
rw
= B
rw
− μ
2
}
Else {
μ
2
= B
rw
B
rw
= 0
}
}
IF (n
3
× lb
1
> 0&&B
rw
> 0) {
μ
3
= n
3
× lb
1
IF (B
rw
− μ
3
≥ 0) {
B
rw
= B
rw
− μ
3
}
Else {
μ
3
= B
rw
B
rw
= 0
}
}
IF (B
rw
> 0) {
μ
4
= MAX(lb
1
, B
CBR
) × n
4
IF (B
rw
<μ
4
) {
μ
4
= B
rw
}
Else{
B
rw
= B
rw
− μ
4
DRBS()
}
}
w
i
=
μ
i
4
j
=1
μ
j
,wherei = 1,2, 3,4
}
Algorithm 1: DWAS algorithm.
Based on the M/M/1/L/th model and Little’s formula,
the throughput, delay time, and packet dropping rate can be
obtained from
TP
=
L−1
i=0
P
i
× d
i
× λ,
DT
=
L
i=0
i · P
i
(
1
− P
0
)
× μ
,
PD
=
L
i=0
P
i
×
(
1
− d
i
)
.
(9)
DRBS {
layer = 0
While (B
rw
> 0&&layer< VL){
layer ++;
IF (n
2
× lb
i
≤ B
rw
) {
μ
2
= μ
2
+ n
2
× lb
i
B
rw
= B
rw
− n
2
× lb
i
}
Else {
μ
i
= μ
i
+
n
i
× B
rw
4
j
=2
n
j
,wherei = 2,3, 4
Break
}
IF (n
3
× lb
i
≤ B
rw
) {
μ
3
= μ
3
+ n
3
× lb
i
B
rw
= B
rw
− n
3
× lb
i
}
Else {
μ
i
= μ
i
+
n
i
× B
rw
4
j
=3
n
j
,wherei = 3,4
Break
}
IF (n
4
× lb
i
≤ B
rw
) {
μ
4
= μ
4
+ n
4
× lb
i
B
rw
= B
rw
− n
4
× lb
i
}
Else {
μ
4
= μ
4
+
B
rw
n
4
Break
}
}
IF (B
rw
> 0) {
μ
i
= μ
i
+
n
i
× B
rw
4
j
=2
n
j
,wherei = 2,3, 4
}
}
Algorithm 2: DRBS algorithm.
4. Performance Analysis
The proposed algorithms are implemented in the routers;
the network simulator 2 (NS-2) is used to estimate the
performance of TSAQM and adopt the dumbbell topology
as the simulation topology, shown in Figure 5, which there
are n sources, n destinations, and two routers [14]. The
bandwidth between the source (or destination) and the
router is 100 Mbps, and the bandwidth between routers is
10 Mbps. The buffer space at the router is set to 100 packets,
as shown in Tables 4, 5,and6 which show the parameters of
traffic class and video source, respectively. The traffic arrival
rates of four types follow the Poisson process. For the data
rate of the CBR the reader is referred to [35]. The VBR video
source is the “HARBOUR” generated by JSVM [36], and the
TCP traffic is generated as the FTP TrafficModel[35].
Based on Figure 5, the router R1 is chosen to evaluate
system performance in terms of the packet dropping rate,
average delay time, and connection throughput as two
EURASIP Journal on Wireless Communications and Networking 7
SGS() {
For i = 1to4{
IF (t
i
is Delay sensitive traffic class) {
IF (tf
i
== decreasing){
bound
upper
= th
i
For (th
i
= bound
upper
;0 ≤ th
i
;th
i
− ε
delay
) {
IF (QV(t
i
,th
i
)! = Satisfy) {
Continue
}
Else {
th
i
= MIN(th
pd
,th
dt
,th
tp
)
Break
}
}
}
Else {
bound
Lower
= th
i
For (th
i
= bound
Lower
;0≤ L;th
i
+ ε
delay
) {
IF (QV(t
i
,th
i
)! = Satisfy) {
Continue
}
Else {
th
i
= MIN(th
pd
,th
dt
,th
tp
)
Break
}
}
}
}
Else {
MBL(t
i
)
}
σ
1
= CV(t
i
)
}
}
Algorithm 3: SGS algorithm.
Table 3: Initial timing.
For the delay sensitive traffic class:
(1) Exist one traffic’s L
C
> (tr
i
+ α
i
)
(2) Exist one traffic’s L
C
< (tr
i
− α
i
)
For the throughput sensitive traffic class:
(1) L
C
> (tr +α)
(2) L
C
≥ L
(3) Time
p > Freeze time
simulation scenarios for different CBR and MVBR traffic
arrival rates. Besides, the results of peak of SNR (PSNR) are
given to estimate the impact on video quality.
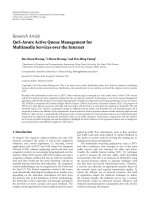
4.1. TSAQM for Different CBR TrafficArrivalRates.In
this case, the arrival rate of CBR is varied from 0.06 to
0.14 (flows/sec), and the others are fixed and set to be
0.065 (flows/sec). Figures 6(a), 6(b),and6(c) show the
average packet dropping rate, delay time, and connection
throughput, respectively, for different CBR arrival rates.
QV(t
i
,th
i
) {
IF (PD(t
i
) ≤ r
i
· delay){
th
pd
= th
i
}
IF (DT(t
i
) ≤ r
i
· drop
rate
) {
th
dt
= th
i
}
IF (TP(t
i
) ≥ r
i
· throughput) {
th
tp
= th
i
}
IF (all r
i
is Satisfied) {
Return Satisfy
}
Else {
Return NoSatisfy
}
}
MBL(t
i
) {
IF (lc
i
> th
i
+tr
i
lc
i
= L) {
th
i
= th
i
− ε
throughput
//increase packet drop rate
}
IF (Time p
throughput
>Freeze time) {
th
i
= th
i
+ ε
throughput
//decrease packet drop rate
}
}
Algorithm 4: QV and MBL functions.
0
th
th + 1
L
λd
0
μ
··· ···
Threshold
λd
th−1
μ
λd
th
μ
λd
th+1
μ
λd
L−1
μ
Figure 4: One-dimensional Markov-chain model.
Figure 6(a) shows the packet dropping rate of the CBR,
MVBR, and UVBR for different CBR arrival rates. The
average packet dropping rate of the CBR is always lower than
the others and is maintained at about 0.005. This shows that
the proposed TSAQM can achieve the dropping guideline
of CBR traffic. The packet dropping rate of MVBR is lower
than UVBR due to the DRBS distributing residue bandwidth
to MVBR through threshold adjustment. When the UVBR
dropping rate is about 15%, it means that the DRBS does not
allocate the bandwidth to the 5th layer video stream. Where
the arrival rate of the CBR is between 0.085 (flows/sec) and
0.095 (flows/sec), the UVBR dropping rate is about 23%,
meaning that the DRBS does not allocate the bandwidth
to the 4th layer video stream. The UVBR dropping rate
is between 23% and 30%, and in the case of the arrival
rate of the CBR being between 0.15 (flows/sec) and 0.105
(flows/sec), it means that the DRBS does not allocate the
bandwidth to the 3rd layer video stream. Similarly, in the
case of the arrival rate of the CBR being higher than 1.0
(flows/sec), the 5th layer video stream will be dropped for
the MVBR.
8 EURASIP Journal on Wireless Communications and Networking
100 Mbps 100Mbps
10 Mbps
.
.
.
.
.
.
S1
S2
S3
Sn
R1 R2
D1
D2
D3
Dn
Figure 5: Simulation topology.
Table 4: System environment parameters.
Environment variable Value
Router queue size 100 (packet size)
Router number 2
Node number 10
Link capacity 10 Mbps
Simulation time 1200 seconds
Maximum dropping rate 1.0
ε
delay
1
ε
throughput
1
Scheduler Weighted fair queuing
Table 5: Parameters of traffic class.
Tr afficclass
Mean of
duration (s)
Data rate
(kbps)
Latency
guideline (ms)
Dropping
guideline
CBR
210 64 150 0.03
Multicast VBR
360 46
∼240 150 N/A
Unicast VBR
360 46
∼240 150 N/A
FTP
180 N/A N/A N/A
Table 6: Video information.
Layer Frame size Frame rate (frame/sec) Data rate (kbps)
1 176 × 144 0.9375 46
2 176
× 144 1.8750 26
3 176
× 144 3.7500 38
4 176
× 144 7.5000 54
5 176
× 144 15.0000 76
Figure 6(b) shows the delay time of the CBR, MVBR, and
UVBR for different CBR arrival rates in which the proposed
TSAQM can achieve the latency guideline of CBR and MVBR
traffics. For the same reason, the delay time of CBR is the
lowest and UVBR is the highest using the DRBS distributing
strategy. When the arrival rate of CBR is higher than 0.1
(flows/sec), the delay time of UBVR is slightly higher than
150 ms. Besides, there are two reasons for the unstable delay
time. First, the frame variation of the “HARBOUR” is more
intense, meaning that the variation of entering queue rate is
higher than the smooth one. Second, the proposed TSAQM
0.1050.10.0950.090.0850.080.0750.070.0650.06
Arrival rate (flow/s)
0
0.05
0.1
0.15
0.2
0.25
0.3
0.35
Packet dropping rate
TSAQM CBR
TSAQM
MVBR
TSAQM
UVBR
(a)
0.1050.10.0950.090.0850.080.0750.070.0650.06
Arrival rate (flow/s)
40
60
80
100
120
140
160
180
Delay time (s)
TSAQM CBR
TSAQM
MVBR
TSAQM
UVBR
(b)
0.1050.10.0950.090.0850.080.0750.070.0650.06
Arrival rate (flow/s)
0
10000
20000
30000
40000
50000
60000
Throughput (KB)
TSAQM CBR
TSAQM
MVBR
TSAQM
UVBR
TSAQM
TCP
(c)
Figure 6: (a) Packet dropping rate. (b) Delay time of the CBR,
MVBR, and UVBR. (c) Throughput of the CBR, MVBR, UVBR,
and TCP for different CBR arrival rates.
EURASIP Journal on Wireless Communications and Networking 9
uses the TR to avoid reinitiating because the burst traffic
arriving will result in a higher TR value and cause a higher
delay than the estimated TSAQM, especially for the heavy
load case.
Figure 6(c) shows the average connection throughput of
CBR, MVBR, and UVBR and total throughput of TCP for
different CBR arrival rates. This shows that the proposed
TSAQM can achieve the required transmission rate for CBR,
MVBR, and UVBR. The mean throughput of the CBR
is about 64 kbps for different CBR arrival rates. Besides,
where the arrival rate of the CBR is 0.085 (flows/sec), the
throughput of TCP clearly increases because the 4th layer
packets of UVBR are dropped, as shown in Figure 6(a). This
is the same phenomenon for the case where the arrival rate
of CBR is 0.1 (flows/sec).
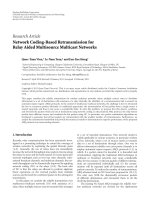
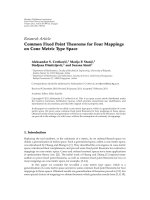
4.2. TSAQM for Different MVBR TrafficArrivals.In this
case, the arrival rate of the MVBR is varied from 0.06 to
0.14 (flows/sec), and the others are fixed and set to be
0.065 (flows/sec). Figures 7(a), 7(b),and7(c) show the
average packet dropping rate, delay time, and connection
throughput, respectively, for different MVBR arrival rates.
Performance comparisons with the GRED-I [31]arepre-
sented in terms of packet dropping rate and throughput to
highlight the better behavior of the proposed schemes.
Comparing Figures 7(a) with 6(a), the packet dropping
rates of the CBR, MVBR, and UVBR in Figure 6(a) are
higher than those in Figure 7(a) because the data rate of
MVBR is higher than CBR. Besides, the packet dropping
rate increases more rapidly than in Figure 6(a) for the UVBR
when the MVBR arrival rate is increased. However, the
impact on MVBR is slight for an increasing MVBR arrival
rate. Figure 6(a) also shows that, in the case of the arrival rate
of MVBR being at 0.085 (flows/sec) and 0.1 (flows/sec), the
DRBS does not allocate the bandwidth to the 4th and the 3rd
layer video streams, respectively, for the MVBR.
Figure 7(b) shows the delay time, of the CBR, MVBR,
and UVBR for different MVBR arrival rates. This shows
that the proposed TSAQM can achieve the latency guideline
of CBR and MVBR traffic through the DRBS distributing
residue bandwidth to them first. Comparing Figure 7(b) with
Figure 6(b), unstable results are shown in Figure 7(b) for an
arrival rate between 0.08 (flows/sec) and 0.1 (flows/sec). The
reason is the same as varying the CBR arrival rate case that
affects frame variation and the TR will be obvious because
the MVBR traffic is increasing. Since the DWRR adopts the
packet based scheduler, the DWAS will be affected since the
packet size varies greatly, and it is more obvious than in
Case 1.
Figure 7(c) shows the average connection throughput
of CBR, MVBR, and UVBR, and total throughput of TCP
for different MVBR arrival rates. This also shows that the
proposed TSAQM can achieve the required transmission
rate for CBR, MVBR, and UVBR. The mean throughput
of CBR is about 64 kbps for different MVBR arrival rates.
Figure 7(a) shows that most packets in the 5th layer video
stream for UVBR are dropped when an arrival rate is 0.070
(flows/sec); therefore, TCP receives more bandwidth. In the
0.1050.10.0950.090.0850.080.0750.070.0650.06
Arrival rate (flow/s)
0
0.05
0.1
0.15
0.2
0.25
0.3
0.35
0.4
Packet dropping rate
TSAQM CBR
TSAQM
UVBR
GRED-I
MVBR
TSAQM
MVBR
GRED-I
CBR
GRED-I
UVBR
(a)
0.1050.10.0950.090.0850.080.0750.070.0650.06
Arrival rate (flow/s)
40
60
80
100
120
140
160
180
Delay time (s)
TSAQM CBR
TSAQM
MVBR
TSAQM
UVBR
(b)
0.1050.10.0950.090.0850.080.0750.070.0650.06
Arrival rate (flow/s)
0
10000
20000
30000
40000
50000
60000
Throughput (KB)
TSAQM CBR
TSAQM
UVBR
GRED-I
CBR
GRED-I
UVBR
TSAQM
MVBR
TSAQM
TCP
GRED-I
MVBR
GRED-I
TCP
(c)
Figure 7: (a) Packet dropping rate. (b) Delay time of the CBR,
MVBR, and UVBR. (c) Throughput of the CBR, MVBR, UVBR,
and TCP for different MVBR arrival rates.
10 EURASIP Journal on Wireless Communications and Networking
case of 0.075 (flows/sec), since a few of the packets of the 4th
layer video stream for UVBR and more packets of the 5th
layer video stream for MVBR are dropped, the TCP achieves
the highest throughput. Since the arrival rate is higher than
0.085 (flows/sec), more packets of MVBR and UVBR are
dropped, and the throughput of TCP is decreased due to
increasing the total UVBR as the UVBR arrival rate increases.
To compare with GRED-I, as shown in Figure 7(a),
because the GRED-I cannot discriminate between the
MVBR and UVBR, the packet dropping rates are almost
the same for GRED-I
UVBR and GRED-I MVBR. This is
unfair for the multicast connection. Additionally, the video
packets are dropped randomly which will cause poor system
performance in light of the entire network average video
quality. Figure 7(c) shows performance results in terms of
throughput of the CBR, MVBR, UVBR, and TCP. The
comparison of the TSAQM highlights better performance
for MVBR, UVBR, and TCP with respect to the throughput.
In particular, the proposed algorithms have taken into
account the fairness and different weights for video layers.
The insignificant video packets, that is, belonging to the
4th and the 3rd layer video streams, have higher dropping
probability.
4.3. Results of Peak of SNR (PSNR). To e s t i m a t e v id e o
quality, the arrival rate of MVBR is varied from 0.06 to
0.14 (flows/sec), and the others are fixed and set to be 0.065
(flows/sec). Figures 8(a), 8(b),and8(c) show the peak of
SNR(PSNR)ofY,U,andV,respectively,forMVBR,UVBR,
and system for different MVBR rates. According to Figures
8(b) and 8(c),thevariationinPSNRforUandVisabout
2.5 dB (i.e., between 36.5 dB and 39 dB). The decrease is more
obvious for Y under an increasing CBR arrival rate, and the
variation is about 6 dB, as shown in Figure 8. In addition, the
values of MVBR are higher than UVBR for all cases because
more packets of UVBR are dropped.
5. Conclusions
In this paper, the proposed Traffic Sensitive Active Queue
Management (TSAQM) is implemented in routers to over-
come problems of current AQM algorithms. Based on the
simulation results, several objectives of this proposed scheme
are achieved including using a multi-queue, multi-threshold
mechanism cooperating with a weight-based scheduler
algorithm to meet the QoS requirement of high end-user
utility for video service, which considers the multicast and
adaptively adjusts the parameters of the TSAQM according to
the time-varying traffic loads. Also, it shows that the TSAQM
can achieve the QoS requirement in a time-varying Internet
by adaptively adjusting the thresholds based on the traffic
situations. Performance comparisons with the GRED-I are
presented in terms of packet dropping rate and throughput
to highlight the better behavior of the proposed schemes due
to taking into account the fairness and different weights for
video layers. Future research will emphasize several issues,
most notably, implementation complexity, the same service
class with diversity QoS and diversity capacities of downlink.
0.090.0850.080.0750.070.0650.06
Arrival rate (flow/s)
0
10
20
PSNR (Y)
TSAQM UVBR
TSAQM
MVBR
System
(a) PSNR of Y
0.090.0850.080.0750.070.0650.06
Arrival rate (flow/s)
0
10
20
30
40
PSNR (U)
TSAQM UVBR
TSAQM
MVBR
System
(b) PSNR of U
0.090.0850.080.0750.070.0650.06
Arrival rate (flow/s)
0
10
20
30
40
PSNR (V)
TSAQM UVBR
TSAQM
MVBR
System
(c) PSNR of V
Figure 8: PSNR of (a) Y, (b) U, and (c) V for MVBR, UVBR, and
system for different MVBR rates.
EURASIP Journal on Wireless Communications and Networking 11
References
[1] V. Jacobson, “Congestion avoidance and control,” ACM SIG-
COMM Computer Communication Review, vol. 25, no. 1, pp.
157–173.
[2]F.P.Kelly,A.K.Maulloo,andD.Tan,“Ratecontrol
for communication networks: shadow prices, proportional
fairness and stability,” Journal of the Operational Research
Society, vol. 49, no. 3, pp. 237–252, 1998.
[3] J. Reichel, H. Schwarz, and M. Wien, “Scalable Video
Coding—Working Draft I Joint Video Team of ITU-T VCEG
and ISO/IEC MPEG,” Doc. JVT-N020, January 2005.
[4] J. E. Wieselthier, G. D. Nguyen, and A. Ephremides, “On
the construction of energy-efficient broadcast and multicast
trees in wireless networks,” in Proceedings of the 19th Annual
Joint Conference of the IEEE Computer and Communications
Societies (INFOCOM ’00), pp. 585–594, March 2000.
[5] K. Yang, S. Ou, K. Guild, and H. H. Chen, “Convergence of
ethernet PON and IEEE 802.16 broadband access networks
and its QoS-aware dynamic bandwidth allocation scheme,”
IEEE Journal on Selected Areas in Communications, vol. 27, no.
2, pp. 101–116, 2009.
[6] J. Widmer, R. Denda, and M. Mauve, “A survey on TCP-
friendly congestion control,” IEEE Network,vol.15,no.3,pp.
28–37, 2001.
[7] S. Ryu, C. Rump, and C. Qiao, “Advances in internet conges-
tion control,” IEEE Communications Surveys & Tutorials, vol.
5, no. 1, pp. 28–39, 2003.
[8] S. C. Tsao, Y. C. Lai, and Y. D. Lin, “Taxonomy and
evaluation of TCP-friendly congestion-control schemes on
fairness, aggressiveness, and responsiveness,” IEEE Network,
vol. 21, no. 6, pp. 6–14, 2007.
[9] Y. Xia, D. Harrison, S. Kalyanaraman, K. Ramachandran,
and A. Venkatesan, “Accumulation-based congestion control,”
IEEE/ACM Transactions on Networking,vol.13,no.1,pp.69–
80, 2005.
[10] H. Shimonishi, T. Hama, and T. Murase, “TCP congestion
control enhancements for streaming media,” in Proceedings
of the 4th Annual IEEE Consumer Communications and
Networking Conference (CCNC ’07), pp. 303–307, January
2007.
[11] J. X. Wang, A. W. Y. Su, Y. C. Chen, and J. N. Hwang,
“Effective congestion and error control for scalable video
coding extension of the H.264/AVC,” in Proceedings of the IEEE
International Symposium on Circuits and Systems (ISCAS ’08),
pp. 1834–1837, May 2008.
[12] D. T. Nguyen and J. Ostermann, “Congestion control for
scalable video streaming using the scalability extension of
H.264/AVC,” IEEE Journal on Selected Topics in Signal Process-
ing, vol. 1, no. 2, pp. 246–253, 2007.
[13] S. S. Wang, H. F. Hsiao, and S. Y. Lee, “Layered congestion
control for scalable video coding based on the efficient band-
width inference,” in Proceedings of the 9th IEEE International
Symposium on Multimedia Workshops (ISM ’07), pp. 417–420,
December 2007.
[14] G. Chatranon, M. A. Labrador, and S. Banerjee, “A survey of
TCP-friendly router-based AQM schemes,” Computer Com-
munications, vol. 27, no. 15, pp. 1424–1440, 2004.
[15] W. C. Feng, K. G. Shin, D. D. Kandlur, and D. Saha,
“The Blue active queue management algorithms,” IEEE/ACM
Transactions on Networking, vol. 10, no. 4, pp. 513–528, 2002.
[16] N. Dukkipati, M. Kobayashi, Z. S. Rui, and N. McKeown,
“Processor sharing flows in the internet,” in Proceedings of the
13th International Wor kshop on Quality of Serv ice (IWQoS ’05),
vol. 3552 of Lecture Notes in Computer Science, pp. 271–285,
June 2005.
[17] D. Katabi, M. Handley, and C. Rohrs, “Congestion control
for high bandwidth-delay product networks,” in Proceedings o f
the Conference on Applications, Technologies, Architectures, and
Protocols for Computer Communications (SIGCOMM ’02),pp.
89–102, August 2002.
[18] F. Abrantes and M. Ricardo, “XCP for shared-access multi-rate
media,” ACM SIGCOMM Computer Communication Review,
vol. 36, no. 4, pp. 27–38.
[19] M. Lestas, A. Pitsillides, P. Ioannou, and G. Hadjipollas,
“Queue length based internet congestion control,” in Pro-
ceedings of the IEEE International Conference on Networking,
Sensing and Control (ICNSC ’07), pp. 584–589, April 2007.
[20] M. Claypool, R. Kinicki, and A. Kumar, “Trafficsensitive
active queue management,” in Proceedings of the 24th Annual
Joint Conference of the IEEE Computer and Communications
Societies(INFOCOM’05), pp. 2764–2769, Miami, Fla, USA,
March 2005.
[21] J. Chung and M. Claypool, “Dynamic-CBT and ChIPS—
router support for improved multimedia performance on
the internet,” in Proceedings of the 8th ACM International
Conference on Multimedia, pp. 239–248, November 2000.
[22] H. S. Chae, M. R. Choi, and T. K. Cho, “Congestion control
for mixed TCP and UDP traffic,” IEICE Transactions on
Communications, vol. E88-B, no. 10, pp. 4097–4101, 2005.
[23] H. F. Hsiao and J. N. Hwang, “A max-min fairness congestion
control for layered streaming of scalable video,” IEEE Transac-
tions on Circuits and Systems for Video Technology, vol. 16, no.
9, pp. 1074–1085, 2006.
[24] S. R. Kang, Y. Zhang, M. Dai, and D. Loguinov, “Multi-layer
active queue management and congestion control for scalable
video streaming,” in Proceedings of the 24th International
Conference on Distributed Computing Systems, pp. 768–777,
March 2004.
[25] K. Nahm, J. Shin, J. Kim, and C C. J. Kuo, “Enhanced service
differentiation for layered video multicast in differentiated
service networks,” in Viual Communications and Image Pro-
cessing, vol. 4671 of Proceedings of SPIE, pp. 46–57, 2002.
[26] X. Yang, J. Liu, and N. Li, “Congestion control based on
priority drop for H.264/SVC,” in Proceedings of the Interna-
tional Conference on Multimedia and Ubiquitous Engineering
(MUE ’07), pp. 585–589, April 2007.
[27] C. K. Siew, G. Feng, F. Long, and M. H. Er, “Congestion control
based on flow-state-dependent dynamic priority scheduling,”
IEE Proceedings Communications, vol. 152, no. 5, pp. 548–558,
2005.
[28] T L. Sheu and Y S. Chi, “Intelligent stale-frame discards for
real-time video streaming over wireless ad hoc networks,”
EURASIP Journal on Wireless Communications and Network-
ing, vol. 2009, Article ID 486165, 10 pages, 2009.
[29] G. G
´
omez, J. Poncela Gonz
´
alez, M. C. Aguayo-Torres, and
J. T. Entrambasaguas Mu
˜
noz, “QoS modeling for end-to-
end performance evaluation over networks with wireless
access,” EURASIP Journal on Wireless Communications and
Networking, vol. 2010, Article ID 831707, 17 pages, 2010.
[30] Y. Huang, R. Gu
´
erin, and P. Gupta, “Supporting excess real-
time traffic with active drop queue,” IEEE/ACM Transactions
on Networking, vol. 14, no. 5, pp. 965–977, 2006.
12 EURASIP Journal on Wireless Communications and Networking
[31] L. Wang, G. Min, and M. Awan, “Modeling and evaluation
of congestion control for different classes of network traffic,”
Concurrency Computation Practice and Experience, vol. 19, no.
8, pp. 1141–1156, 2007.
[32] M. May, C. Diot, B. Lyles, and J. Bolot, “Influence of
active queue management parameters on aggregate traffic
performance,” Tech. Rep. RR3995, INRIA, 2000.
[33] G. Iannaccone, M. May, and C. Diot, “Aggregate traffic
performance with active queue management and drop from
tail,” ACM SIGCOMM Computer Communication Review, vol.
31, no. 3, pp. 4–12, 2001.
[34] H. Beigy and M. R. Meybodi, “A general call admission
policy for next generation wireless networks,” Computer
Communications, vol. 28, no. 16, pp. 1798–1813, 2005.
[35] “Mobile WiMAX—Part 1: A Technical Overview and Perfor-
mance Evaluation,” WiMAX Forum, August 2006.
[36] />