Báo cáo hóa học: " Research Article An Entropy-Based Propagation Speed Estimation Method for Near-Field Subsurface Radar Imaging" ppt
Bạn đang xem bản rút gọn của tài liệu. Xem và tải ngay bản đầy đủ của tài liệu tại đây (14.52 MB, 13 trang )
Hindawi Publishing Corporation
EURASIP Journal on Advances in Signal Pr ocessing
Volume 2010, Article ID 636458, 13 pages
doi:10.1155/2010/636458
Research Ar ticle
An Entropy-Based Propagation Speed Estimation Method for
Near-Field Subsurface Radar Imaging
Daniel Flores-Tapia
1
and Stephen Pistorius
2
1
Department of Medical Physics, CancerCare Manitoba, Winnipeg, MB, Canada
2
Department of Physics and Astronomy, University of Manitoba, Winnipeg, MB, Canada
Correspondence should be addressed to Daniel Flores-Tapia, daniel.fl
Received 26 June 2010; Revised 12 November 2010; Accepted 14 December 2010
Academic Editor: Douglas O’Shaughnessy
Copyright © 2010 D. Flores-Tapia and S. Pistorius. This is an open access article distributed under the Creative Commons
Attribution License, which permits unrestricted use, distribution, and reproduction in any medium, provided the original work is
properly cited.
During the last forty years, Subsurface Radar (SR) has been used in an increasing number of noninvasive/nondestructive imaging
applications, ranging from landmine detection to breast imaging. To properly a ssess the dimensions and locations of the targets
within the scan area, SR data sets have to be reconstructed. This process usually requires the knowledge of the propagation speed
in the medium, which is usually obtained by performing an offline measurement from a representative sample of the materials
that form the scan region. Nevertheless, in some novel near-field SR scenarios, such as Microwave Wood Inspection (MWI) and
Breast Microwave Radar (BMR), the extraction of a representative sample is not an option due to the noninvasive requirements of
the application. A novel technique to determine the propagation speed of the medium based on the use of an information theory
metric is proposed in this paper. The proposed method uses the Shannon entropy of the reconstructed images as the focal quality
metric to generate an estimate of the propagation speed in a given scan region. The performance of the proposed algorithm was
assessed using data sets collected from experimental setups that mimic the dielectric contrast found in BMI and MWI scenarios.
The proposed method yielded accurate results and exhibited an execution time in the order of seconds.
1. Introduction
Subsurface Radar (SR) is a reliable technology that is
currently used for an increasing number of nondestructive
inspection applications [1–5]. SR techniques are used to
image and detect inclusions present in a given scan region
by processing the reflections produced when the area is irra-
diated using electromagnetic waves. Some advantages of SR
technology are the use of nonionizing radiation and a highly
automated and/or portable operation [1]. Targets present
nonlinear signatures in raw SR data that difficult the proper
determination of the correct dimensions and locations of the
inclusions inside the scan region [6, 7]. This phenomenon
is caused by the different signal travel times along the scan
geometry and the wide beam width exhibited by antennas
that operate in the Ultra Wide Band (UWB) frequency range.
To properly detect and visualize the inclusion responses, SR
datasets must be properly reconstructed.
Several reconstruction techniques have been proposed
to form SR images [2, 5–8]. These approaches transfer the
recorded responses from the spatiotemporal domain where
they were collected to the spatial domain where the data
will be displayed. Since SR image formation methods use
either the t ime of arrival of the recorded responses or the
wavenumber of the radiated waveforms, the wave speed
in the propagation medium is required to accurately map
the target reflections to their original spatial locations. This
value can be obtained from offline measurements using a
representative sample of the materials forming the scan area
or by using an estimation technique. Any errors in the
estimate will cause shifts in the location of the reconstructed
responses and the formation of artifacts.
To determine the propagation speed in SR scenarios,
a wide variety of estimation techniques have been pro-
posed. These approaches can b e divided into two main
categories, focal quality measurement techniques and wave
2 EURASIP Journal on Advances in Signal Pr ocessing
modeling approaches. Focal quality measurement techniques
reconstruct the collected datasets using different propagation
speed values and calculate a focal quality metric that is used
to determine a suitable estimate [9–11]. Wave modeling,
also called tomographic, techniques perform a minimization
process by solving iteratively Maxwell’s equations for a set
of possible scan scenarios until the difference between the
measured data and the analytical solution satisfies a stop
criterion [12–15]. Techniques in both categories have been
validated on experimental data, y ielding accurate results in
far-field SR imaging settings.
In the last decade, SR has been used for a series of
novel near-field imaging scenarios, such as Breast Microwave
Radar (BMR) and Microwave Wood Inspection (MWI).
The targets in these applications have sizes in the order of
millimetres making necessary the use of large bandwidth
waveforms (>5 GHz) to achieve spatial resolution values
within this order of magnitude. To the best of the authors’
knowledge, only a few propagation speed estimation tech-
niques for this SR imaging setting have been proposed
[16–18]. Nevertheless, these methods have some limitations
that can potentially limit their use in realistic scenarios.
The parametric search proposed in [16]requiresalarge
number of datasets from the scan region to generate accurate
estimates. The wave modeling approaches presented in
[17, 18] rely on computationally intensive procedures that
result in processing times that can range from s everal
minutes to a couple of days [17, 18], resulting in low data
throughput rates. Additionally, the method proposed in [17]
has limited use when the radiated waveform has a bandwidth
over 3 GHz, which is quite common in BMR and MWI
scenarios.
This paper proposes a novel technique to accurately
determine the propagation speed in near-field SR scenarios.
This technique reconstructs a given dataset using differ-
ent propagation speed values and calculates the Shannon
entropy to measure their focal quality. The value used to
form the minimum entropy image is then processed to
estimate the propagation speed in the scan region. Entropy
metrics have been used for airborne radar to estimate the
motion parameters of a given target and in SR to eliminate
artifacts in reconstructed images arising from a random
air-soil interface [19, 20]. The entropy of a radar image is
an indicator of its focal quality. As the image is blurred,
the uncertainty in the location and dimensions of a target
increases. On the o ther hand, a s the fo cal quality increases,
the uncertainty in the position and size of each inclusion
decreases. Therefore, the best focal quality is achieved when
the entropy of the reconstructed SR image is minimized
[21]. The proposed technique exhibits a number of improve-
ments over standard propagation speed estimation methods
for near-field imaging, including lower execution time
and the ability to generate accurate results using a single
data set. This paper is organized as follows. The signal
model is described in Section 2.InSection 3 the proposed
approach is explained. In Section 4,theperformanceof
the proposed technique is assessed using experimental
data sets. Finally, concluding remarks can be found in
Section 5.
x axis (m)
y axis (m)
0 0.2 0.4 0.6 0.8 1
0
0.05
0.1
0.15
0.2
0.25
0.3
0.35
0.1
0.2
0.3
0.4
0.5
0.6
0.7
0.8
0.9
1
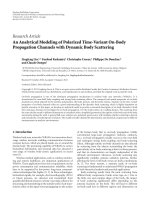
Figure 1: Simulated data set.
2. SR Imaging in Homogeneous Media
2.1. Signal Model. Consider a linear scan geometr y formed
by M scan locations in the (x, y) plane. The problem domain
contains T targets over the intervals [0, x
max
]onthex axis
and [0, y
max
]onthey axis and is assumed to have a constant
propagation speed v. The distance between the scan location
and the pth target is given by D
p
(x) =
(x
p
− x)
2
+(y
p
)
2
,
where (x,0) and (x
p
, y
p
) are the antenna and the pth target
coordinates, respectively. In this scan geometry, the antenna
element(s) face downwards.
At (x,0),awaveform f (t) is radiated, and the reflections
from the targets inside the scan region are recorded at the
same scan location. The remaining scan locations are inactive
during this process. This process is repeated for each scan
location. The responses recorded at this scan location can be
expressed by
s
(
t, x
)
=
T
p=1
ρ
p
(
x
)
f
⎛
⎜
⎜
⎝
t −
2
x
p
− x
2
+
y
p
2
v
⎞
⎟
⎟
⎠
,(1)
where ρ
p
(x) is the reflectivity of the pth target. Now consider
the responses from the pth target s
p
(t, x). The Fourier
transform of s
p
(t, x) along the t direction is given by
S
p
(
ω, x
)
= ρ
p
(
x
)
F
(
ω
)
exp
−
j
2k
x
p
−x
2
+ y
2
p
,
(2)
where k
= ω/v, and it is known as the wave number.
Equation (2) is known as the spherical phase function of the
scan geometry.
Since the targets are located at near-field distances, the
differences between travel times at adjacent scan locations
are not negligible. These differences lead to the formation
of hyperbolic signatures, which make it difficult to properly
assess the dimension and location of the targets inside the
scan region [1]. To properly visualize the dimensions and
locations of these inclusions, the collected data must be
EURASIP Journal on Advances in Sig nal Processing 3
x axis (m)
y axis (m)
0 0.2 0.4 0.6 0.8 1
0.1
0.2
0.3
0.4
0.5
0.6
0.7
0.8
0.1
0
0.2
0.3
0.4
0.5
(a)
0.2 0.3 0.4 0.5 0.6 0.7 0.8 0.9
1
0
0.5
1
1.5
2
2.5
3
Energy (microwatts)
Pixel count
(b)
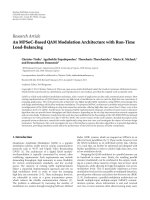
Figure 2: (a) Reconstructed data set using v = 1.5 v
sim
. (b) Image histogram.
x axis (m)
y axis (m)
0
0.2 0.4 0.6 0.8 1
0
0.05
0.1
0.15
0.2
0.25
0.3
0.35
0.4
0.45
0.5
1
1.5
2
(a)
0.8
1 1.2 1.4 1.6 1.8 2 2.2 2.4 2.6
0
0.2
0.4
0.6
0.8
1
1.2
1.4
1.6
1.8
2
Energy (microwatts)
Pixel count
(b)
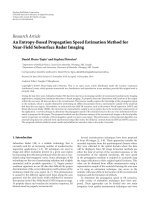
Figure 3: (a) Reconstructed data set using v = 1.2 v
sim
. (b) Image histogram.
reconstructed. One of the most effective image formation
algorithms for near-field SR imaging is the frequency-
wavenumber migration algorithm [6, 8]. This technique
has been used in seismic applications for more than three
decades, and it is extensively used in subsurface radar
imaging. This method can be summarized as follows. First
the Fourier transform of S
p
(ω, x)iscalculatedinthex
direction yielding
S
p
(
ω, k
x
)
= ρ
p
(
k
x
)
F
(
ω, k
x
)
·exp
−
j
4k
2
− k
2
x
y
p
−
jk
x
x
p
.
(3)
In order to transfer the data contained in S
p
(ω, k
x
)tothe
rectangular frequency space (k
x
, k
y
), a mapping
4k
2
− k
2
x
=
k
y
is performed. The resulting spectrum is given by
I
p
k
x
, k
y
=
ρ
p
(
k
x
)
F
k
x
, k
y
·
exp
−
j
k
x
x
p
+ k
y
y
p
.
(4)
Finally, the reconstructed image, i(x, y), is obtained by
calculating the inverse 2D fast Fourier transform of
I
p
(k
x
, k
y
).
2.2. Propagation Speed Uncertainty Effects. In the majority of
the SR scenarios, it is assumed that the medium propagation
speed is known a priori. This consideration can have several
negative effects on the reconstructed images if there is a
difference between the value used in the reconstruction
process and the propagation speed of the scan region. Let us
denote the propagation speed estimate v
e
and the scan region
propagation speed v
t
. Their corresponding wavenumbers are
k
e
= ω/v
e
and k
t
= ω/v
t
,andthewavenumberdifference is
given by γ
= k
t
− k
e
.Ifs(t, x) is reconstructed using v
e
,the
mapping function would have t he form
g
(
k
e
, k
x
)
=
4k
2
e
− k
2
x
=
4
k
t
− γ
2
− k
2
x
,(5)
4 EURASIP Journal on Advances in Signal Pr ocessing
where the value of γ will introduce a nonlinear error in the
frequency mapping process. Depending on the magnitude,
twocasescanoccur.Ifγ>0, then k
t
<k
e
and
g
(
k
e
, k
x
)
>g
(
k
t
, k
x
)
∀
k
y
, k
x
. (6)
The resulting spectrum has a frequency shift on the k
y
axis that decreases as the k
x
value increases. Since g(k
e
, k
x
)
determines the k
y
spatial frequency of the reconstructed data,
the mapping error will produce a nonlinear displacement
on the y axis. Given that the error varies along the k
x
axis,
the targets in the reconstructed images will have concave
signatures. Alternatively, if γ<0, then k
t
>k
e
and
g
(
k
e
, k
x
)
<g
(
k
t
, k
x
)
∀
k
y
, k
x
,(7)
then the error introduced by the mapping process would
produce convex signatures in the spatial domain. Although
the length of these target signatures will not be as large as
they would have been had s
(t, x) been left unprocessed (due
to the subtraction of the k
x
term in the mapping process), the
target signatures still present augmented sizes and nonlinear
behaviour.
In both cases, the defocusing caused by propagation
speed error can be quantified by using the histogram of the
reconstructed image magnitude values. Let us consider the
case where γ
= 0. In this case, the histogram would contain
a series of components corresponding to the different ρ
p
values. As the wavenumber error increases, the length of the
nonlinear signatures grows as well. The defocusing caused
the target responses to spread among a larger number
of magnitude levels in the image. This will result in an
increased number of modes in the histogram compared
to the image reconstructed using v
t
. Therefore, the image
sharpness decreases as the magnitude of γ increases.
To illustrate this effect, a simulated data set, s
sim
(t, x), was
generated using an SR simulator developed by the authors
[22]. This data set contained three point scatters located at
(0.1, 0.15)m, (0.35, 0.24)m, and (0.8, 0.22)m. The irradiated
signal was a Stepped Frequency Continuous Wave (SFCW)
with a bandwidth of 11 GHz and a center frequency of
6.5 GHz. The propagation speed in the scan region was v
t
=
1 × 10
8
m/s. The unprocessed data set is shown in Figure 1.
The image obtained by reconstructing s
sim
(t, x)usingv
t
and
its corresponding histogram is shown in Figures 2(a) and
2(b), respectively. To evaluate the effects in the image when
γ>0, s
sim
(t, x) was also reconstructed using propagation
speed values of 1.5v
t
and 1.2v
t
. The resulting images are
shown in Figures 3(a) and 4(a), respectively. The histograms
of the reconstructed images are given in Figures 3(b) and
4(b). Notice how the target signatures exhibit a concave
shape that becomes more elongated as the wavenumber error
increases. The number of modes in the histogram grows
as the magnitude of γ increases as well. It can also be
appreciated how the location of the targets is shifted upwards
as a result of the wavenumber error.
The effects on the reconstruction process when γ<0
were analyzed by processing s
sim
(t, x) using propagation
speed values of 0.5v
t
and 0.8v
t
.Theresultingimages
are shown in Figures 5(a) and 6(a), respectively. Their
corresponding histograms are given in Figures 5(b) and 6(b).
Although the signature size in these images is smaller than
in the unprocessed data set, they still have a convex shape.
Similarly to when s
sim
(t, x) was reconstructed using propa-
gation speed values g reater than v
t
, the spread in the target
signatures causes an increase in the image energy levels. This
is reflected in the additional modes in Figures 4(b) and 5(b),
compared to Figure 2(a).
2.3. Entropy As a Focal Quality Metric. The focal quality of
the image i(x, y) depends on the value of v
e
used during
the reconstruction process. Therefore, in order to determine
the fitness of v
e
as an accurate propagation speed estimate,
the focal quality of the reconstructed data can be used as
ametric.Anefficient way of determining the focal quality
of a radar image is by calculating its entropy. This metric
measures the level of uncertainty in a random variable. Let
R be a discrete random variable with a probability density
function p(r). According to Shannon’s definition [23], the
entropy of R is given by
H
=−
R
p
(
r
)
log
p
(
r
)
. (8)
Pun [24] defined the entropy of a digital image with W
intensity levels as
H
=−
W
ψ
w
Ψ
log
ψ
w
Ψ
,(9)
where ψ
w
are the pixels corresponding to the wth intensity
level on the image and Ψ is the total number of pixels in the
image. It can be seen in (9) that the entropy value of an image
depends on the pixel intensity distribution. To illustrate the
performance of entropy as a focal quality metric, s
sim
(t, x)
was reconstructed using a set of one hundred different v
values in the interval [0.3v
sim
,2v
sim
]; see Figure 7. The plot
of the different entropy values is shown in Figure 8.Notethat
the minimum entropy value is located at v
sim
.
3. Methodology
3.1. Radar Imaging in a Two-Layer Scenario. Most near-field
SR scenarios have a layer formed by air or a homogeneous
matching material between the scan geometry and the
scan region [20, 25, 26]. This can be modeled as an
observation domain O composed of two regions, denoted
a O
1
and O
2
,withdifferent propagation speeds, denoted
a v
1
and v
2
, respectively. Since the dielectric properties of
O
1
are usually known a priori or can be calculated offline,
determining v
1
is a trivial process. On the other hand, v
2
∈
[v
min
, v
max
], v
2
∈ [v
min
, v
max
], where v
min
and v
max
are the
minimum and maximum propagation speed values that are
physically feasible for this scan region. Using the signal model
illustrated in ( 1), the recor ded signal from a single target in
this scenario would have the form
s
O
(
t, x
)
= ρ
p
f
t − t
p
, (10)
EURASIP Journal on Advances in Sig nal Processing 5
x axis (m)
y axis (m)
0
0.2
0.4
0.6 0.8 1
0
0.05
0.1
0.15
0.2
0.25
0.3
0.5
1
1.5
2
2.5
3
(a)
0.5 1 1.5 2 2.5 3 3.5
0
0.5
1
1.5
2
2.5
3
Energy (microwatts)
Pixel count
(b)
Figure 4: (a) Reconstructed data set using v = 0.8 v
sim
. (b) Image histogram.
x axis (m)
y axis (m)
0
0.2
0.4 0.6
0.8
1
0
0.02
0.04
0.06
0.08
0.1
0.12
0.14
0.16
0.18
0.2
0.4
0.6
0.8
1
1.2
(a)
0.2 0.4 0.6 0.8 1 1.2 1.4 1.6
0
0.2
0.4
0.6
0.8
1
1.2
1.4
1.6
1.8
2
Energy (microwatts)
Pixel count
(b)
Figure 5: (a) Reconstructed data set using v = 0.5 v
sim
. (b) Image histogram.
x axis (m)
y axis (m)
0 0.2 0.4 0.6 0.8 1
0
0.05
0.1
0.15
0.2
0.25
0.3
0.35
1
2
3
4
5
6
7
(a)
12345678
0
0.2
0.4
0.6
0.8
1
1.2
1.4
1.6
1.8
2
Energy (microwatts)
Pixel count
(b)
Figure 6: (a) Reconstructed data set using v = v
sim
. (b) Image histogram.
6 EURASIP Journal on Advances in Signal Pr ocessing
0.2
0.4
0.6 0.8 1 1.2
1.4
1.6
1.8 2
×10
8
3
3.5
4
4.5
5
5.5
6
6.5
Propagation speed (m/s)
Entropy value (bits)
Figure 7: Entropy values w ithin the interval [0.3 v
sim
,2v
sim
].
Scan area
Scan trajectory
y
Scan location x
x
O
1
d
1,p
(x)
D
p
(x)
d
2,p
(x)
(x
1
, y
1
)
(x
1
, y
1
)
(x
p
, y
p
)
(x
T
, y
T
)
O
2
Figure 8: Dual layer scan scenario sample geometry.
where t
p
=
2
q
=1
(d
q,p
(x)/v
q
)andd
q,p
(x)andv
q
are the
signal travel distance and propagation speed corresponding
to the qth region, respectively. A diagram for this generic scan
geometry can be seen in Figure 8.
By dividing the total travel distance by the signal travel
time, the average propagation speed is given by
v
p
(
x
)
=
D
p
2
q
=1
d
q,p
(
x
)
/v
q
, (11)
or alternatively
1
v
p
(
x
)
=
2
q=1
d
q,p
(
x
)
v
q
D
p
. (12)
To reconstruct the recorded data using a wavefront recon-
struction approach, the stationary point in the following
expression must be determined:
ω
x
p
− x
∗
v
p
(
x
∗
)
D
+
ω
∂
v
p
(
x
∗
)
/∂x
D
v
2
p
(
x
∗
)
= k
x
. (13)
Obtaining a closed form expression for x
∗
from (13)
can be difficult. A feasible approach is to perform the
reconstruction process using a constant propagation value
estimate, v
f
, for the whole scan area. In this case the best
focal quality will be achieved for the v
f
value that has the
smallest e rror for all the recorded reflections in the data set,
which can be expressed as
v
∗
f
= arg min
v
f
⎛
⎝
M
m=1
v
f
− v
p
(
x
m
)
2
⎞
⎠
. (14)
By taking the first derivative of the right hand of (14)and
equating it to zero, we obtain
M
m=1
2
v
f
−v
p
(
x
m
)
v
f
=v
∗
f
= 0. (15)
By algebraically manipulating (15), we obtain
M
m=1
v
∗
f
−
M
m=1
v
p
(
x
m
)
= 0,
M
· v
∗
f
−
M
m=1
v
p
(
x
m
)
= 0,
v
∗
f
=
1
M
M
m=1
v
p
(
x
m
)
,
(16)
which is equivalent to a veraging v
p
(x
m
) along the x direction.
This approach can also be used to determine the v
f
value in
a multitarget scenario as follows:
v
∗
f
= arg min
v
f
⎛
⎝
T
p=1
M
m=1
v
f
−v
p
(
x
m
)
2
⎞
⎠
,
T
p=1
M
m=1
2
v
f
−v
p
(
x
m
)
v
f
=v
∗
f
= 0.
(17)
By following a similar approach to the one used in the single-
target scenario, the result is
v
∗
f
=
1
MT
T
p=1
M
m=1
v
p
(
x
m
)
,
E
{v
(
x
)
}=v
∗
f
,
(18)
which can also be written as
E
{v
(
x
)
}=
E
D
p
(
x
)
E
2
q
=1
d
q,p
(
x
)
/v
q
, (19)
EURASIP Journal on Advances in Sig nal Processing 7
H(v
c
)
Static wavelet
transform
s(t, x
m
)
Surface
estimation
WMP
denoising and
surface removal
Wavefront
reconstruction
s
w
(t, x)
Probability
density function
calculation
Entropy
calculation
Minimum
search
p
v
c
(r)
i
w
v
c
(x, y)
O
2
propagation
speed estimation
v
∗
v
∗
s(t, x)
i
w
v
∗
(x, y)
segmentation
O
1
extension
calculation
s
z
(t, x
m
)
Z
W(t, x
m
)
˜
D
v
∗
2
For c = 1, 2, 3, , C and v
c
= [v
min
, v
max
]
For m
= 1, 2, 3, , M
Figure 9: Block diagram of the proposed method.
where
E
⎧
⎨
⎩
2
q=1
d
q,p
(
x
)
v
q
⎫
⎬
⎭
=
μ
z
v
1
+
E
D
p
(
x
)
−
μ
z
v
2
, (20)
where μ
z
is the average location of the reflections from the
scan region surface, s
z
(t, x). Note that this estimate takes into
account the effects of O
1
in the signal travel time.
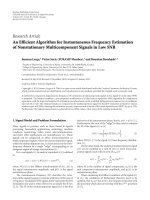
3.2. Propagation Speed Estimation Algorithm. Based on the
previous discussion, we can now formulate a propagation
speed estimation method. To detect the surface responses
and estimate the average location of the targets in the dataset,
the datasets were processed using the approach presented
by the authors in [27]. This method uses wavelet multiscale
products to eliminate the noise components in the dataset
and preserve the target responses. The surface responses
are characterized using the method proposed in [28]. The
denoised dataset will be reconstructed using a set of feasible
propagation speed values, defined as
Θ
v
c
∈
[
v
s
, v
e
]
| v
c
=
c
(
v
e
− v
s
)
C
+ v
s
, c = 1, 2, , C
.
(21)
The proposed estimation method can be described as
follows.
(1) Calculate the wavelet multiscale products of the range
profile s(t, x
m
), in the recorded data. The result of this
operation is denoted as w(t, x
m
).
(2) Determine the range bin z(m)
= max(w(t, x
m
))
which corresponds to the location the surface.
(3) Obtain the denoised range profile, s
w
(t, x
m
), using the
method proposed by the authors in [28].
(4) Repeat for m
= 1, 2, , M.
(5) Reconstruct s
w
(t, x
m
)usingthecth value in the set Θ,
yielding i
w
v
c
(x, y).
(6) Calculate the discrete probability density function of
the energy levels on the reconstructed image.
(7) Determine the entropy value of i
w
v
c
(x, y), H(c), using
(10).
(8) Repeat steps (6) through (8) for each element in Θ.
8 EURASIP Journal on Advances in Signal Pr ocessing
x axis (m)
y axis (m)
0
0.2 0.40.6 0.8 1
0
0.05
0.1
0.15
0.2
0.25
0.3
×10
−6
0.5
1
1.5
2
2.5
3
3.5
4
4.5
5
5.5
(a)
x axis (m)
y axis (m)
0 0.2 0.40.6 0.8 1
0
0.05
0.1
0.15
0.2
0.25
0.3
0
2
4
6
8
10
×10
−7
(b)
1 1.2 1.4 1.6 1.8 2 2.2 2.4 2.6 2.8 3
×10
8
5.7
5.75
5.8
5.85
5.9
5.95
6
6.05
Propagation speed (m/s)
Entropy value (bits)
(c)
x axis (m)
y axis (m)
0 0.2 0.4 0.6 0.8 1
0
0.05
0.1
0.15
0.2
0.25
0.3
2
4
6
8
10
12
14
16
×10
−7
(d)
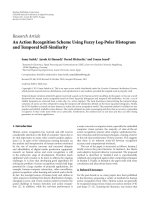
Figure 10: (a) First experimental data set. (b) Denoised data set. (c) Entropy values for the interval [1 ×10
8
m/s, 3 ×10
8
m/s]. (d) Dataset
reconstructed using v
∗
.
(9) Determine the value, v
∗
, in which the minimum
entropy value is achieved.
(10) Next, the image components in i
w
v
∗
(x, y)areseg-
mented and labelled. Then
D is estimated using the
following operation:
D =
B
β=1
D
β
B
, (22)
where D
β
is the range location of the βth target
centroid, and the B is the number of segmented
objects in i
w
v
∗
(x, y).
(11) The area of O
1
is calculated as follows:
Z
=
M
m=1
z
(
m
)
. (23)
(12) Finally, by algebraically manipulating (22), the value
of v
∗
2
can be determined using the following opera-
tion:
v
∗
2
=
Z −
D
D
Z/
v
1
·
D
−
(
1/v
∗
)
. (24)
By using the proportion of O
1
over the extension
of O, i t is possible to estimate the value of v
2
by
determining the propagation speed that yields the
reconstructed image with the best focal quality. A
block diagram of the proposed method is shown in
Figure 9.
3.3. Refraction Effects and Lossy Medium Considerations.
Compared to ray tracing approaches, wave front r econ-
struction methods only consider the phase behavior of the
recorded responses to focus the collected data. As shown
in [29], the refraction produced as the radiated wavefronts
penetrate into O
2
will affect the spectral support band, Ω,
EURASIP Journal on Advances in Sig nal Processing 9
of the target responses along the scan direction. The spectral
support band in a radar system is closely related to the size
of its point spread function [ 7]. In a single medium scenario,
the support band size is given by
Ω
=
[
2k sin
(
θ
(
L
))
,2k sin
(
θ
(
−L
))]
, (25)
where θ(L)
= tan
−1
(L/Y), 2L is the size of the antenna
radiation footprint, and Y is the range extension of the scan
region. The refraction caused by the interface between
the two mediums will change the em ergence angle of the
wavefr onts [29], affecting the beam width coverage in O
2
.By
using the approach proposed in [7] and the Hu ygens-Fr esnel
principle, the resulting spatial bandwidth is given by
Ω
O
=
2k
sin
(
θ
(
L
O
))
−sin
φ
,2k
sin
(
θ
(
−L
O
))
+sin
φ
,
(26)
where L
O
= (−D
max
· v
2
/v
1
) · sin(φ), Y = D
max
, φ is
the antenna divergence angle, and D
max
is the extension of
O
2
. To satisfy the Nyquist-Shannon criterion along the scan
trajectory, the separation between adjacent scan location
must satisfy the following rule:
Δx ≤
λ
max
(
D
max
· v
2
/v
1
)
·sin
φ
2
+
(
D
max
)
2
4
(
D
max
· v
2
/v
1
)
· sin
φ
+2sin
φ
(
D
max
· v
2
/v
1
)
· sin
φ
2
+
(
D
max
)
2
, (27)
where λ
max
is the wavelength corresponding to the maximum
frequency component in f (t).
The previous analysis can also be used to be extended to
deal with lossy media, by modeling the wavenumber as
k
(
ω
)
=
ω
√
ε
s
c
+ jτ
0
, (28)
where τ
0
accounts for the attenuation in the medium. By
performing the search process over a 2D search space where
ε
s
∈ [ε
r min
, ε
r max
]andτ
0
∈ [τ
min
, τ
max
] and evaluating
the focal quality o f the resulting images, an estimate of the
attenuation factor in O
2
can be obtained. A similar approach
was used in [20] to enhance near-field GPR images.
4. Results
In order to test the proposed method, a SFCW radar
system was used. The system consists of a 360B Wiltron
Network Analyzer and an AEL H Horn Antenna which has
a length of 19 cm. A bandwidth of 11 GHz (1–12GHz) was
used in all the experiments. The system was characterized
by recording the antenna responses inside an anechoic
chamber . This reference signal was subtracted from the
experiment data in order to eliminate distortions introduced
by the components of the system. The data acquisition
setup was surrounded by absorbing material in order to
reduce undesirable environment reflections. The data was
reconstructed using a 3 GHz PC with 1 GB RAM.
The proposed estimation algorithm was tested using
experimental data acquired from a 3
×1 ×13 m rectangular
deposit filled with dry sand. The walls of this deposit were
covered with electromagnetic wave absorbing material to
eliminate their responses. The targets were buried within a
region of 20 cms beneath the sand surface. Different distances
between the antenna and the sand surface were used in
each experiment to assess the effect of the air layer in the
estimation method. In the first three experiments the box
was filled with silica sand which has a propagation speed
of v
silica
= 1.745 × 10
8
m/s [30]. The dielectric contrast
between the scan region layers in this scenario is similar to
the one present in BMI and MWI [31, 32]scenarios.The
propagation speeds of the materials used in the experimental
setups are shown in Tab le 1.Thev values of materials
commonly found in BMI and MWI scan scenarios are
summarized in Tab l e 2. To demonstrate the robustness of
the proposed approach, the search process is performed over
the interval [1
×10
8
m/s, 3 ×10
8
m/s] which is significantly
larger than the range of values reported in the literature for
dry sand ([1.37
×10
8
m/s, 2.12 ×10
8
m/s]) [33]. A total of
200 equidistant values were defined in the search interval.
In the experimental setup, the antenna was mounted on a
horizontal rail that was 1.2 meters above the bottom of the
box. The antenna motion was controlled by a stepper motor
that was connected to a custom control interface controlled
by a 2 GHz PC with 1 GB RAM. In all the experiments, the
step size in the x direction was 1 cm. The limit of the near-
field region,
R, on this imaging system is given by
R =
2L
2
A
λ
max
=
2 ·
(
0.12 m
)
2
0.0145 m
= 1.98 m, (29)
where L
A
is the largest dimension of the antenna at its phase
center. Since the maximum distance between the antenna
and the sandbox bottom is 1.2 m, the targets in all the
experiments were at near-field distances.
The first experimental data set is shown in Figure 10(a).
In this experiment, two aluminum pipes with a diameter
of 3 cm and two steel pieces with a length of 2 cm and
a thickness of 5 mm were used. The average separation
between the antenna and the sand surface was 10 cms.
Figure 10(b) shows the energy of the denoised data. Note that
the target signatures are easier to visualize in this image. The
clutter in the image corresponds to stationary waves caused
by multiple reflections between the surface and the antenna.
Nevertheless, the magnitude of these responses is less than
half of the magnitude of the target signatures. Figure 10(c)
shows the resulting entropy values for the images formed
using the values in the search interval. For this experiment,
the minimum value is located at v
∗
= 2.03 × 10
8
m/s.
10 EURASIP Journal on Advances in Signal Processing
x axis (m)
y axis (m)
0 0.2 0.4 0.6 0.8 1
0
0.05
0.1
0.15
0.2
0.25
0.3
0.5
1
1.5
2
2.5
3
3.5
4
4.5
5
5.5
×10
−6
(a)
x axis (m)
y axis (m)
0
0
0.2 0.4 0.6 0.8 1
0
0.05
0.1
0.15
0.2
0.25
0.3
0.5
1
1.5
2
2.5
×10
−6
(b)
1 1.2 1.4 1.6 1.8 2 2.2 2.4 2.6 2.8 3
×10
8
Propagation speed (m/s)
4.2
4.4
4.6
4.8
5
5.2
5.4
5.6
5.8
6
Entropy value (bits)
(c)
x axis (m)
y axis (m)
0 0.2 0.4
0.6
0.8 1
0
0.05
0.1
0.15
0.2
0.25
0.3
0
1
2
3
4
5
×10
−6
(d)
Figure 11: (a) Second experimental data set. (b) Denoised data set. (c) Entropy values for the interval [1 ×10
8
m/s, 3 ×10
8
m/s]. (d) Dataset
reconstructed using v
∗
.
Table 1: Propagation speed values of the materials used in the
experimental setups.
Material Propagation speed
Air 3 × 10
8
m/s
Silica sand 1.745
× 10
8
m/s
Desert sand 1.89
× 10
8
m/s
The difference between this value and v
silica
is caused by
higher propagation speed of the air layer (3
×10
8
m/s). From
the mathematical model of v
f
described in (22), an increase
in the value of v
1
will result in an increased v
f
. Substituting
the values of M, v
1
,andv
∗
in (24) yields a value of v
2
=
1.5 × 10
8
m/s, which has a 12% error compared to v
silica
.The
reconstructed image using v
∗
is shown in Figure 10(d).
Figure 11(a) shows data collected from the second exper-
imental setup. In this case, the targets were two aluminum
pipes with a diameter of 1 cm and a steel plate with a length
of 7 cms and a thickness of 1 cm. The average separation
Table 2: Propagation speed values of materials found in BMI and
MWI scan scenarios.
Material Propagation speed
Canola oil 1.3416 × 10
8
m/s
Fatty breast tissue 7.071
× 10
7
−1.732 × 10
8
m/s
Wood (Dry) 1.895
× 10
8
m/s
Wood (10.8% moisture) 1.603
× 10
8
m/s
between the antenna and the sand surface was 7 cm. It can
be seen that the sand surface in this experiment is closer to
the antenna, which according to the modeling performed in
Section 3 will result in a lower composite propagation speed
estimate. Figure 11(b) shows the corresponding denoised
image. The entropy values for the search interval are shown
in Figure 11(c). The minimum entropy value was located
at 2.04
×10
8
m/s, and the corresponding propagation speed
estimate was 1.63
×10
8
m/s. Similarly to the last dataset, the
dataset was reconstructed using v
∗
. The resulting image is
shown in Figure 12(d). Notice increased focal qualit y of these
EURASIP Journal on Advances in Signal Processing 11
x axis (m)
y axis (m)
0 0.2 0.4 0.6 0.8 1
0
0.05
0.1
0.15
0.2
0.25
0.3
0.5
1
1.5
2
2.5
3
3.5
4
4.5
5
×10
−6
(a)
x axis (m)
y axis (m)
0
0.2 0.4 0.6 0.8 1
0
0.05
0.1
0.15
0.2
0.25
0.3
×10
−6
0
0.2
0.4
0.6
0.8
1
1.2
1.4
1.6
1.8
2
(b)
1 1.2 1.4 1.6 1.8 2 2.2 2.4 2.6 2.8 3
×10
8
Propagation speed (m/s)
Entropy value (bits)
4.2
4.3
4.4
4.5
4.6
4.7
4.8
4.9
5
5.1
5.2
(c)
x axis (m)
y axis (m)
0 0.2 0.4 0.6 0.8
1
0
0.05
0.1
0.15
0.2
0.25
0.3
0
1
2
3
4
5
×10
−6
6
(d)
Figure 12: (a) Third experimental data set. (b) Denoised data set. (c) Entropy values for the interval [1 ×10
8
m/s, 3 × 10
8
m/s]. (d) Dataset
reconstructed using v
∗
.
Table 3: Estimation errors and exe cution times of the proposed method and the HT-based estimation technique for each experimental data
set.
Experiment/metric Entropy error Entropy execution time HT error HT execution time
1 −2.45 × 10
7
m/s 13.1 sec 3.85 × 10
7
m/s 90.1 sec
2
−1.15 × 10
7
m/s 12.6 sec 3.06 × 10
7
m/s 89.45 sec
32
× 10
5
m/s 13.3 sec 3.55 × 10
7
m/s 91.6 sec
41
× 10
6
m/s 15.1 sec 41.1 × 10
7
m/s 90.78 sec
images compared to the previous dataset. These results are
consistent with the simulations presented in Section 3.As
the error between propagation speed the medium and the
estimate decreases, the focal quality of the image improves.
The recorded data from a third experimental setup is
shown in Figure 12(a). In this setup, the same targets than in
the p revious experiment were used. The steel plate target was
moved 7 cm deeper to observe the effect on the propagation
speed estimate. The average separation between the sand
surface and the antenna was 7 cm. The denoised data can
be seen in Figure 12(b). The entropy values for the search
interval are shown in Figure 12(c). The minimum entropy
value was located at 2.17
×10
8
m/s, and the co rr esponding
propagation speed estimate was 1.743
×10
8
m/s. The recon-
structed image using v
∗
is shown in Figure 12(d).
In order to test the proposed method in a d ifferent
propagation medium, four targets were buried in desert sand
(v
desert
= 1.89 × 10⁸ m/s) [34]. In this case, the targets
were aluminum pipes with a diameter of 1 cm. The average
distance between the antenna and the sand surface was 6 cm.
The recorded data set is shown in Figure 13(a).Theresultof
the d enoising process can be seen in Figure 13(b).Thesearch
was conducted also in the interval [1
×10
8
m/s, 3 ×10
8
m/s].
The calculated entropy values are displayed in Figure 13(c).
12 EURASIP Journal on Advances in Signal Processing
x axis (m)
y axis (m)
0 0.2 0.4 0.6 0.8 1
0
0.05
0.1
0.15
0.2
0.25
0.3
1
2
3
4
5
×10
−6
6
(a)
x axis (m)
y axis (m)
0 0.2 0.4 0.6 0.8 1
0
0.05
0.1
0.15
0.2
0.25
0.3
0
0.2
0.4
0.6
0.8
1
1.2
1.4
1.6
×10
−6
(b)
Entropy value (bits)
1 1.2 1.4 1.6 1.8 2 2.2 2.4 2.6 2.8 3
×10
8
Propagation speed (m/s)
5.95
6
6.05
6.1
6.15
6.2
6.25
6.3
6.35
6.4
6.45
(c)
x axis (m)
y axis (m)
0
0.2 0.4 0.6 0.8 1
0
0.05
0.1
0.15
0.2
0.25
0.3
0
0.5
1
1.5
2
2.5
3
3.5
4
4.5
5
×10
−6
(d)
Figure 13: (a) Fourth experimental data set. (b) Denoised data set. (c) Entropy values for the interval [1 ×10
8
m/s, 3 ×10
8
m/s]. (d) Dataset
reconstructed using v
∗
.
The location of the minimum value (2.3 × 10
8
m/s) was
shifted towards the right. This is consistent with the model
presented in Section 3, as the wave propagates faster in this
medium than in silica sand. The estimated value of for this
data set was 1.9
× 10
8
m/s. The reconstructed image using v
∗
is shown in Figure 13(d).
The performance of the proposed technique was com-
pared to the algorithm described in [16]whichisbased
on the use of the Hough Transform (HT). This technique
offers a good balance b etween execution time and estimation
accuracy. The r esults of this c omparison are shown in
Tab le 3. The HT technique has a higher error and a larger
execution time than the proposed approach.
5. Conclusions
A novel technique for propagation speed estimation in near-
field SR scenarios is presented in this paper. The proposed
algorithm focuses the data using initial estimates of the
propagation speed on the media followed by the calculation
of the focal quality of the reconstructed images using
Shannon’s entropy as a metric. A clutter removal process is
performed on the data in order to allow a more accurate
estimation. A search process is performed on the resulting
entropy measurements in order to find the propagation
speed value associated with the minimum entropy value.
The proposed method yielded accurate propagation speed
estimates (with an error less that 13%) and has an execution
time in the order of seconds. Finally, the proposed algorithm
exhibits both lower execution times and estimation errors
compared to current noninvasive estimation techniques
based on the use of the HT.
References
[1] D. Daniels, G round P enetrating Radar, IEE Press, London, UK,
2004.
[2] E. Pettinelli, A. Di Matteo, E. Mattei et al., “GPR response from
buried pipes: measurement on field site and tomographic
reconstructions,” IEEE Transactions on Geoscience and Remote
Sensing, vol. 47, no. 8, pp. 2639–2645, 2009.
[3]X.L.Travassos,D.A.G.Vieira,N.Ida,C.Vollaire,and
A. Nicolas, “Inverse algorithms for the GPR assessment of
EURASIP Journal on Advances in Signal Processing 13
concrete structures,” IEEE Transactions on Magnetics, vol. 44,
no. 6, pp. 994–997, 2008.
[4] H. Frigui and P. Gader, “Detection and discrimination of land
mines in ground-penetrating radar based on edge histogram
descriptors and a possibilistic K-nearest neighbor classifier,”
IEEE Transactions on Fuzzy Systems, vol. 17, no. 1, pp. 185–
199, 2009.
[5] E. C. Fear and M. A. Stuchly, “Microwave detection of
breast cancer,” IEEE Transactions on Microwave Theory and
Technique s, vol. 48, no. 1, pp. 1854–1863, 2000.
[6] A. S. Milman, “SAR imaging by ω-k migration,” International
Journal of Remote Sensing, vol. 14, no. 10, pp. 1965–1979, 1993.
[7] M. Soumekh, Synthetic Aperture Radar Signal Processing with
MATLAB Algorithms, Wiley-Interscience, New York, NY, USA,
1999.
[8] R.H.Stolt,“MigrationbyFouriertransform,”Geophysics,vol.
43, no. 1, pp. 23–48, 1978.
[9]F.Ahmad,M.G.Amin,andG.Mandapati,“Autofocusing
of through-the-wall radar imagery under unknown wall
characteristics,” IEEE Transactions on Image Processing,vol.16,
no. 7, pp. 1785–1795, 2007.
[10] L. Li, W. Zhang, and F. Li, “A novel autofocusing approach
for real-time through-wall imaging under unknown wall
characteristics,” IEEE Transactions on Geoscie nce and Remote
Sensing, vol. 48, no. 1, pp. 423–431, 2010.
[11] L.Capineri,D.J.Daniels,P.Falorni,O.L.Lopera,andC.G.
Windsor, “Estimation of relative permittivity of shallow soils
by using the ground penetrating r adar response from different
buried targets,” Progress in Electromagnetic s Research Letters,
vol. 2, pp. 63–71, 2008.
[12] S. Lambot, E. C. Slob, I. van den Bosch, B. Stockbroeckx,
B. Scheers, and M. Vanclooster, “Estimating soil electric
properties from monostatic ground-penetrating radar signal
inversion in the frequency domain,” Water Resources Research,
vol. 40, no. 4, pp. W042051–W0420512, 2004.
[13] S. Lambot, E. C. Slob, I. van den Bosch, B. Stockbroeckx,
B. Scheers, and M. Vanclooster, “GPR design and modeling
for identifying the shallow subsurface dielectric properties,”
in Proceedings of the 2nd International Workshop Advanced
Ground Penetrating Radar, vol. 1, pp. 130–135, Delft, The
Netherlands, 2003.
[14] F. Soldovieri, G. Prisco, and R. Persico, “A strategy for the
determination of the dielectric permittivity of a lossy soil
exploiting GPR surface measurements and a cooperative
target,” Journal of Applied Geophysics, vol. 67, no. 4, pp. 288–
295, 2009.
[15] S. Lambot, E. C. Slob, I. van den Bosch, B. Stockbroeckx,
and M. Vanclooster, “Modeling of ground-penetrating r adar
for accurate characterization of subsurface electric properties,”
IEEE Transactions on Geoscience and Remote Sensing, vol. 42,
no. 11, pp. 2555–2568, 2004.
[16] N. Milisavljevic and A. G. Yarovoy, “An effective algorithm for
subsurface SAR imaging,” in Proceedings of the IEEE Antennas
and Propagation Society International Symposium,vol.4,pp.
314–317, San Antonio, Tex, USA, June 2002.
[17] G. G. Gentili and U. Spagnolini, “Electromagnetic inversion in
monostatic ground penetrating radar: TEM horn calibration
and application,” IEEE Transactions on Geoscience and Remote
Sensing, vol. 38, no. 4, pp. 1936–1946, 2000.
[18]D.W.Winters,E.J.Bond,B.D.VanVeen,andS.C.
Hagness, “Estimation of the frequency-dependent average
dielectric properties of breast tissue using a time-domain
inverse scattering technique,” IEEE Transactions on Antennas
and Propagation, vol. 54, no. 11, pp. 3517–3528, 2006.
[19] B. C. Flores, A. Martinez, and J. Hammer, “Optimization of
high-resolution-radar motion compensation via entropy-like
functions,” in Proceedings of the IEEE International Symposium
Digest of Antennas and Propagation, vol. 3, pp. 1906–1909, Ann
Arbor, Mich, USA, July 1993.
[20] X.Xu,E.L.Miller,andC.M.Rappaport,“Minimumentropy
regularization in frequency-wavenumber migration to localize
subsurface objects,” IEEE Transactions on Geoscience and
Remote Sensing
, vol. 41, no. 8, pp. 1804–1812, 2003.
[21] J. Sok-Son, G. Thomas, and B. C. Flores, Range-Doppler Radar
Imaging and Motion Compensation, Artech House, Norwood,
Mass, USA, 2001.
[22] D. Flores-Tapia, G. Thomas, A. Sabouni, S. Noghanian,
andS.Pistorius,“Breasttumormicrowavesimulatorbased
on a radar signal model,” in Proceedings of the 6th IEEE
International Symposium on Signal Processing and Information
Technology (ISSPIT ’07), pp. 17–22, Vancouver, Canada, 2007.
[23] T. M. Cover and J. A. Thomas, Elements of Information Theory,
John Wiley & Sons, New York, NY, USA, 1991.
[24] T. Pun, “A new method for g rey-level picture thresholding
using the entropy of the histogram,” Signal Processing,vol.2,
no. 3, pp. 223–237, 1980.
[25] C. J. Leuschen and R. G. Plumb, “A matched-filter-based
reverse-time migration algorithm for ground-penetrating
radar data,” IEEE Transactions on Geoscience and Remote
Sensing, vol. 39, no. 5, pp. 929–936, 2001.
[26] O. Lopera, E. C. Slob, N. Milisavljevi
´
c, and S. Lambot,
“Filtering soil surface and antenna effects from GPR data to
enhance landmine detection,” IEEE Transactions on Geoscience
and Remote Sensing, vol. 45, no. 3, pp. 707–717, 2007.
[27] D. Flores-Tapia, G. Thomas, and M. C. Phelan, “Clutter
reduction of GPR images using multiscale products,” in
Proceedings of IASTED International Conference on Antennas,
Radar and Wave Propagation (ARP ’04),vol.1,Banff, Canada,
2004.
[28] D. Flores-Tapia, G. Thomas, and S. Pistorius, “Skin surface
removal on breast microwave imagery using wavelet multi-
scale products,” in Medical Imaging: Physiology, Function, and
Structure from M edical Images, vol. 6143 of Proceedings of SPIE,
February 2006.
[29] G. F. Margrave, “Seismic acquisition parameter considerations
for a linear velocity medium,” in Proceedings of the 67th Annual
International Meetings of the Society of Exporation Geophycists,
vol. 1, Dallas, Tex, USA, 1997, paper ACQ2.6.
[30] E. Fratticcioli, M. Dionigi, and R. Sorrentino, “A new per-
mittivity model for the microwave moisture measurement
of wet sand,” in Proceedings of the 33rd European Mic rowave
Conference, pp. 539–542, 2003.
[31] J. M. Sill and E. C. Fear, “Tissue sensing adaptive radar for
breast cancer detection-experimental investigation of s imple
tumor models,” IEEE Transactions on Microwave Theory and
Technique s, vol. 53, no. 11, pp. 3312–3319, 2005.
[32] G. Daian, A. Taube, A. Birnboim, M. Daian, and Y. Shramkov,
“Modeling the dielectric properties of wood,” Wood Science
and Technology, vol. 40, no. 3, pp. 237–246, 2006.
[33] J. L. Davis and A. P. Annan, “Ground-penetrating radar
for high-resolution mapping of soil and rock stratigraphy,”
Geophysical Prospecting, vol. 37, no. 5, pp. 531–551, 1989.
[34] C. M
¨
atzler, “ microwave permittivity of dry sand,” IEEE
Transactions on Geosc ience and Remote Sensing, vol. 36, no. 1,
pp. 317–319, 1998.