Báo cáo hóa học: " Research Article Formant Frequencies under Cognitive Load: Effects and Classification" doc
Bạn đang xem bản rút gọn của tài liệu. Xem và tải ngay bản đầy đủ của tài liệu tại đây (715.79 KB, 11 trang )
Hindawi Publishing Corporation
EURASIP Journal on Advances in Signal Processing
Volume 2011, Article ID 219253, 11 pages
doi:10.1155/2011/219253
Research Article
Form ant Frequencies under Cog nitive Load:
Effects and Classification
Tet Fei Yap,
1, 2
Julien Epps,
1, 2
Eliathamby Ambikairajah,
1, 2
andEricH.C.Choi(EURASIPMember)
2
1
School of Electrical Engineering and Telecommunications, The University of New South Wales,
Sydney NSW 2052, Australia
2
ATP Research Laboratory, National ICT Australia (NICTA), Eveleigh NSW 2015, Australia
Correspondence should be addressed to Tet Fei Yap,
Received 1 August 2010; Accepted 20 December 2010
Academic Editor: Shrikanth Narayanan
Copyright © 2011 Tet Fei Yap et al. This is an open access article distributed under the Creative Commons Attribution License,
which permits unrestricted use, distribution, and reproduction in any medium, provided the original work is properly cited.
Cognitive load measurement systems measure the mental demand experienced by human while performing a cognitive task,
which is useful in monitoring and enhancing task performance. Various speech-based systems have been proposed for cognitive
load classification, but the effect of cognitive load on the speech production system is still not well understood. In this work, we
study formant frequencies under different load conditions and utilize formant frequency-based features for automatic cognitive
load classification. We find that the slope, dispersion, and duration of vowel formant trajectories exhibit changes under different
load conditions; slope and duration are found to be useful features in vowel-based classification. Additionally, 2-class and 3-class
utterance-based classification results, evaluated on two different databases, show that the performance of frame-based formant
features was comparable, if not better than, baseline MFCC features.
1. Introduction
Cognitive load refers to the load imposed by a certain task on
the cognitive system of a person [1]. Cognitive load theory,
first developed in the field of educational psychology, was
originally focused on improving the process of acquiring and
applying new knowledge [2]. Central to cognitive load theory
is the notion that working memory is required while per-
forming a cognitive task, but this working memory is limited.
As a cognitive task becomes more challenging, the amount of
working memory required to complete the task will typically
increase. When the working memory requirement exceeds
the available capacity, task performance will deteriorate.
In recent years, there has been a growing interest in mon-
itoring and measuring cognitive load as a means to monitor
or even enhance human task performance. Applications
expected to benefit from such cognitive load monitoring
systems include air traffic control systems [3], in-car user
interfaces [4] and military human-machine systems [5].
There are many different methods available for cogni-
tive load measurement, such as pupil dilation and heart
rate variability [1]. Nevertheless, speech-based methods are
attractive because they are nonintrusive and widely available
and can potentially be real-time. Various speech parameters
have been correlated with cognitive load during early investi-
gations of the problem [6]. Sentence fragments, articulation
rate [7], and filled pauses [8] have also been proposed as
features for cognitive load measurement. However, most
of these proposed features are high level features and the
cognitive load classification methods proposed were not fully
automatic. In 2008, Yin et al. proposed the use of a Gaussian
mixture model- (GMM-) based classifier to automatically
classify different cognitive load levels [9]. In this system, the
front-end features used were frame-based acoustic features:
mel-frequency cepstral coefficients (MFCCs), pitch, and
intensity. MFCCs are a set of features commonly used in
various speech processing applications, and they capture
information in the magnitude part of the speech spectrum.
Pitch and intensity, on the other hand, are features that
capture information relating to the prosody of speech.
In recent years, various frame-based features have been
proposed to improve on the previously proposed baseline
2 EURASIP Journal on Advances in Signal Processing
system [10, 11], and MFCCs seem to have emerged as an
effective set of baseline features for cognitive load classifica-
tion. However, MFCCs do not provide us with any insight
into how cognitive load affects the speech spectrum or the
underlying speech production system. Moreover, MFCCs
may have higher dimensionality than what is strictly required
for the problem.
Previously, glottal features were investigated in an
attempt to link cognitive load to the speech production
system [11, 12]. A natural extension to these pieces of
work would be to study the effectofcognitiveloadon
the vocal tract. In this respect, an investigation of formant
frequencies for cognitive load classification is interesting
and complementary. This is because formant frequencies
(the frequencies at which broad spectral peaks occur in the
magnitude spectrum of speech) are closely related to the
underlying configuration of the vocal tract.
Lively et al. have previously found no significant dif-
ferences in the first three formant frequencies (F1, F2,
F3) under different workload conditions. However, more
recent investigations have shown that formant frequencies
do carry information useful for cognitive load classification
[13, 14]. Moreover, formants have also been investigated in
two other fields, which we believe are related to cognitive
load classification: stress classification [15] and emotion
recognition [16, 17].
In the field of emotion recognition, statistics calculated
from the formant frequencies have been used successfully as
part of a larger feature set for emotion recognition [18]. It
was argued that using the statistics of low-level descriptors
of speech is beneficial, because the reduction in information
helps avoid phonetic overmodeling [18].
In this work, we analyze statistical parameters of different
vowel formant frequencies, such as standard deviation,
minima, and skewness, in order to better understand the
effect of cognitive load on the formant trajectory. This is
an extension of our previous work, which focused only on
the analysis of the vowel formant means [14]. Besides that,
we also analyze the formant trajectories in greater detail: in
terms of the trajectory in the F1-F2 plane, and also in terms
of the time-normalized trajectory for a particular speaker.
Although the performance of frame-based formant fea-
tures for cognitive load classification has been reported in
our previous work [13, 14], classification was performed on
a per-utterance basis on a single database. In this work, the
performance of frame-based formant features is verified on a
second database, and a system employing statistical formant
features extracted on a per-vowel basis is proposed.
2. Cognit ive Load Databases
2.1. Stroop Test Database. The Stroop test database, reported
previously [9], consists of 16 randomly selected native
English speakers (7 males and 9 females) performing three
tasks of varying cognitive load levels. In the low-load task, the
speakers were required to read aloud words corresponding to
different color names. In the medium-load task, there was
a mismatch between the color names and the font colors,
and the speakers were asked to name the font colors instead.
The high-load task was similar to the medium-load task
except that time constraints were introduced to the task.
Each task produced an utterance with average duration of
16 seconds (duration of effective speech is 7 seconds). In each
utterance, 20 color names were spoken: 10 different colors
randomly repeated twice. The color names that were used
are “black”, “blue”, “brown”, “gray”, “green”, “orange”, “pink”,
“purple”, “red”, and “yellow”.
Database recording was conducted in two separate
sessions. Each speaker was required to record 2 utterances
per load level in each session. However, a small number
of speakers were unable to attend both recording sessions.
Hence, for each speaker, a maximum of 4 utterances were
recorded per load.
In total, 161 utterances were recorded, and approximately
54 utterances were obtained per load level.
2.2. Reading-Comprehension Database. This database con-
sists of 15 randomly selected native English speakers (7 males
and 8 females) reading aloud 3 text passages of varying
difficulty levels, and answering open-ended questions related
to the passages that they have read [19]. The difficulty level
of the text was measured using the Lexile Framework for
Reading [20], which measures the semantic difficulty and
syntactic complexity of a particular text. It ranges from
200 L (Lexiles) for beginner readers to above 1700L for
advanced text. Lexile ratings of the text selected for the low,
medium, and high-load cases were 925 L, 1200 L, and 1350 L,
respectively.
After the text passage reading, participants were asked to
answer three open-ended questions.
(i) Give a short summary of the story in at least five
whole sentences.
(ii) What was the most interesting point in this story?
(iii) Describe at least two other points highlighted in this
story.
For the high-load task, participants were asked to perform
an additional dual task. Throughout the task, random 2 digit
numbers were played softly in the background (via a headset)
at random intervals. The participants were asked to count
how many numbers were heard throughout the reading and
comprehension task.
In this work, only the utterances from the comprehension
tasks were used. A total of 135 utterances were recorded,
that what is, 45 utterances per load level. Each utterance
corresponded to the answer to one of the three open-ended
questions in the comprehension task. The average duration
of each utterance is approximately 32 s (duration of effective
speechis12s).
2.3. Story Reading Database. Speakers who participated in
the Stroop test database collection also recorded a separate
story reading task. The average duration of the recordings
from each speaker is approximately 90 s (duration of effective
speechis38s).Speechfromthisdatabaseishereinusedfor
background model training purposes.
EURASIP Journal on Advances in Signal Processing 3
3. Effect of Cognitive Load on Vowel Formants
3.1. Experimental Setup. The experiments detailed in this
section are aimed at investigating the changes in the formant
trajectories under different cognitive load conditions. The
experiments were performed on a subset of the Stroop test
database, and a total of 5 vowel sounds were considered: /eh/,
/iy/, /ae/, /uw/, and /ao/ extracted from the color words “red”,
“green”, “black”, “blue”, and “orange”, respectively.
Only vowels spoken under the low and medium cognitive
load conditions were considered here. This is because the
high-load task design induces an increase in rate of speech.
This change in speech rate confounds our analysis, given that
speech rate has been shown to affect formant frequencies [21,
22]. For example, we observed a smaller vowel plane area for
high cognitive load conditions, compared with medium-load
conditions. This reduction in vowel plane area is expected
when speech rate is increased [21]; thus, it is not sure if
cognitive load is also accountable for this effect. Hence, we
focused our analyses in this section on low and medium
cognitive load tasks, wherein changes in speech rate were not
explicitly induced.
To obtain the vowel formants, the color words were first
manually segmented from the full utterances in the Stroop
test database. The vowel boundaries were then determined
by performing forced phone alignment on the color words,
using the HVite program in the Hidden Markov Model
Toolkit (HTK). The phone models were trained, using
MFCC features, on the training partition of the TIMIT cor-
pus [23]. When tested on the test partition of the TIMIT cor-
pus, the phone alignment system achieved an accuracy rate of
87.2% with a temporal tolerance of within 20 milliseconds.
The first three formant frequencies were then extracted
from each vowel sound using the Wavesurfer/Snack toolkit
[24]. A 49 milliseconds Hamming window was applied with
a frame increment of 10 ms. Otherwise, all other parameters
remained at the default settings: the number of formants
tracked (four), preemphasis factor (0.7), LPC order (12),
nominal value of first formant frequency (500 Hz), and
sampling frequency (10 kHz). Erroneous formant values
were manually corrected using a spectrogram.
3.2. Vowel Formant Statistical Parameters
3.2.1. Method. Formant parameters that were used in this
study include the following.
(1) First is the statistical parameters such as mean
(Mean), standard deviation (StdDev), maximum
(Max), minimum (Min), range (Range), skewness
(Skewness), and kurtosis (Kurtosis) of the vowel
trajectory.
(2) Second is the formant values and slopes at dif-
ferent equidistant temporal positions. Formant20,
Formant50, and Formant80 represent the formant
values at the 20%, 50%, and 80% points on the vowel
trajectory, whereas Slope20 and Slope80 represent the
local slope at the 20% and 80% points on the vowel
trajectory.
(3) Third is the DCT coefficients that model the entire
vowel formant trajectories. For the vowel formant
trajectory x(n)withN total number of frames, these
were calculated as follows:
DCT
k
= w
(
k
)
N
n=1
x
(
n
)
cos
π
(
2n − 1
)(
k − 1
)
2N
,(1)
where k
= 1, 2, , N and
w
(
k
)
=
⎧
⎪
⎪
⎪
⎪
⎨
⎪
⎪
⎪
⎪
⎩
1
√
N
, k
= 1,
2
N
,2
≤ k ≤ N.
(2)
(4) Fourth is the regression coefficients for linear and
quadratic curves. LinRegSlope and LinRegIntercept
represent the slope and intercept of the linear
regression line that best fits the vowel formant tra-
jectory, whereas QuadRegOrd0, QuadRegOrd1, and
QuadRegOrd2 represent the first 3 coefficients of the
quadratic regression curve that best fits the trajectory.
(5) Fifth is the total number of frames for the for-
mant trajectory (Duration). The trends of Duration,
observed for F1, F2, and F3, should all be identical
since the three formants should have the same
duration for the same vowel sound.
The above parameters were calculated separately for each for-
mant frequency, vowel sound, and load level. The parameters
were then averaged for each speaker and each session. T-tests
were then performed (for each color and each formant) on
the differences of the means of the parameters between low
and medium-load. Approximately 27 test samples were used
for each test.
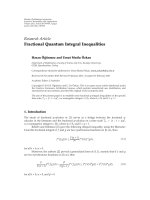
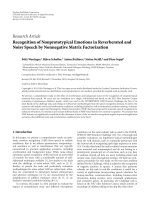
3.2.2. Results and Discussion. Figure 1 shows the mean F1
and F2 values, averaged across all speakers and sessions, for
different vowels and different cognitive load conditions. The
figure suggests that the mean formant values do shift for
different load conditions, and this shift is vowel-dependent.
However, we did not observe any shrinking of the vowel
plane that might have suggested vowel reduction; this agrees
with the observations reported by Lively et al. [6].
Ta bl e 1 summarizes the significant trends (P<.1, P<
.05, P<.01) for various formant parameters as cognitive
load level changes. The direction of the arrows indicates
the trends as cognitive load increases from low to medium.
Due to the small sample size, only strong trends showed
significance. The following is a discussion of the observed
trends.
Mean Value and DC Offset. Ta bl e 1 shows that only the mean
F2 values in /ao/ exhibit a significant decreasing trend. This
can be compared with the results of Lively et al. [6], which
found no statistical differences in formant frequencies under
different cognitive workload conditions. However, in another
work, Hansen and Patil [15] reported that the first 3 formant
frequencies increase when speech is spoken under stress.
4 EURASIP Journal on Advances in Signal Processing
Table 1: Trends of different formant parameters as cognitive load increases from low to medium. Parameters are calculated from the
individual formant trajectory of particular vowel sounds. One, two, and three arrows indicate that the trend is significant for P<.1, P<.05,
and P<.01, respectively.
Feature F1 F2 F3
/eh/ /iy/ /ae/ /uw/ /ao/ /eh/ /iy/ /ae/ /uw/ /ao/ /eh/ /iy/ /ae/ /uw/ /ao/
Mean ↓
LinRegIntercept ↓↓↓↓
QuadRegOrd0 ↓↓ ↓↓ ↓↓
DCT
1
↑↑↑ ↑↑ ↑↑↑ ↑↑↑ ↑↑↑ ↑↑ ↑↑ ↑↑↑ ↑↑↑ ↑↑ ↑↑ ↑↑↑ ↑
Duration ↑↑↑ ↑↑ ↑↑ ↑↑↑ ↑↑ ↑↑↑ ↑↑ ↑↑ ↑↑↑ ↑↑ ↑↑↑ ↑↑ ↑↑ ↑↑↑ ↑↑
StdDev ↑↑↑ ↑ ↑ ↑↑↑
Min ↓↓ ↓↓ ↓↓
Max ↑↑ ↑
Range ↑↑↑ ↑↑ ↑↑↑
Formant20 ↓↓↓
Formant80 ↓
Formant50
Slope20
↓↓
Slope80
LinRegSlope ↑↑ ↓↓ ↑ ↓
DCT
2
↑↑ ↓↓ ↓ ↑↑↑
DCT
3
↓↑
Skewness ↑↑↓↓
Kurtosis ↑↓↓
QuadRegOrd1 ↓
QuadRegOrd2 ↑↑↑
1000
1500
2000
2500
F2 (Hz)
300 400 500 600 700 800 900
F1 (Hz)
Low
Medium
/ao/
/iy/
/uw/
/eh/
/ae/
Figure 1: Mean F1 and F2 for different vowel sounds, spoken under
low- and medium-load conditions, averaged across all speakers and
sessions (after [14]).
Apart from the database size, we believe that the lack
of significance in the mean vowel formants may be due
to errors in calculating the vowel boundary. As the vowels
were extracted from color words, the vowel boundaries
were less clearly defined as compared to, say, an hVd word.
Errors in determining the vowel boundaries, hence, caused
neighboring phonemes to affect the mean values of the vowel
formants.
The linear and quadratic regression intercepts (LinRegIn-
tercept and QuadRegOrd0) are related to the DC offset of
the trajectories, and they are less affected by the previously
mentioned problem. Here, the results show that the two
parameters exhibit decreasing trends, in F1 for /ao/ and F2
for /ae/ and /ao/, as cognitive load increases.
First DCT Coefficient and Duration. The highly significant
increasing trends observed for the first DCT coefficient
(DCT
1
), at first glance, seem to contradict the results for
the mean vowel formants; the difference lies in the scaling
factor 1/
√
N present in the DCT calculation ((1)and(2)).
Compared with the equation for mean calculation over
the same interval, DCT
1
is actually the mean weighted by
√
N. Hence, the strong significant differences in the DCT
1
values across differentloadlevelsshouldbeconsideredtobe
dominated by duration effects.
When a t-test was performed on Duration for low and
medium-loads, a consistent increase was observed for all
vowel sounds. Hence, vowel duration increases as cognitive
load increases; that is, subjects tend to speak more slowly for
medium cognitive load, compared with low load.
EURASIP Journal on Advances in Signal Processing 5
Within-Trajectory Dispersion. The standard deviation of the
formant trajectories (StdDev) shows an increasing trend, as
cognitive load increases, in F1 for /uw/, F2 for /iy/ and
/ae/, and F3 for /ao/. This is consistent with the increasing
trend observed for the trajectory range (Range). As expected
from the increasing StdDev, the trajectory minimum (Min)
exhibits a decreasing trend (in F2 for /ae/ and /ao/), whereas
the trajectory maximum (Max) exhibits an increasing trend
(in F1 for /uw/ and F2 for /iy/).
Time-Normalized Formant Parameters. The formant fre-
quencies at the 20%, 50%, and 80% points in the time-
normalized trajectory (Formant20, Formant50, Formant80)
do not show much significant differences between cognitive
load levels. This might, again, be due to errors in vowel
boundary calculations causing formant frequencies to be
calculated at the wrong temporal points. Similarly, few
significant differences can be observed for the formant
trajectory slope at the 20% and 80% points in the time-
normalized trajectory (Slope20, Slope80).
Slope-Based Formant Parameters. In contrast to Slope20 and
Slope80, the linear regression slope of the formant trajectory
(LinRegSlope) shows an increasing trend, in F1 for /uw/ and
F2 for /ao/, and a decreasing trend, in F2 for /uw/ and F3
for /eh/. The second DCT coefficient (DCT
2
) also displays
significant trends, in F1 for /uw/, in F2 for /ae/ and /ao/, and
in F3 for /ao/. These results indicate that cognitive load does
affect the direction of the formant trajectory.
In general, the results suggest that the DC offset,
dispersion, and the slope of the formant trajectory carry
cognitive load-related information, at least for certain vowel
sounds. Furthermore, vowel duration seems to be strongly
affected by cognitive load.
3.3. Vowel Formant Trajectories in the F1-F2 Plane. Analysis
in the previous section focused on individual formant
frequencies of different vowel sounds. However, it is common
to analyze the vowel formant frequency trajectories from the
perspective of the F1-F2 plane.
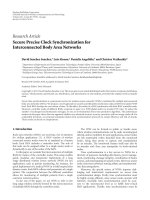
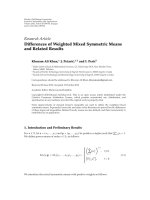
Figure 2 shows the average time-normalized formant
trajectories for different vowel sounds and different load
levels, averaged across all speakers and sessions. The arrows
indicate the directions in which the trajectories are moving
with time. The time-normalized formant trajectory was
obtained by using linear interpolation to calculate the
formant values at 11 equidistant temporal locations.
To quantify the changes in the formant trajectory, we cal-
culated the formant trajectory length TL. This parameter is
basically a piecewise approximation of the formant trajectory
length in the F1-F2 plane. It provides a simple measure to
determine the magnitude of the formant trajectory change
occurring in the F1-F2 plane. The calculation of TL is based
on the equation given by Fox and Jacewicz [25]:
TL
=
K
k=1
(
F1
k
− F1
k+1
)
2
+
(
F2
k
− F2
k+1
)
2
,(3)
1000
1200
1400
1600
1800
2000
2200
2400
2600
F2 (Hz)
200 300 400 500 600 700 800 900
F1 (Hz)
Low
Medium
/ao/
/iy/
/eh/
/uw/
/ae/
Figure 2: Time-normalized formant trajectories for different vowel
sounds, spoken under low, and medium-load, averaged across all
speakers and sessions (after [14]).
Table 2: Trajectory length TL of time-normalized formant trajec-
tory, averaged across all speakers and sessions, for different vowel
sounds and load conditions.
Vowel sound
Low-load Medium-load
(Hz) (Hz)
/eh/ 249 249
/iy/ 606 603
/ae/ 188 211
/uw/ 159 179
/ao/ 95 117
where F1
k
and F2
k
are the F1 and F2 values at the kth
equidistant location of the vowel formant trajectory. K +1
is the total number of equidistant points to consider. K
= 10
was chosen for this experiment.
Ta bl e 2 summarizes the value of TL for different vowel
sounds spoken under different load conditions. TL for the
vowel sounds /eh/ and /iy/ remains roughly unchanged as
cognitive load increases. Looking at the formant trajectory
in Figure 2, we can see that the trajectory shapes for the two
vowel sounds remain roughly the same. This implies that
any changes, due to cognitive load, for the two vowel sounds
are reflected as shifts in the mean values of the formant
trajectory.
On the other hand, TL for the vowel sounds /ae/, /uw/,
and /ao/ seems to be higher for medium-load conditions.
This suggests that there are more changes in the shape of
the trajectory for those vowel sounds; the differences in the
trajectory shape can be observed in Figure 2. This finding
is consistent with the results reported in Table 1 ,wherein
significant differences are mostly observed in the /ae/, /uw/
and /ao/ sounds. This raises the prospect that certain vowel
6 EURASIP Journal on Advances in Signal Processing
F1 (Hz)
400
600
800
1000
00.51
Low load
Normalized time
(a)
F1 (Hz)
400
600
800
1000
00.51
Medium load
Normalized time
(b)
F2 (Hz)
1000
1200
1400
00.51
Normalized time
(c)
F2 (Hz)
1000
1200
1400
00.51
Normalized time
(d)
F3 (Hz)
1500
2000
2500
3000
00.51
Normalized time
(e)
F3 (Hz)
1500
2000
2500
3000
00.51
Normalized time
(f)
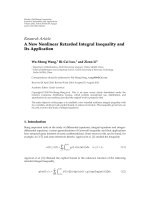
Figure 3: Time-normalized F1, F2, and F3 trajectory for the vowel /ao/, spoken by a particular speaker at a particular session, under low-
and medium-load conditions.
sounds might contain more useful information for cognitive
load discrimination.
3.4. Vowel Formant Trajectories of an Individual Speaker and
Session. The analyses performed in the previous sections
have focused on the mean values of different formant param-
eters averaged across all speakers and sessions. However, it
is also useful to look at the vowel formant trajectory of
a particular speaker at a particular session, in addition to
aggregate data.
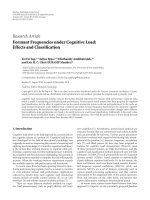
Figure 3 shows the time-normalized first 3 formant
trajectories of the vowel /ao/, under low- and medium-load
conditions, uttered by a particular speaker at a particular
session. This speaker/session was selected to represent typical
trajectories found in the database. From this figure, it seems
that the variance of formant trajectories between different
vowel instances tends to decrease when cognitive load
changes from low to medium. This effect can be observed
for all three formant trajectories.
Other observations with respect to Figure 3 can be related
to Ta b le 1 , and they seem to agree with each other. For
example, the figure indicates a decreasing mean F1 and
F2 trajectory, as cognitive load increases; the decrease in
F2 agrees with the decreasing trend of the mean formants
reported in Tab le 1 . Additionally, the figure also shows that
formant value shifts, due to cognitive load changes, seem
to be more prominent at the vowel onset region, especially
for the case of F2. This observation, again, agrees with the
significant decreasing trend of Formant20 in F2 for /ao/;
Formant20 represents the formant values at the 20% point
(vowel onset region).
In summary, although not all findings in this section
may generalize to other speakers in the database, the
EURASIP Journal on Advances in Signal Processing 7
results provide tangible examples of the findings reported in
Section 3.2, within a single speaker and session.
4. Cognitive Load Classification Using
Formant Features
4.1. Vowel-Based Classification Using Statistical Formant
Features. In this section, we seek to determine if the formant
parameters that we studied in Section 3.2 can be used as
features for vowel-based cognitive load classification. This
experiment was conducted on the Stroop test database.
4.1.1. Experimental Setup. The method used to extract the
vowel formants was similar to the method described in
Section 3.1.Theonlydifferences here are that the formant
frequencies were not manually corrected, and all vowel
sounds from the database were used. These included /ae/
from the word “black”, /uw/ from “blue”, /aw/ from “brown”,
/ey/ from “gray”, /iy/ from “green”, /ao/, /ah/, and /ih/ from
“orange”, /ih/ from “pink”, /er/, /el/, and /ah/ from “purple”,
/eh/ from “red”, and /eh/ and /ow/ from “yellow”.
Speaker-specific feature warping [13, 26] was applied to
the formant frequencies to remove interspeaker variability
of the formant frequencies; one source of variability is
the differences in the vocal tract lengths among speakers.
Speaker-specific feature warping seeks to map the probability
distribution of the pooled formant frequencies of each
speaker to the standard normal distribution. It is applied to
each feature dimension separately. For a given formant value
p for speaker S, the warped feature value q is given by the
equation q
= H
−1
((N +(1/2) −R)/N), where H
−1
() denotes
the normal inverse cumulative distribution function, N is
the total number of formant values for speaker S,andR is
the ranking of p after sorting the formant values for speaker
S in descending order. A detailed explanation can be found
in [26].
For each normalized formant trajectory of a particular
vowel sound, different statistical parameters were extracted:
Mean, LinRegIntercept, QuadRegOrd0, DCT
1
, Duration, Std-
Dev, Min, Range, LinRegSlope, DCT
2
, and Skewness. These
formant parameters are a subset of the parameters analyzed
in Section 3.2.ApartfromMean, these parameters were cho-
sen because they exhibited statistically significant differences
between low and medium cognitive load for at least 3 cases
(across different formant frequencies and vowel sounds).
A GMM classifier with universal background model
(UBM) training was then used to classify the vowel sounds
in a leave-one-speaker-out cross-validation evaluation. The
number of frames available for training was limited, since
multiple frames of a vowel trajectory produced only one
feature value per feature dimension. Hence, a UBM with a
low number of Gaussian mixtures (8 Gaussians) was trained,
using the vowel sounds from the entire database. The means
of the UBM were then adapted with maximum a posteriori
(MAP) adaptation, using vowel sounds that corresponded to
a particular load level.
During classification, the likelihood scores for all vowels
belonging to the same utterance were averaged, and the
class decisions were made for each utterance instead of each
Table 3: 2-class and 3-class accuracy results of vowel-based
classification using different statistical formant features.
Features Dimension 2-class accuracy 3-class accuracy
(%) (%)
Mean 3 45.4 37.3
LinRegIntercept 3 51.9 41.0
QuadRegOrd0 3 52.8 40.4
DCT
1
3 67.6 49.0
Duration 1 71.3 45.8
StdDev 3 55.6 37.2
Min 3 63.9 50.9
Range 3 63.0 46.6
LinRegSlope 3 69.4 44.6
DCT
2
3 63.9 39.7
Skewness 3 47.2 33.5
vowel. This setup reflects a real-life system better, whereby a
decision is made not based on a single vowel sound, but on a
longer speech utterance.
Unlike Section 3 where the high-load task was not
considered in the analysis, the classification experiments here
were performed both with and w ithout the high-load task.
This is because the high-load task (with the explicit change
in speech rate) represents, to some extent, data in real-world
situations. Hence, including the high-load task allowed us to
evaluate the effectiveness of the classification system in real-
world situations.
4.1.2. Results and Discussion. Tab l e 3 shows the 2-class (low
and medium-load) and 3-class (low, medium, and high-
load) classification performance of a vowel-based cognitive
load classification system, using different statistical formant
features. The features have 3 dimensions, each dimen-
sion corresponding to a formant; Duration has only one
dimension since the durations for the first three formant
frequencies are the same.
The 2-class and 3-class results reported in Ta ble 3 seem to
agree with the statistical analysis found in Ta b le 1 : statistical
parameters that show more significant differences in Tab le 1
produce better classification accuracies when applied as
features in the vowel-based cognitive load classification.
Results show that reasonably good performance was
observed for parameters related to the formant trajectory
slope (LinRegSlope and DCT
2
), trajectory range (Min and
Range), and vowel length (Duration, DCT
1
). 2-class results
show that the best performing features are Duration and
LinRegSlope, whereas the 3-class results show that the best
performing feature is Min followed by DCT
1
.
Mean, on the other hand, performed only slightly above
chance level. This is unsurprising, since Ta bl e 1 shows that
there is only one instance where the mean vowel formant
exhibited significant differences across load levels.
The trajectory offset parameters (LinRegIntercept, Quad-
RegOrd0) produced chance level classification performance
in the 2-class results but seem to provide reasonably good
performance in the 3-class results. This might be because
8 EURASIP Journal on Advances in Signal Processing
Formant
extraction
Vo ic ed re g i o n
selection
Speaker
normalization
GMM
classifier
Estimated
cognitive
load
Pitch-based
VA D
Speech
Figure 4: Block diagram of cognitive load classification system utilizing frame-based formant frequencies as front-end features.
the mean values of the formant frequencies are moving in
different directions, for different load levels, as suggested by
Figure 1. These vowel-specific shifts might not be accurately
modeled, due to the limited amount of training data
available, and the low number of Gaussian mixtures used. On
the other hand, performance of the features was better in the
3-class results, possibly because the features were affected by
the artificially induced change in speech rate in the high-load
task.
What is perhaps more surprising is the poor classification
performance of StdDev, which do not agree with the
statistical analysis of Tab le 1 . One possible reason for this
inconsistency could be because the speaker normalization
method used (speaker-specific feature warping) only pre-
serves the rank order among feature frames but not their
standard deviation. A similar reasoning can be used to
explain the poor performance of Skewness as well.
In summary, the slope, minimum, range, and duration of
the vowel formant trajectories seem to contain information
useful for vowel-based cognitive load classification.
4.2. Utterance-Based Classification Using Frame-Based For-
mant Features. In this section, the performance of a cog-
nitive load classification system using frame-based formant
features is evaluated. The evaluation was performed on 2
separate databases: the Stroop test database and the reading-
comprehension database.
4.2.1. Experimental Setup. Figure 4 shows the block diagram
of the cognitive load classification system that was used
in this section. Formant frequencies were automatically
extracted from full utterances of both databases using the
Wavesurfer/Snack toolkit, as described in Section 3.1.For-
mant frequencies for the reading-comprehension database
were extracted using a slightly different configuration from
the previous default configuration: the number of formants
tracked was three instead of four and the sampling frequency
used was 8 kHz instead of 10 kHz. This was necessary because
the default configuration resulted in significant proportion
of erroneous formant tracks.
The formant frequencies were then normalized using
speaker-specific feature warping, as explained in Section 4.1.
The Praat software [27] was used as a pitch-based voice
activity detector (VAD) to select voiced regions from the
speech, and formant frequencies extracted from those voiced
regions were used as features. Dynamic information was
also considered through the use of regression-based delta
coefficients. A regression window size of 9 frames was found
to provide good classification performance.
Table 4: Comparison of 2-class and 3-class classification results
for different frame-based formant frequencies and MFCC features,
evaluated on the Stroop test database.
Features 2-class accuracy (%) 3-class accuracy (%) [14]
Without delta With delta Without delta With delta
MFCC 70.4 80.6 53.3 65.2
{F
1
, F
2
, F
3
} 72.2 84.3 55.2 67.7
{F
1
, F
2
} 71.3 75.0 55.8 65.2
{F
1
, F
3
} 58.3 80.6 51.0 64.5
{F
2
, F
3
} 63.9 69.4 44.7 60.3
F
1
63.9 75.0 55.4 60.9
F
2
69.4 77.8 53.4 58.9
F
3
55.6 59.3 44.8 44.1
The normalized formant frequencies of the voiced
regions were then used as features to classify the cognitive
load level of each utterance in the databases. A leave-
one-speaker-out cross-validation evaluation was performed
using a GMM/UBM classifier. A UBM with 32 Gaussian
mixtures was trained using features extracted from a third
database: the story reading database. MAP adaptation was
then performed to adapt the means of the UBM using data
from either the Stroop test or the reading-comprehension
database.
4.2.2. Classification Results on the Stroop Test Database.
Ta bl e 4 shows the 2-class (low and medium-load) and 3-class
(low, medium, and high-load) classification results on the
Stroop test database, with formant frequencies as features.
The classification results are compared with MFCC features
(7 MFCC, not including the zeroth coefficient), which are
commonly used as a baseline in previous cognitive load
classification systems [9, 13, 28].
The first thing to notice is that the first three formant
frequencies
{F
1
, F
2
, F
3
} outperformed MFCC in both the
2-class and 3-class classification results. This is remarkable
given that the formant features have lower dimensionality
compared with MFCC (3 and 7, resp.), and the fact that
the formant frequencies were not manually corrected in
this experiment. Similar results can be observed when
delta coefficients are considered. These results suggest that
cognitive load information can be captured using lower
dimensionality formant features. In general, incorporating
delta coefficients into the feature sets resulted in an increase
in classification performance. This agrees with the findings
EURASIP Journal on Advances in Signal Processing 9
Table 5: Comparison of 2-class and 3-class classification results
for different frame-based formant frequencies and MFCC features,
evaluated on the reading-comprehension database.
Features 2-class accuracy (%) 3-class accuracy (%)
Without delta With Delta Without delta With delta
MFCC 63.3 71.1 48.9 52.6
{F
1
, F
2
, F
3
} 72.2 77.8 48.9 51.9
{F
1
, F
2
} 56.7 61.1 32.6 39.3
{F
1
, F
3
} 70.0 75.6 43.0 48.1
{F
2
, F
3
} 65.6 71.1 39.3 45.9
F
1
60.0 53.3 28.9 31.1
F
2
52.2 64.4 36.3 45.9
F
3
67.8 66.7 48.1 50.4
of previous work [9, 19] that suggested that dynamic speech
information is important for cognitive load classification.
In terms of the contribution of individual formants,
results suggest that the first two formant frequencies provide
majority of the cognitive load information. In the 2-
class classification results, performance of F
1
(63.9%) or
F
2
(69.4%) was significantly better than the performance
of F
3
(55.6%). In fact, the performance of F
2
alone was
comparable with the performance of
{F
1
, F
2
, F
3
} (72.2%).
A similar trend can be observed when delta coefficients are
considered.
The trend is slightly different in the case of the 3-class
classification results. Here, F
1
performs slightly better than
F
2
, whereas the opposite trend was observed in the 2-class
classification results. This slight discrepancy might be due
to the explicit change in speech rate that was induced in the
high-load task. Nevertheless, the 3-class classification results
do support the claim that F
1
and F
2
provide the greatest
contribution in terms of cognitive load classification.
When score-level fusion, similar to [14], was applied
to combine the
{F
1
, F
2
, F
3
}-based classification system with
each of the statistical formant features system found in
Section 4.1, no significant improvement in performance was
attained. This suggests that most of the cognitive load
information present in the statistical formant features is
already captured by the frame-based formant features.
4.2.3. Classification Results on the Reading-Comprehension
Database. To verify some of the claims made in the previous
sections, we applied the same cognitive load classification
system to a separate database.
Ta bl e 5 summarizes the classification results for different
formant frequency-based features, evaluated on the reading-
comprehension database. Once again, the classification per-
formance of MFCC-based features was used as a baseline for
comparison. Similarly to the Stroop test database, the 2-class
classification results show
{F
1
, F
2
, F
3
} outperforming MFCC
in both static and dynamic cases (where delta coefficients
were considered). In the case of the 3-class classification
results,
{F
1
, F
2
, F
3
} did not outperform MFCC,butits
performance was still comparable: both
{F
1
, F
2
, F
3
} and
MFCC achieved the same classification accuracy of 48.9%
in the static case, whereas in the dynamic case, the absolute
difference between the classification accuracy of
{F
1
, F
2
, F
3
}
and MFCC was only 0.7%. These results, once again, suggest
that cognitive load information can be effectively captured
using lower-dimensionality formant features.
Although the importance of dynamic features for cogni-
tive load classification has been mentioned in [9, 19], the
results have, until now, only been reported for the Stroop
test database. The results here show that incorporating delta
coefficients into the feature sets does improve cognitive load
classification in general: performance improvements were
observed for almost all feature sets in this database, except
in the 2-class classification results of F
1
and F
3
.
There are, however, some results here which do not agree
with the results from the Stroop test database evaluation.
In this evaluation, F
3
was found to perform better than F
1
or F
2
. In fact, the 3-class classification results show that
the performance of F
1
was below chance level, whereas the
performance of F
2
was only slightly above chance level.
We believe that the differences in the results might be
attributable to the different types of speech represented in
the databases. As mentioned in Section 2, the Stroop test
database consists of utterances which are made up of spoken
color names. Speech corresponding to these color names is
reasonably separated from one another temporally. Hence,
the Stroop test database is almost like an isolated word
database.
In contrast, the reading-comprehension database con-
sists of continuous speech. This difference might affect the
accuracy of the formant extraction algorithm. By visual
inspection, we found the formant tracks of files in the
Stroop test database to be smoother, and hence more
reliable, than the formant tracks extracted from the reading-
comprehension database. This also provides an explanation
for the overall lower classification accuracy of features
extracted from the reading-comprehension database when
compared with the Stroop test database.
5. Conclusion
This work has shown that vowel formant frequencies can be
correlated with cognitive load and can, hence, be used as
effective features for cognitive load classification. In general,
changes were observed, under different load conditions, for
parameters related to the DC offset, the dispersion, and the
slope of the formant trajectory. Analyses of formant parame-
ters and formant trajectories have shown that changes in the
formant trajectories seem to be stronger for certain vowel
sounds. When the statistical formant parameters were used
for vowel-based cognitive load classification, results show
that cognitive load information is captured in the slope,
range, and duration of the formant trajectory.
On the other hand, results from the utterance-based
classification showed that the performance of frame-based
formant features is comparable with, if not better than,
frame-based MFCCs; this is despite formant features having
a dimensionality of 3 compared with MFCCs with a
dimensionality of 7. This finding was consistent across two
different databases, hence suggesting that cognitive load
10 EURASIP Journal on Advances in Signal Processing
information can be captured using features with lower
dimensionality.
Apart from that, results from the frame-based classifi-
cation and the earlier formant parameter analysis suggested
that important cognitive load information is captured in the
dynamic information of the formant frequencies. This was
reflected by the improvement in the utterance-based classi-
fication performance when delta coefficients were included
in the feature sets. Additionally, parameters that capture the
temporal information of the formant trajectory (LinRegSlope
and DCT
2
) seem to exhibit significant differences, across
different loads, for more vowels and formants; they also
performed well in the vowel-based classification evaluation.
The strong trends exhibited by Duration in the statistical
analysis and vowel-based classification motivate us to further
investigate the effect of cognitive load on vowel and word
duration. Future work includes investigating the duration
of voiced regions as a potential feature for cognitive load
classification.
References
[1] F.Paas,J.E.Tuovinen,H.Tabbers,andP.W.M.VanGerven,
“Cognitive load measurement as a means to advance cognitive
load theory,” Educational Psychologist, vol. 38, no. 1, pp. 63–71,
2003.
[2]F.G.W.C.PaasandJ.J.G.VanMerri
¨
enboer, “Instructional
control of cognitive load in the training of complex cognitive
tasks,” Educational Psychology Review, vol. 6, no. 4, pp. 351–
371, 1994.
[3] G. Camp, F. Paas, R. Rikers, and J. Van Merrienboer, “Dynamic
problem selection in air traffic control training: a comparison
between performance, mental effort and mental efficiency,”
Computers in Human Behavior, vol. 17, no. 5-6, pp. 575–595,
2001.
[4] M. Hoedemaeker and M. Neerincx, “Attuning in-car user
interfaces to the momentary cognitive load,” in Proceedings of
the 3rd International Conference on Foundations of Augmented
Cognition (FAC ’07), vol. 4565 of Lecture Notes in Computer
Science, pp. 286–293, 2007.
[5] M. St. John, D. A. Kobus, J. G. Morrison, and D. Schmorrow,
“Overview of the DARPA augmented cognition technical
integration experiment,” International Journal of Human-
Computer Interaction, vol. 17, no. 2, pp. 131–149, 2004.
[6] S. E. Lively, D. B. Pisoni, W. Van Summers, and R. H. Bernacki,
“Effects of cognitive workload on speech production: acoustic
analyses and perceptual consequences,” Journal of the Acousti-
cal Society of America, vol. 93, no. 5, pp. 2962–2973, 1993.
[7] A. Berthold and A. Jameson, “Interpreting symptoms of cog-
nitive load in speech input,” in Proceedings of the International
Conference on User Modeling, pp. 235–244, 1999.
[8] C. Muller, B. Grossmann-Hutter, A. Jameson, R. Rummer, and
F. Wittig, “Recognizing time pressure and cognitive load on
the basis of speech: an experimental study,” in Proceedings
of the User Modeling, vol. 2109 of Lecture Notes in Computer
Science, pp. 24–33, 2001.
[9] B. Yin, F. Chen, N. Ruiz, and E. Ambikairajah, “Speech-
based cognitive load monitoring system,” in Proceedings of the
IEEE International Conference on Acoustics, Speech and Signal
Processing (ICASSP ’08), pp. 2041–2044, 2008.
[10] P. N. Le, E. Ambikairajah, E. H. C. Choi, and J. Epps, “A non-
uniform subband approach to speech-based cognitive load
classification,” in Proceedings of the 7th International Confer-
ence on Information, Communications and Signal Processing
(ICICS ’09), pp. 1–5, 2009.
[11] T. F. Yap, J. Epps, E. H. C. Choi, and E. Ambikairajah, “Glottal
features for speech-based cognitive load classification,” in
Proceedings of the IEEE International Conference on Acoustics,
Speech and Signal Processing (ICASSP ’10), pp. 5234–5237,
2010.
[12] P. Le, J. Epps, E. Choi, and E. Ambikairajah, “A study of voice
source and vocal tract filter based features in cognitive load
classification,” in Proceedings of International Conference on
Pattern Recognition, pp. 4516–4519, 2010.
[13] T. F. Yap, E. Ambikairajah, J. Epps, and E. H. C. Choi,
“Cognitive load classification using formant features,” in
Proceedings of the 10th Internat ional Conference on Informat ion
Sciences, Signal Processing and Their Applications (ISSPA ’10),
pp. 221–224, 2010.
[14] T. F. Yap, J. Epps, E. Ambikairajah, and E. H. C. Choi,
“An investigation of formant frequencies for cognitive load
classification,” in Proceedings of the 11th Annual Conference of
the International Speech Communication Association (INTER-
SPEECH ’10), pp. 2022–2025, 2010.
[15] J. H. L. Hansen and S. Patil, “Speech under stress: analysis,
modeling and recognition,” in Proceedings of the Speaker
Classification I, vol. 4343 of Lecture Notes in Computer Science
,
pp. 108–137, 2007.
[16] M. Goudbeek, J. P. Goldman, and K. R. Scherer, “Emotion
dimensions and formant position,” in Proceedings of the 10th
Annual Conference of the International Speech Communication
Association (INTERSPEECH ’09), pp. 1575–1578, September
2009.
[17] C. Lee, S. Yildirim, M. Bulut et al., “Emotion recognition
based on phoneme classes,” in Proceedings of International
Conference on Spoken Language Processing, pp. 889–892, 2004.
[18] B. Vlasenko, B. Schuller, A. Wendemuth, and G. Rigoll, “Frame
vs. turn-level: emotion recognition from speech considering
static and dynamic processing,” in Proceedings of the 2nd
International Conference on Affective Computing and Intelligent
Interaction (ACII ’07), vol. 4738 of Lecture Notes in Computer
Science, pp. 139–147, 2007.
[19] B. Yin, N. Ruiz, F. Chen, and M. A. Khawaja, “Automatic
cognitive load detection from speech features,” in Proceedings
of the Australasian Computer-Human Interaction Conference
(OZCHI ’07), pp. 249–255, 2007.
[20] MetaMetrics Inc., “The Lexile Framework for Reading,”
2010, />[21] B. Lindblom, “Spectrographic study of vowel reduction,”
Journal of the Acoustical Society of America, vol. 35, no. 11, pp.
1773–1781, 1963.
[22] M. Pitermann, “Effect of speaking rate and contrastive stress
on formant dynamics and vowel perception,” Journal of the
Acoustical Society of America, vol. 107, no. 6, pp. 3425–3437,
2000.
[23] J. S. Garofolo, L. F. Lamel, W. M. Fisher, J. G. Fiscus, D.
S. Pallett, and N. L. Dahlgren, “DARPA TIMIT acoustic-
phonetic continuous speech corpus CD-ROM,” NTIS order
number PB91-100354, 1993.
[24] K. Sj
¨
olander and J. Beskow, “Wavesurfer—an open source
speech tool,” in Proceedings of International Conference on
Spoken Language Processing, vol. 4, pp. 464–467, 2000.
[25] R. A. Fox and E. Jacewicz, “Cross-dialectal variation in
formant dynamics of American English vowels,” Journal of the
Acoustical Society of America, vol. 126, no. 5, pp. 2603–2618,
2009.
EURASIP Journal on Advances in Signal Processing 11
[26] V. Sethu, E. Ambikairajah, and J. Epps, “Speaker normalisation
for speech-based emotion detection,” in Proceedings of the 15th
International Conference on Digital Signal Processing (DSP ’07) ,
pp. 611–614, July 2007.
[27] P. Boersma and D. Weenink, “Praat: a system for doing
phonetics by computer,” 2008, />[28] T. F. Yap, E. Ambikairajah, E. Choi, and F. Chen, “Phase
based features for cognitive load measurement system,” in
Proceedings of the IEEE International Conference on Acoustics,
Speech, and Signal Processing (ICASSP ’09), pp. 4825–4828,
2009.