Báo cáo hóa học: " Research Article A Novel Image Compression Method Based on Classified Energy and Pattern Building Blocks Umit Guz" ppt
Bạn đang xem bản rút gọn của tài liệu. Xem và tải ngay bản đầy đủ của tài liệu tại đây (12 MB, 20 trang )
Hindawi Publishing Corporation
EURASIP Journal on Advances in Signal Processing
Volume 2011, Article ID 730694, 20 pages
doi:10.1155/2011/730694
Research Article
A Novel Image Compression Method Based on Classified Energy
and Pattern Building Blocks
Umit Guz
Department of Electrical-Electronics Engineer ing, Engineering Faculty, Isik University, Sile, 34980 Istanbul, Turkey
Correspondence should be addressed to Umit Guz,
Received 26 August 2010; Revised 23 January 2011; Accepted 9 February 2011
Academic Editor: Karen Panetta
Copyright © 2011 Umit Guz. This is an open access article distributed under the Creative Commons Attribution License, which
permits unrestricted use, distribution, and reproduction in any medium, provided the original work is properly cited.
In this paper, a novel image compression method based on generation of the so-called classified energy and pattern blocks (CEPB)
is introduced and evaluation results are presented. The CEPB is constructed using the training images and then located at both
the transmitter and receiver sides of the communication system. Then the energy and pattern blocks of input images to be
reconstructed are determined by the same way in the construction of the CEPB. This process is also associated with a matching
procedure to determine the index numbers of the classified energy and pattern blocks in the CEPB which best represents (matches)
the energy and pattern blocks of the input images. Encoding parameters are block scaling coefficient and index numbers of energy
and pattern blocks determined for each block of the input images. These parameters are sent from the transmitter part to the
receiver part and the classified energy and pattern blocks associated with the index numbers are pulled from the CEPB. Then the
input image is reconstructed block by block in the receiver part using a mathematical model that is proposed. Evaluation results
show that the method provides considerable image compression ratios and image quality even at low bit rates.
1. Introduction
Raw or uncompressed multimedia data such as graphics,
still images, audio, and video requires substantial storage
capacity and transmission bandwidth. The recent growth of
data intensive multimedia-based applications has not only
maintained the need for more efficient ways to encode
the audio signals and images but also have required high
compression ratio and fast communication technology [1].
At the present state of the technology in order to over-
come some limitations on storage, transmission bandwidth,
and transmission time, the images must be compressed
before their storage and transmission and decompressed at
the receiver part [2].
Especially uniform or plain areas in the still images
contain adjacent picture elements (pixels) which have almost
the same numeric values. This case results in large number
of spatial redundancy (or correlation between pixel values
which numerically close to each other) and highly correlated
regions in the images [3, 4]. The idea behind the compression
is to remove this redundancy in order to get more efficient
ways to represent the still images. The performance of the
compression algorithm is measured by the compression ratio
(CR) and it is defined as a ratio between the original image
data size and compressed image data size. In general, the
compression algorithms can be g rouped as lossy and lossless
compression algorithms. It is very well known that, in the
lossy compression schemes, the image compression algo-
rithm should achieve a tradeoff between the image quality
and the compression ratio [5]. It should be noted that, higher
compression ratios produce lower image quality and the
image quality can be effected by the other characteristics,
some details or content of the input image.
Image compression techniques with different schemes
have been developed especially since 1990s. These techniques
are generally based on Discrete Cosine Transform (DCT),
Wavelet Transform and the other transform domain tech-
niques such as Principal Component Analysis (PCA) or
Karhunen-Lo
`
eve Decomposition (KLD) [6–8]. Transform
domain techniques are widely used methods to compress the
still images. The compression performance of these methods
is affected by several factors such as block size, entropy,
quantization error, truncation error and coding gain. In
these methods, two-dimensional images are transformed
2 EURASIP Journal on Advances in Signal Processing
from the spatial domain to the frequency domain. It is
proved that, the human visual system (HVS) is more
sensitive to energy with low spatial frequency than with
high spatial frequency. While the low spatial frequency
components correspond to important image features, the
high frequency ones correspond to image details. Therefore,
compression can be achieved by quantizing and transmitted
the most important or low-frequency coefficients while
the remaining coefficients are discarded. The standards for
compressionofstillimagessuchasJPEG[9–11]exploit
the DCT, which represents a still image as a superposition
of cosine functions with different discrete frequencies [12].
The transformed image data is represented as a function
of two spatial dimensions, and its components are called
spatial frequencies or DCT coefficients. First, the image data
is divided into N
× N blocks and each block is t ransformed
independently to obtain N
× N coefficients. Some of the
DCT coefficients computed for the image blocks will be close
to zero. In order to reduce the quantization levels, these
coefficients are set to zero and the remaining coefficients are
represented with reduced precision or fewer bits. After this
process the quantization results in loss of information but it
also provides the compression.
The usage of uniformly sized image blocks simplifies
the compression, but it does not take into account the
irregular regions within the real images. The fundamental
limitation of the DCT-based compression is the block-based
segmentation or framing [13]. In these methods, depend
on the block size of the images, the degradation which is
also known as the “blocking effect” occurs. A larger block
leads to more efficient coding or compression but requires
more computational power. Although image degradation is
noticeable especially when large DCT blocks are used, the
compression ratio is higher. Therefore, most existing systems
use image blocks of 8
× 8or16×16 pixels as a compromise
between coding or compression efficiency and image quality.
Recently, there are too many works on image coding
that have been focused on the Discrete Wavelet Transform
(DWT). Because of its data reduction capability, DWT
has become a standard method in the image compression
applications. In the wavelet compression, the image data is
transformed and compressed as a single data object rather
than block by block as in a DCT-based compression. In
wavelet compression a uniform distribution of compression
error occurs across the image. DWT provides an adaptive
spatial-frequency resolution which is well suited to the
properties of an HVS. In other words, DWT provides better
spatial resolution at high frequencies and better frequency
resolution at low frequencies. It also offers better image
quality than DCT, especially on a higher compression
ratio [14]. However, the implementation or computational
complexity of the DWT is more expensive than that of the
DCT.
Wavelet transform (WT) represents an image as a sum
of wavelet functions (wavelets) with different locations and
scales [15]. Decomposition of an image into the wavelets
involves a pair of waveforms. One of the waveform represents
the high frequencies corresponding to the detailed parts of an
image called wavelet function and the other one represents
the low f requencies or smooth parts of an image called
scaling function.
A wide v ariety of wavelet-based image compression
schemes have been proposed in the literature [16]. The early
wavelet image coders [17–19] were designed to exploit the
ability of compacting energy on the wavelet decomposition.
The advantages of the wavelet coders with respect to DCT
based ones were quantizers and variable length entropy
coders that they used. Subsequent works were focused on
exploiting the wavelet coefficients more efficiently. In this
manner, Shapiro [20] developed a wavelet-based encoder,
called Embedded Zero-tree Wavelet encoder (EZW). Usage
of zero trees in EZW encoder showed that coding the
wavelet coefficients efficiently can lead to image compression
schemes that are fast and effective by means of r ate-
distortion performance. Said and Pearlman [21] proposed
an improved version of EZW, called SPITH (Set Partitioning
in Hierarchical Trees). This method manages the subdivision
of the trees with better technique and achieves better results
than EZW by means of compression ratio and image quality.
The SPITH algorithm groups the wavelet coefficients in
order to store the significant information, even without
taking into account the final arithmetic encoding stage in
EZW encoder. In the other subsequent work a joint space-
frequency quantization scheme was proposed [22]. In this
approach, the images are modeled by a linear combination of
compacted energy in both frequency and spatial domains. In
the other method called Group Testing for Wavelets (GTW),
the wavelet coefficients are divided into different classes in
a bit plane and each class are coded with a different group
tester [23]. In GTW method, it is considered that, each class
of coefficients has a different context and each group tester is
a general entropy coder. Ratedistortion performances show
that the GTW method is significantly better than SPITH
method and close to SPITH-AC (with arithmetic coding). A
new wavelet-transformation algorithm called The JPEG2000
was released by an ISO standardization committee in January
2001. The new algorithm was offering improved image
qualityatveryhighcompressionratios[24].
Principal Component Analysis (PCA), or equivalently
called Karhunen-Lo
`
eve Transform has been widely used
as an efficient method to provide an informative and
low dimensional representation of the data from which
important features can be extracted [25, 26]. The method
provides an optimal transform in order to decorrelate the
data in the least mean square (LMS) sense among all
linear orthogonal transforms. PCA is a linear orthogonal
transform from an m-dimensional space to p-dimensional
space, p
≤ m, so that the coordinates of the original
data in the new space are uncorrelated and the greatest
amount of the variance of the original data is kept by
only a few coordinates. The principal components can be
obtained by solving an eigenvalue problem of the covariance
or correlation matrix. The first p eigenv ectors correspond to
p principal components and span the principal subspace of
dimension p. The Eigenvectors and associated eigenvalues
are extracted by very well-known numerical algorithms
[27]. In PCA, computation of the covariance matrix is not
practical for handling high-dimensional data. In order to
EURASIP Journal on Advances in Signal Processing 3
reduce the computational complexity of the PCA, several
online neural network approaches were proposed. In Oja’s
algorithm the first or equivalently the most important
and the last eigenvectors were extracted [26]. Generalized
Hebbian Algorithm (GHA) extracts not only these two
eigencomponents but also all the other eigencomponents
[28]. In order to improve the convergence rate or speeding
up the algorithm, an improved version of the GHA called
adaptive principal component extraction was proposed [29].
The successive application of modified Hebbian learning
algorithm was proposed as an extension of the GHA [30]. In
the subsequent works the eigencomponents were recursively
extracted [31, 32]. The cascade recursive least square PCA
algorithm (CRLS-PCA) was proposed in order to resolve the
accumulation of errors in the extraction of large number of
eigencomponents [33, 34]. It is shown that the CRLS-PCA
algorithm outperforms other neural network-based PCA
approaches [35].
It well known that the PCA is a data-dependent trans-
form. In other words, as the transform matrix is built based
on the covariance matrix for a particular input image, it is
possible to lose the approximation ability when the input
image data is changed. In order to resolve this problem,
improved versions of the PCA method have been proposed.
It should be noted that among all these methods only very
few of them take into account the PCA as a universal
or semiuniversal image encoder. In recent works, image
compression performance of the plain PCA is improved by
proposed nonlinear and flexible PCA frameworks [36].
More recently, a variety of powerful and sophisticated
DCT- [37–39] and Wavelet- [40–42]andPCA-[43–46]
based compression schemes have been developed and estab-
lished. Comparative results on these methods show that
the compression performance of DCT based coders (JPEG)
generally degrades the image especially at low bit rates mainly
because of underlying block-based DCT scheme. Wavelet-
based coding methods provide considerable improvements
in image quality at higher compression ratios [47]. On the
other hand, software or hardware implementation of the
DCT is less expensive than that of the wavelet tra nsform
[48]. PCA or Karhunen-Lo
`
eve Transform (KLT) has com-
putational complexity based on the computation of the
covariance matrix of the training data. Despite being able
to achieve much faster compression than KLT, DCT leads
to relatively great degradation of compression quality at the
same compression ratio compared to KLT [49].
In our previous works, [50, 51], a novel method referred
to as SYMPES (systematic procedure for predefined envelope
and signature sequences) was introduced and implemented
on the representation of the 1D signals such as speech signals.
The performance analysis and the comparative results of
the SYMPES with respect to the other conventional speech
compression algorithms were also presented in the other
work [50]. The structure of the SYMPES is based on the
creation of the so-called predefined signature and envelope
sets which are speaker and language independent. The
method is also implemented in the compression of the
biosignals such as ECG [52] and EEG [53] signals.
In this paper, a new block-based image compression
scheme is proposed based on generation of fixed block
sets called Classified Energy Blocks (CEBs) and Classified
Pattern Blocks (CPBs). All these unique block sets are
associated under the framework called Classified Energy
and Pattern Blocks (CEPBs). Basically, the method contains
three main stages: (1) generation of the CEPB, (2) encoding
process which contains construction of the energy and
pattern building blocks of the image to be reconstructed
and obtaining the encoding parameters, and (3) decoding
(reconstruction) process of the input image using the
encoding parameters from the already located CEPB in the
receiver part (decoding).
In this paper, the performance of the method is measured
on the experiments carried out in two groups. In the first
group of experiments, the size of the image block vectors
(L
IBV
)issettoL
IBV
= 8 ×8 = 64 and three random orderings
(threefold) of the training image data set are determined
to construct three versions of the CEPB. Thus, the biasing
effect in the evaluation stage is removed and then the average
performances of the three CEPBs on the test data set (TDS)
are reported. In the second group of experiments, in order
to achieve higher compression ratios, all the images in the
training image data set (excluding the images in the test
data set) are used to construct the CEPB with L
IBV
= 16 ×
16 = 256. It is observed that, when the compression ratio
reaches the higher levels, degradation in the image caused
by the blocking effect is getting visible. But, it is also worth
to mention that, the image quality is at 27 dB level on the
average even at 85,33 : 1 compression ratio.
In this paper, in order to remove the blocking effect and
improve the PSNR levels, a postprocessing filter is used on
the reconstructed images and the PSNR levels are improved
in the range of 0.5–1 dB. The speed of the algorithm and
the compression ratio are also increased by adjusting the size
of the CEPB with an efficient clustering algorithm in both
groupofexperiments.
The preliminary results [54] and the results in this paper
are obtained with new experimental setup and additional
processes (3-Fold evaluation, clustering and postfiltering)
the proposed method promises h igh compression ratio and
acceptable image quality in terms of PSNR levels even at low
bit rates.
2. Method
The method proposed consists of three major parts: con-
struction of the classified energy and pattern blocks (CEPBs),
construction of the energy and pattern blocks of the input
image to be reconstructed and obtaining the encoding
parameters (encoding process) and reconstruction (decod-
ing) process using the mathematical model proposed.
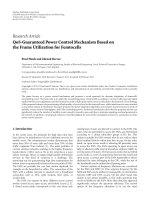
Construction of the Classified Energy and Pattern Blocks
(CEPB). In this stage, we choose very limited number of
image samples (training set) from the whole image set
(image database) to construct the CEPB. In order to do
this, we obtain energy and pattern blocks of each image
files in the training set and then concatenate energy blocks
4 EURASIP Journal on Advances in Signal Processing
Image database
Determination
of energy
blocks
Determination
of pattern
blocks
Elimination
and
clustering
processes
Elimination
and
clustering
processes
CPB
CEPB
CEB
Figure 1: Construction process of the CEPB.
and pattern blocks separately. After an elimination process
which eliminates the similar energy and pattern blocks in
their classes, a classified (or unique) CEPB are obtained as
illustrated in Figure 1.
Construction of the Energy and Pattern Blocks of the Input
Image to Be Reconstructed and Obtaining the Encoding Param-
eters (Encoding Process). In this part, the energy and pattern
blocks are constructed using the same process applied in the
construction of the CEPB excluding the main elimination
part. In this process, energy and pattern blocks of the input
image are compared to the blocks located in the CEPB
using a matching algorithm and encoding parameters are
determined. The encoding parameters for each block are
the optimum scaling coefficient a nd the index numbers of
best representative classified energy and pattern blocks in the
CEPB which matches the energy and pattern blocks of the
input image to be reconstructed, respectively. The scheme of
the encoding process is shown in Figure 2.
Reconstruction (Decoding) Process. This part includes the
image reconstruction (or decoding) process. The input
images (or test images) are reconstructed block by block
using the best representative parameters which are called
block scaling coefficient (BSC), classified energy block index
(IE) and classified pattern block index (IP) based on the
mathematical model as presented in the following section.
The scheme of the decoding process is presented in Figure 3.
In follow ing subsections, we first present the details of
our CEPB construction method which is exploited to recon-
struct the input images. Then, we explain the construction
of the energy and pattern blocks of the input image and how
we employ the CEPB in the transmitter part to obtain the
encoding parameters of the input image. Finally, we briefly
describe the reconstruction (decoding) process using the
encoding parameters which are sent from the tr ansmitter and
reconstruction of the input image block by block using these
parameters employing the CEPB which is already located in
the receiver part.
2.1. Construction of the Classified Energy and Pattern Blocks
(CEPBs). Let the image data Im(m, n)beanM
× N (in our
cases, M
= N = 512) matrix with integer entries in the range
of 0 to 255 or the real values in the range of 0 to 1 where m
and n are row and column pixel indices of the whole image,
respectively. The input image is first divided into nonover-
lapping image blocks, B
r,c
of size i × j, where the image block
size is i
= j = 8, 16, and so forth. The pixel location of the
kth row and lth column of the block, B
r,c
is represented by
P
B
r,c
,k,l
, where the pixel indices are k = 1toi and l = 1toj.
In this case, the total number of blocks in the Im(m, n)will
be equal to N
B
= (M × N)/(i × j). The indices r and c of
the B
r,c
are in the range of 1 to M/i and N/ j,respectively.As
illustrated in Figure 4, in our method, all the image blocks
B
r,c
from left to the right direction are reshaped as column
vectors and constructed a new matrix denoted as B
Im
.
In the construction of the two block sets (CEPBs), a
certain number of image files are determined as a training
set from the whole image database. Each image file in the
training set is divided into the 8
× 8(i = j = 8) or 16 ×
16 (i = j = 16) image blocks, and then each image block
is reshaped as a column vector called image block vector
(vector representation of the image block) which has i
× j
pixels.
All the image files have the same number of pixels (512
×
512 = 262, 144) and equal number of image blocks N
B
.
After the blocking process the image matrix can be written
as follows:
Im
=
⎡
⎢
⎢
⎢
⎢
⎢
⎢
⎢
⎢
⎢
⎣
B
1,1
B
1,2
··· B
1,(N/ j)−1
B
1,(N/ j)
B
2,1
B
2,2
··· B
2,(N/ j)−1
B
2,(N/ j)
··· ··· ··· ··· ···
B
(M/i)−1,1
B
(M/i)−1,2
··· B
(M/i)−1,(N/ j)−1
B
(M/i)−1,(N/ j)
B
(M/i),1
B
(M/i),2
··· B
(M/i),(N/ j)−1
B
(M/i),(N/ j)
⎤
⎥
⎥
⎥
⎥
⎥
⎥
⎥
⎥
⎥
⎦
.
(1)
ThematrixImistransformedtoanewmatrix,B
Im
,
which its column vectors are the image blocks of the matrix,
Im
B
Im
=
B
1,1
··· B
1,(N/ j)
B
2,1
··· ··· B
(M/i),(N/ j)
. (2)
The columns of the matrix B
Im
are cal led image block
vector (IBV) and the length of the IBV is represented by
L
IBV
= i × j (8 × 8 = 64 or 16 × 16 = 256, etc.).
As it is explained above, in the method that we proposed
the IBVs of an image can be represented by a mathematical
model which consists of the multiplication of the three quan-
tities; scaling factor, classified pattern and energy blocks.
EURASIP Journal on Advances in Signal Processing 5
Input image
to be
reconstructed
Determination
of energy
blocks
Determination
of pattern
blocks
Partitioning
(image blocks)
Vectorization
(image block vectors)
Calculation of
block scaling
coefficients
CEPB
Determination of
indexes of the best
CEB for each
image block
Determination of
indexes of the best
CPB for each
image block
Optimization of the
block scaling
coefficient for each
image block
Encoding process—transmitter part
Encoding
parameters(G
i
,
index numbers
IP and IE of
P
IP
and E
IE
)
Figure 2: Encoding process.
Pulling the IPth and
IEth vectors from
CEPB
Decoding process—receiver part
CEPB
Construction of the
image block vectors
using the
mathematical model
Construction of
the image
blocks
Reconstructed
image
Encoding
parameters
(G
i
,IP,IE)
Figure 3: Decoding process.
B
r,c
Image block
Image
Image
block vectors
(IBV
i
) (columns)
1
1
i × j
i
× j
P
B
r,c
,k,l
M × N
Image
block pixel
.
.
.
.
.
.
.
.
.
.
.
.
.
.
.
.
.
.
···
( i × j )×N
B
Figure 4: Partitioning of an image into the image blocks and reshaping as vector form.
6 EURASIP Journal on Advances in Signal Processing
In our method it is proposed that any ith IBV of length
L
IBV
can be approximated as IBV
i
= G
i
P
IP
E
IE
,(i = 1, , N
B
)
where the scaling coefficient, G
i
of the IBV is a real constant,
IP
∈{1, 2, ,N
IP
},IE ∈{1, 2, , N
IE
} are the index
number of the CPB and index number of the CEB, where N
IP
and N
IE
are the total number of the CPB and CEB indices,
respectively. IP, IE, N
IP
,andN
IE
are all integers.
The CEB in the vector form is represented as E
T
IE
=
[e
IE1
e
IE2
··· e
IEL
IBV
] and it is generated utilizing the
luminance information of the images and it contains basi-
cally the energy characteristics of IBV
i
under consideration
in broad sense. Furthermore, it will be shown that the quan-
tity G
i
E
IE
carries almost maximum energy of IBV
i
in the least
mean square (LMS) sense. In this multiplication expression
the contribution of the G
i
is to scale the luminance level of
the IBV
i
.
P
IP
is (L
IBV
× L
IBV
) diagonal matrix such that
P
IP
= diag
p
IP1
p
IP2
p
IP3
··· p
IPL
IBV
,(3)
P
IP
acts as a pattern term on the quantity G
i
E
IE
which also
reflects the distinctive properties of the image block data
under consideration.
It is well known that each IBV can be spanned in a
vector space formed by the orthonormal vectors
{φ
ik
}.Let
the real orthonormal vectors be the columns of a transposed
transformation matrix (Φ
T
i
)
Φ
T
i
=
φ
i1
φ
i2
··· φ
iL
IBV
. (4)
It is evident that
IBV
i
= Φ
T
i
G
i
. (5)
where
G
T
i
=
g
1
g
2
··· g
L
IBV
. (6)
From the property of Φ
T
i
= Φ
−1
i
, the equations Φ
i
IBV
i
=
Φ
i
Φ
−1
i
G
i
and G
i
= Φ
i
IBV
i
can be obtained, respectively.
Thus, IBV
i
can be written as a weighted sum of these
orthonormal vectors
IBV
i
=
L
IBV
k=1
g
k
φ
ik
, k = 1, 2, 3, , L
IBV
. (7)
From the above equation, the coefficients of the IBVs can
be obtained as
g
k
= φ
T
ik
IBV
i
, k = 1, 2, 3, , L
IBV
. (8)
Let IBV
it
=
t
k
=1
g
k
φ
ik
be the truncated version of IBV
i
such that 1 ≤ t ≤ L
IBV
.Itisnotedthatift = L
IBV
, then IBV
i
will be equal to IBV
it
. In this case, the approximation error
(ε
t
)isgivenby
ε
t
= IBV
i
− IBV
it
=
L
IBV
k=t+1
g
k
φ
ik
. (9)
In this equation, φ
ik
are determined by minimizing the
expected value of the error vector with respect to φ
ik
in
the LMS sense. The above-mentioned LMS process results
in the following eigenvalue problem [55]. Eventually φ
ik
are
computed as the eigenvectors of the correlation matrix (R
i
)
of the IBV
i
. By using orthonormality condition, the LMS
error is given by
ε
t
ε
T
t
=
L
IBV
k=t+1
g
2
k
. (10)
Let J
t
designate the expected value of the total squared
error ε
t
ε
T
t
.Then,
J
t
= E
ε
t
ε
T
t
=
L
IBV
k=t+1
E
g
2
k
, (11)
E
g
2
k
=
E
φ
T
ik
IBV
T
i
IBV
i
φ
ik
=
φ
T
ik
R
i
φ
ik
, (12)
where R
i
= E[IBV
T
i
IBV
i
] is defined as the correlation matrix
of IBV
i
. In order to obtain the optimum transform, it is
desired to find φ
ik
that minimizes J
t
for a gi ven t,subject
to the orthonormality constraint. Using Lagrange multipliers
λ
k
, we minimize J
t
by taking the gradient of the equation
obtained above with respect to φ
ik
:
J
t
=
L
IBV
k=t+1
φ
T
ik
R
i
φ
ik
− λ
k
φ
T
ik
φ
ik
− 1
,
∂J
t
∂φ
ik
=
∂
∂φ
ik
⎡
⎣
L
IBV
k=t+1
φ
T
ik
R
i
φ
ik
− λ
k
φ
T
ik
φ
ik
− 1
⎤
⎦
=
0,
2R
i
φ
ik
− 2λ
k
φ
ik
= 0,
R
i
φ
ik
= λ
k
φ
ik
,
(13)
R
i
is the correlation matrix. It is real, symmetric with respect
to its diagonal elements, positive semidefinite, and Toeplitz
matrix [56]:
R
i
=
⎡
⎢
⎢
⎢
⎢
⎢
⎢
⎢
⎢
⎢
⎢
⎣
r
i
(
1
)
r
i
(
2
)
r
i
(
3
)
··· r
i
(
L
IBV
)
r
i
(
2
)
r
i
(
1
)
r
i
(
2
)
··· r
i
(
L
IBV
− 1
)
r
i
(
3
)
r
i
(
2
)
r
i
(
1
)
··· r
i
(
L
IBV
− 2
)
.
.
.
.
.
.
.
.
.
.
.
.
.
.
.
r
i
(
L
IBV
)
r
i
(
L
IBV
− 1
)
r
i
(
L
IBV
− 2
)
··· r
i
(
1
)
⎤
⎥
⎥
⎥
⎥
⎥
⎥
⎥
⎥
⎥
⎥
⎦
,
r
i
(
d +1
)
=
1
L
IBV
[(iL
IBV
)−d]
j=
[
(
i
−1
)
·L
IBV
+1
]
x
j
x
j+d
, d = 0, 1, 2, ,L
IBV
− 1.
(14)
Obviously, λ
ik
and φ
ik
are the eigenvalues a nd eigenvec-
tors of the eigenvalue problem under consideration. It is well
EURASIP Journal on Advances in Signal Processing 7
known that the eigenvalues of R
i
are also real, distinct, and
nonnegative. Moreover, the eigenvectors φ
ik
of the R
i
are all
orthonormal. Let eigenvalues be sorted in descending order
such that (λ
1i
≥ λ
2i
≥ λ
3i
≥···≥λ
L
IBV
i
) with corresponding
eigenvectors. The total energy of the IBV
i
is then given by
IBV
T
i
IBV
i
:
IBV
T
i
IBV
i
=
L
IBV
k=1
g
2
ik
=
L
IBV
k=1
λ
ik
. (15)
Equation (15) may be truncated by taking the first p
principal components, which have the highest energy of the
IBV
i
such that
IBV
i
∼
=
p
k=1
g
k
φ
ik
. (16)
The simplest form of (16) can be obtained by setting p
=
1. The eigenvector φ
ik
is called energy vector. That is to say,
the energy vector, which has the highest energy in the LMS
sense, may approximate each image block belonging to the
IBV
i
.Thus,
IBV
i
∼
=
g
1
φ
i1
. (17)
In this case, one can vary the L
IBV
as a parameter in such
way that almost all the energy is captured within the first
term of (16) and the rest becomes negligible. That is why φ
i1
is cal l ed the energy vector since it contains most of the useful
information of the original IBV under consideration. Once
(17) is obtained, it can be converted to an equality by means
of a pattern term P
i
which is a diagonal matrix for each IBV.
Thus, IBV
i
is computed as
IBV
i
= G
i
P
i
φ
i1
. (18)
In (18), diagonal entries p
ir
of the matrix P
i
are
determined in terms of the entries of φ
i1r
of the energy
vector φ
i1
and the entries (pixels) IBV
ir
of the IBV
i
by simple
division. Hence,
p
ir
=
IBV
ir
G
i
φ
i1r
,
(
r = 1, 2, , L
IBV
)
. (19)
In essence, the quantities p
ir
of (19) somewhat absorb
the energy of the terms eliminated by truncation of (16).
In this paper, several tens of thousands of IBVs were
investigated and several thousands of energy and pattern
blocks were generated. It was observed that the energy and
the pattern blocks exhibit repetitive similarities. In this case,
one can eliminate the similar energy and pattern blocks and
thus, constitute the so-called classified energy and classified
pattern block sets with one of a kind or unique blocks.
For the elimination process Pearsons correlation coefficient
(PCC) [57] is utilized. PCC is designated by ρ
YZ
and given as
ρ
YZ
=
L
i=1
y
i
z
i
−
L
i=1
y
i
L
i=1
z
i
/L
L
i=1
y
2
i
−
L
i=1
y
i
2
/L
·
L
i=1
z
2
i
−
L
i=1
z
i
2
/L
.
(20)
In (20) Y
=[y
1
y
2
··· y
L
]andZ = [z
1
z
2
··· z
L
]
aretwosequencessubjecttocomparison,whereL is the
length of the sequences. It is assumed that the two s equences
are almost identical if 0.9
≤ ρ
YZ
≤ 1. Hence, similar energy
and pattern blocks are eliminated accordingly.
During the execution of the elimination stage, it is
observed that similarity rate of the energy blocks are much
higher than the pattern blocks. Because of huge differences
in the similarity rate or in other words elimination ra te, the
numbers of classified energy blocks in the CEPB are very
limited. This is natural because energy blocks reflect the
luminance information of the image blocks, while pattern
blocks carry the pattern or variable information in the image
blocks. This is in reality related to tasks of these blocks in the
method as explained in the beginning of this section.
For the elimination, PCC is set to ρ
YZ
= 0, 98 which is
very close to ρ
YZ
= 1 but it can be relaxed (or adjusted)
according to the desired number (size) of classified energy
and pattern blocks in the CEPB.
In the elimination stage, first the similar energy and
pattern block groups are constructed and one representative
energy and one representative pattern block are determined
for each group by averaging all the blocks in the groups.
These representative energy and pattern blocks are renamed
as classified energy and pattern blocks and constitute the
CEPB.
Thus, the energ y blocks which have unique shapes are
combined under the set called classified energy block CEB
=
{
E
n
ie
; n
ie
= 1, 2, 3, , N
IE
} set. The integer N
IE
designates
the total number of elements in this set. Similarly, reduced
pattern blocks are combined under the set called classified
pattern block CPB
={P
n
ip
; n
ip
= 1, 2, 3, , N
IP
} set. The
N
IP
designates the total number of unique pattern sequences
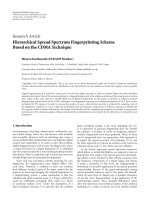
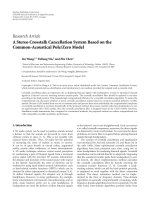
in CPB set. Some similar energy and pattern blocks are
depicted in Figures 5 and 6,respectively.
Computational steps and the details of the encoding
and decoding algorithms are given in Sections 2.2 and 2.3,
respectively.
2.2. Encoding Algorithm
Inputs. The inputs include the following:
(1) image file
{Im(m, n), M ×N = 512×512} to be enco-
ded;
(2) size of the IBV of the Im(m, n)(L
IBV
= i× j = 8×8 =
64 or L
IBV
= i × j = 16 × 16 = 256);
(3) the CEPB (CEB
={E
IE
;IE= 1, 2, , N
IE
} and CPB =
{
P
IP
;IP = 1, 2, , N
IP
}) located in the transmitter
part.
Computational Steps.
Step 1. Divide Im(m, n) into the image blocks, and then con-
struct the B
Im
.
Substep 2.1. For each IBV
i
pull an appropriate E
IE
from
CEB such that the distance or the total error δ
I
E
=
IBV
i
− G
I
E
E
I
E
2
is minimum for all I
E = 1, 2, 3, ,
IE, , N
IE
. This step yields the index IE of the E
IE
. In this
case, δ
IE
= min{IBV
i
− G
I
E
E
I
E
2
}=IBV
i
− G
IE
E
IE
2
.
8 EURASIP Journal on Advances in Signal Processing
Figure 5: Some of the similar energy blocks (4 similar energy blocks
from left to right in each set).
Figure 6: Some of the similar pattern blocks (6 similar pattern
blocks from left to r ight in each set).
Substep 2.2. Store the index number IE that refers to E
IE
,in
this case, IBV
i
≈ G
IE
E
IE
.
Substep 3.3. Pull an appropriate P
IP
from CPB such that the
error is further minimized for all I
P = 1, 2, 3, ,IP, , N
IP
.
This step yields the index IP of P
IP
δ
IP
= min
IBV
i
− G
IE
P
I
P
E
IE
2
=
IBV
i
− G
IE
P
IP
E
IE
2
.
(21)
Substep 3.4. Store the index number IP that refers to P
IP
.At
the end of this step, the best E
IE
and the best P
IP
are found by
appropriate selections. Hence, the IBV
i
is best described in
terms of the patterns of P
IP
and E
IE
, that is, IBV
i
∼
=
G
IE
P
IP
E
IE
.
Step 4. Having fixed P
IP
and E
IE
,onecanreplaceG
IE
by computing a new block scaling coefficient G
i
=
(P
IP
E
IE
)
T
IBV
i
/(P
IP
E
IE
)
T
(P
IP
E
IE
) to further minimize the
distance between the vectors IBV
i
and G
IE
P
IP
E
IE
in the LMS
sense. In this case, the global minimum of the error is
obtained a nd it is given by δ
Global
=IBV
i
− G
i
P
IP
E
IE
2
.At
this step, IBV
Ai
= G
i
P
IP
E
IE
.
2.3. Decoding Algorithm
Inputs. The inputs include the following:
(1) the encoding parameters G
i
, IP and IE which best
represent the corresponding image block vector IBV
i
of the input image (These parameters are received
from the transmitter part for each image block vector
of the input image);
(2) size of the IBV
i
of the Im(m, n)(L
IBV
= i×j = 8×8 =
64 or L
IBV
= i × j = 16 × 16 = 256);
(3) the CEPB (CEB
={E
IE
;IE= 1, 2, , N
IE
} and CPB =
{
P
IP
;IP= 1, 2, , N
IP
}) located in the receiver part.
Computational Steps.
Step 1. After receiving the encoding parameters G
i
, IP, and
IE of the IBV
i
from the transmitter, the corresponding IEth
classified energy and IPth classified pattern blocks are pulled
from the CEPB.
Step 2. Approximated image block vector IBV
Ai
is con-
structed using the proposed mathematical model IBV
Ai
=
G
i
P
IP
E
IE
.
Step 3. The previous steps are repeated for each IBV to
generate approximated version (
B
Im
) of the B
Im
B
Im
=
B
1,1
···
B
1,(N/ j)
B
2,1
··· ···
B
(M/i),(N/ j)
.
(22)
Step 4.
B
Im
is reshaped to obtain the decoded (reconstructed)
version of the or iginal image data as follows:
Im
=
⎡
⎢
⎢
⎢
⎢
⎢
⎢
⎢
⎢
⎢
⎢
⎣
B
1,1
B
1,2
···
B
1,(N/ j)−1
B
1,(N/ j)
B
2,1
B
2,2
···
B
2,(N/ j)−1
B
2,(N/ j)
··· ··· ··· ··· ···
B
(M/i)−1,1
B
(M/i)−1,2
···
B
(M/i)−1,(N/ j)−1
B
(M/i)−1,(N/ j)
B
(M/i),1
B
(M/i),2
···
B
(M/i),(N/ j)−1
B
(M/i),(N/ j)
⎤
⎥
⎥
⎥
⎥
⎥
⎥
⎥
⎥
⎥
⎥
⎦
.
(23)
2.4. Introducing the Blocking Effect and Postfilter ing. It is well
known for block-coded image compression schemes, the
image is partitioned into blocks, and certain transform is
performed on each individual block. In particular, at low
bit rates, since each block is represented primarily by the
EURASIP Journal on Advances in Signal Processing 9
first transform coefficient, the rectangular block structure
becomes very visible because of the presentation of the
discontinuity at block boundaries. There are several existing
techniques that attempt to remove blocking effect or artifacts
of the low bit-rate coded images.
In this frame-based work, the blocking effect o ccurs
especially at low bit rates. Especially, when the size of the
CEPB is highly reduced or the size of the image blocks
(L
IBV
) are increased f rom 8 × 8to16× 16, the effect of the
blocking becomes visible. In order to remove these effects
a 2D Savitzky-Golay filtering [ 58 ] or smoothing process
is applied after the reconstruction process at the receiver
side. The aim of this postprocessing is smoothing the block
boundaries so that both the PSNR and visual perception of
the reconstructed image can be improved.
At the end of the reconstruction process for all the images
in the first and second groups of experiments, the Savitzky-
Golay filter is applied on the reconstructed images. The
PSNR performances of the filter of various window sizes
and different polynomial orders are compared by an iterative
algorithm. After all these comparisons, it is observed that,
for the first group of experiments, the frame size and the
order of the polynomial which maximizes the PSNR level are
found as 5 and 3, respectively. The frame size and the order
of the polynomial are determined as 7 and 3 for the second
groupofexperiments.ThePSNRandMSEperformancesare
noticed before and after the filtering process and at the end
of the evaluation process, it is seen that the PSNR level is
increased about 0.5–1dB compared to the results obtained
without filtering process for the first and second group of
experiments.
3. Experiments and Results
3.1. Data Sets. In our experiments, 67 gray-scale, 8 bits/pixel,
512
× 512 JPEG images [59] were used. The experiments
were implemented in two groups. In the first group of
experiments the size of the image blocks is L
IBV
= i × j =
8 ×8 = 64 while in the second L
IBV
= i × j = 16 ×16 = 256.
In the first g roup of the experiments, three randomly
selected file sets (Fold 1, Fold 2, and Fold 3) from the
whole data set are used for training or construction of three
different CEPBs. 12 image files which are randomly chosen
from the rest of the data set are determined as the test data
set (TDS). In the second group of experiments, we enlarged
the training set to 55 files (TDA) excluding all the image
files used in the test data set. All these cases are summarized
in Table 1. The images in the tr aining and test data sets are
shown in Figures 7, 8, 9,and10 for fold 1, fold 2, fold 3, and
TDS, respectively.
3.2. Evaluation Metrics. Even though the HVS is the most
reliable assessment tool to measure the quality of an image,
the subjective qualit y measurement methods based on HVS
such as mean opinion score (MOS) are not practical.
Objective image and video quality metrics such as peak
signal-to-noise ratio (PSNR) and mean squared error (MSE)
are the most widely used objective image quality/distortion
metrics and they can predict perceived image and video
quality automatically. It should be a lso noted that these
metrics are also criticized because they are not correlating
well with the perceived quality measurement. Recently, image
and video quality assessment research is trying to develop
new objective image and video quality measures such as
structural-similarity-based image quality assessment (SSIM)
by considering HVS characteristics [60, 61]. Almost all the
works in the literature consider the PSNR and MSE as an
evaluation metrics to measure the quality of the image.
Therefore, as a starting point at least for the comparisons,
the performance of the newly proposed method is measured
using PSNR and MSE metrics.
Peak Signal-to-Noise Ratio (PSNR). PSNR is the ratio
between the signal’s maximum p ower and the power of the
signal’s noise. The higher PSNR means better quality of the
reconstructed image. The PSNR can be computed as
PSNR
= 20 log
10
b
√
MSE
, (24)
where b is the largest possible value of the image signal
(typically 255 or 1). The PSNR is given in decibel units (dB).
Mean Squared Error (MSE). MSE represents the cumulative
squared error between the original a nd the reconstructed
image, whereas PSNR represents a measure of the peak error.
The MSE can be described as the mean of the square of
the differences in the pixel values between the corresponding
pixels of the two images. MSE can be written as
MSE
=
1
MN
M
i=1
N
j=1
Im(m, n) −
Im(m, n)
2
, (25)
where Im(m, n)and
Im(m, n) are the original and the
reconstructed images, respectively. M
×N is the dimension of
the images. In our experiments the dimension of the images
is 512
× 512.
Compression Ratio (CR). CR is defined as the ratio of the
total number of bits required to represent the original and
reconstructed image blocks. Other representation of the CR
is the bpp:
CR
=
bit
original
bit
reconstructed
,bpp
bit per pixel
=
L
IBV
CR
. (26)
3.3. Experimental Results. In the first group of experiments
the total number of bits required to represent the 8
×8 blocks
for each original image file is (8
× 8) × 8bits = 512 bits.
In the first group of experiments the size of the CEPB is
determined and fixed for all folds (3 Folds) by adjusting the
PCC. Thus, total numbers of classified energy and pattern
blocks are determined in the range of 2
5
and 2
14
in the CEB
and CPB sets, respectively. It is also concluded that N
IE
and
N
IP
are represented by 5 bits and 14 bits, respectively. For
representation of the block scaling coefficient (BSC) 5 bits are
good enough. As a result, 24 bits are required in total in order
10 EURASIP Journal on Advances in Signal Processing
Figure 7: Image files in the training data set (Fold 1).
Figure 8: Image files in the training data set (Fold 2).
Figure 9: Image files in the training data set (Fold 3).
EURASIP Journal on Advances in Signal Processing 11
Figure 10: Image files in the test data set (TDS).
Table 1: Training and test data file sets.
File sets Name of the files in the sets L
IBV
Fold 1 F1, F2, F3, F4, F5, F6, F7 8 × 8 = 64
Fold 2 F8, F11, F12, F13, F16, F38, F40 8
× 8 = 64
Fold 3 F22, F47, F64, F69 8
× 8 = 64
TDA All image files (TDS is excluded) 16
× 16 = 256
Test data set (TDS) Lenna, F14, F15, F24, F28, F39, F41, F48, F60, F61, F65, F73
8
× 8 = 64
16
× 16 = 256
Table 2: Bit allocation table for the first group of experiments.
File sets CEPB size Number of bits required CEPB size (with clustering) Number of bits required (w ith clustering)
Fold 1
CEB
= 31 < 2
5
CEB = 5CEB= 32 < 2
5
CEB = 5
CPB
= 15607 < 2
14
CPB = 14 CPB = 4096 < 2
12
CPB = 12
BSC
= 5BSC= 5
Fold 2
CEB
= 32 = 2
5
CEB = 5CEB= 32 < 2
5
CEB = 5
CPB
= 15811 < 2
14
CPB = 14 CPB = 4096 < 2
12
CPB = 12
BSC
= 5BSC= 5
Fold 3
CEB
= 32 = 2
5
CEB = 5CEB= 32 < 2
5
CEB = 5
CPB
= 13684 < 2
14
CPB = 14 CPB = 4096 < 2
12
CPB = 12
BSC
= 5BSC= 5
12 EURASIP Journal on Advances in Signal Processing
Table 3: Evaluation results of Fold 1.
Image file name Block size Bit per pixel (bpp) Compression ratio (CR) MSE PSNR (dB) MSE (filtered) PSNR (dB) (filtered)
Lenna 8 × 8 0,375 21,33 0,00130 28,93 0,00110 29,66
F14 8
× 8 0,375 21,33 0,00059 32,23 0,00052 32,80
F15 8
× 8 0,375 21,33 0,00087 30,61 0,00078 31,07
F24 8
× 8 0,375 21,33 0,00150 28,12 0,00140 28,59
F28 8
× 8 0,375 21,33 0,00077 31,09 0,00071 31,43
F39 8
× 8 0,375 21,33 0,00150 28,13 0,00140 28,53
F41 8
× 8 0,375 21,33 0,00073 31,31 0,00058 32,31
F48 8
× 8 0,375 21,33 0,00150 28,27 0,00160 28,08
F60 8
× 8 0,375 21,33 0,00082 30,83 0,00072 31,42
F61 8
× 8 0,375 21,33 0,00093 30,29 0,00084 30,74
F65 8
× 8 0,375 21,33 0,00110 29,70 0,00093 30,28
F73 8
× 8 0,375 21,33 0,00046 33,36 0,00038 34,11
Average 8 × 8 0,375 21,33 0,00101 30,24 0,00091 30,75
Table 4: Evaluation results of Fold 2.
Image file name Block size Bit per pixel (bpp) Compression ratio (CR) MSE PSNR (dB) MSE (filtered) PSNR (dB) (filtered)
Lenna 8 × 8 0,375 21,33 0,00140 28,45 0,00110 29,47
F14 8
× 8 0,375 21,33 0,00073 31,36 0,00058 32,32
F15 8
× 8 0,375 21,33 0,00097 30,11 0,00085 30,70
F24 8
× 8 0,375 21,33 0,00180 27,47 0,00150 28,16
F28 8
× 8 0,375 21,33 0,00087 30,59 0,00077 31,11
F39 8
× 8 0,375 21,33 0,00180 27,50 0,00150 28,21
F41 8
× 8 0,375 21,33 0,00089 30,48 0,00065 31,87
F48 8
× 8 0,375 21,33 0,00180 27,44 0,00170 27,74
F60 8
× 8 0,375 21,33 0,00110 29,73 0,00090 30,44
F61 8
× 8 0,375 21,33 0,00099 30,03 0,00079 31,02
F65 8
× 8 0,375 21,33 0,00120 29,15 0,00099 30,04
F73 8
× 8 0,375 21,33 0,00053 32,73 0,00041 33,79
Average 8 × 8 0,375 21,33 0,00117 29,59 0,00098 30,41
Table 5: Evaluation results of Fold 3.
Image file name Block size Bit per pixel (bpp) Compression ratio (CR) MSE PSNR (dB) MSE (filtered) PSNR (dB) (filtered)
Lenna 8 × 8 0,375 21,33 0,00140 28,46 0,00110 29,45
F14 8
× 8 0,375 21,33 0,00075 31,24 0,00060 32,21
F15 8
× 8 0,375 21,33 0,00100 29,88 0,00087 30,59
F24 8
× 8 0,375 21,33 0,00180 27,42 0,00150 28,13
F28 8
× 8 0,375 21,33 0,00089 30,46 0,00078 31,03
F39 8
× 8 0,375 21,33 0,00180 27,44 0,00150 28,14
F41 8
× 8 0,375 21,33 0,00090 30,45 0,00067 31,73
F48 8
× 8 0,375 21,33 0,00180 27,45 0,00170 27,67
F60 8
× 8 0,375 21,33 0,00110 29,55 0,00093 30,30
F61 8
× 8 0,375 21,33 0,00099 30,02 0,00080 30,93
F65 8
× 8 0,375 21,33 0,00120 29,17 0,00098 30,07
F73 8
× 8 0,375 21,33 0,00057 32,40 0,00044 33,53
Average 8 × 8 0,375 21,33 0,00118 29,50 0,00099 30,32
EURASIP Journal on Advances in Signal Processing 13
Table 6: Evaluation results of Fold 1 (with clustering).
Image file name Block size Bit per pixel (bpp) Compression ratio (CR) MSE PSNR (dB) MSE (filtered) PSNR (dB) (filtered)
Lenna 8 × 8 0,3438 23,27 0,00140 28,46 0,00120 29,16
F14 8
× 8 0,3438 23,27 0,00067 31,71 0,00060 32,22
F15 8
× 8 0,3438 23,27 0,00095 30,19 0,00086 30,64
F24 8
× 8 0,3438 23,27 0,00170 27,68 0,00150 28,17
F28 8
× 8 0,3438 23,27 0,00084 30,71 0,00077 31,10
F39 8
× 8 0,3438 23,27 0,00170 27,63 0,00160 28,06
F41 8
× 8 0,3438 23,27 0,00082 30,86 0,00067 31,72
F48 8
× 8 0,3438 23,27 0,00170 27,71 0,00170 27,68
F60 8
× 8 0,3438 23,27 0,00100 29,95 0,00090 30,44
F61 8
× 8 0,3438 23,27 0,00092 30,32 0,00082 30,86
F65 8
× 8 0,3438 23,27 0,00120 29,19 0,00110 29,74
F73 8
× 8 0,3438 23,27 0,00050 32,97 0,00043 33,67
Average 8 × 8 0,3438 23,27 0,00112 29,78 0,00101 30,29
Table 7: Evaluation results of Fold 2 (with clustering).
Image file name Block size Bit per pixel (bpp) Compression ratio (CR) MSE PSNR (dB) MSE (filtered) PSNR (dB) (filtered)
Lenna 8 × 8 0,3438 23,27 0,00160 28,06 0,00130 28,86
F14 8
× 8 0,3438 23,27 0,00081 30,91 0,00067 31,72
F15 8
× 8 0,3438 23,27 0,00110 29,67 0,00095 30,20
F24 8
× 8 0,3438 23,27 0,00200 27,07 0,00170 27,68
F28 8
× 8 0,3438 23,27 0,00095 30,21 0,00084 30,73
F39 8
× 8 0,3438 23,27 0,00200 26,97 0,00170 27,60
F41 8
× 8 0,3438 23,27 0,00097 30,13 0,00076 31,17
F48 8
× 8 0,3438 23,27 0,00200 26,89 0,00190 27,19
F60 8
× 8 0,3438 23,27 0,00110 29,42 0,00099 30,04
F61 8
× 8 0,3438 23,27 0,00110 29,66 0,00089 30,46
F65 8
× 8 0,3438 23,27 0,00140 28,64 0,00120 29,36
F73 8
× 8 0,3438 23,27 0,00057 32,37 0,00047 33,24
Average 8 × 8 0,3438 23,27 0,00130 29,17 0,00111 29,85
Table 8: Evaluation results of Fold 3 (with clustering).
Image file name Block size Bit per pixel (bpp) Compression ratio (CR) MSE PSNR (dB) MSE (filtered) PSNR (dB) (filtered)
Lenna 8 × 8 0,3438 23,27 0,00150 28,30 0,00120 29,16
F14 8
× 8 0,3438 23,27 0,00081 30,90 0,00066 31,75
F15 8
× 8 0,3438 23,27 0,00110 29,67 0,00094 30,24
F24 8
× 8 0,3438 23,27 0,00190 27,15 0,00170 27,78
F28 8
× 8 0,3438 23,27 0,00094 30,25 0,00053 30,76
F39 8
× 8 0,3438 23,27 0,00190 27,12 0,00170 27,75
F41 8
× 8 0,3438 23,27 0,00096 30,17 0,00074 31,26
F48 8
× 8 0,3438 23,27 0,00200 27,08 0,00180 27,35
F60 8
× 8 0,3438 23,27 0,00110 29,48 0,00096 30,15
F61 8
× 8 0,3438 23,27 0,00110 29,76 0,00087 30,57
F65 8
× 8 0,3438 23,27 0,00130 28,90 0,00110 29,65
F73 8
× 8 0,3438 23,27 0,00058 32,30 0,00047 33,20
Average 8 × 8 0,3438 23,27 0,00127 29,26 0,00106 29,97
14 EURASIP Journal on Advances in Signal Processing
Table 9: Bit allocation table for the second group of experiments.
File sets CEPB size Number of bits required CEPB size (clustered) Number of bits required
TDA
CEB
= 171 < 2
8
CEB = 8CEB= 32 < 2
5
CEB = 5
CPB
= 54306 < 2
16
CPB = 16 CPB = 13312 < 2
14
CPB = 14
BSC
= 5BSC= 5
Table 10: Evaluation results of the second group of experiments.
Image file name Block size Bit per pixel (bpp) Compression ratio (CR) MSE PSNR (dB) MSE (filtered) PSNR (dB) (filtered)
Lenna 16 × 16 0,2266 70,62 0,00300 25,20 0,00260 25,87
F14 16
× 16 0,2266 70,62 0,00150 28,35 0,00130 28,87
F15 16
× 16 0,2266 70,62 0,00180 27,43 0,00160 27,88
F24 16
× 16 0,2266 70,62 0,00350 24,57 0,00310 25,06
F28 16
× 16 0,2266 70,62 0,00150 28,20 0,00130 28,77
F39 16
× 16 0,2266 70,62 0,00340 24,73 0,00300 25,17
F41 16
× 16 0,2266 70,62 0,00190 27,18 0,00160 27,83
F48 16
× 16 0,2266 70,62 0,00310 25,02 0,00310 25,05
F60 16
× 16 0,2266 70,62 0,00180 27,38 0,00150 28,15
F61 16
× 16 0,2266 70,62 0,00220 26,61 0,00190 27,17
F65 16
× 16 0,2266 70,62 0,00250 25,94 0,00220 26,62
F73 16
× 16 0,2266 70,62 0,00110 29,58 0,00092 30,36
Average 16 × 16 0,2266 70,62 0,00228 26,68 0,00201 27,23
Table 11: Evaluation results of the second group of experiments (with clustering).
Image file name Block size Bit per pixel (bpp) Compression ratio (CR) MSE PSNR (dB) MSE (filtered) PSNR (dB) (filtered)
Lenna 16 × 16 0,1875 85,33 0,00320 24,95 0,00280 25,57
F14 16
× 16 0,1875 85,33 0,00160 28,00 0,00140 28,46
F15 16
× 16 0,1875 85,33 0,00190 27,16 0,00180 27,56
F24 16
× 16 0,1875 85,33 0,00380 24,25 0,00340 24,73
F28 16
× 16 0,1875 85,33 0,00160 27,99 0,00140 28,54
F39 16
× 16 0,1875 85,33 0,00360 24,39 0,00330 24,81
F41 16
× 16 0,1875 85,33 0,00200 26,92 0,00180 27,45
F48 16
× 16 0,1875 85,33 0,00350 24,53 0,00340 24,69
F60 16
× 16 0,1875 85,33 0,00200 27,03 0,00170 27,68
F61 16
× 16 0,1875 85,33 0,00230 26,31 0,00210 26,80
F65 16
× 16 0,1875 85,33 0,00280 25,52 0,00240 26,16
F73 16
× 16 0,1875 85,33 0,00120 29,29 0,00100 29,98
Average 16 × 16 0,1875 85,33 0,00246 26,36 0,00221 26,87
EURASIP Journal on Advances in Signal Processing 15
Table 12: Evaluation results (overall).
Group of experiment
Fold Block size
Bit per pixel
(bpp)
Compression
ratio (CR)
MSE PSNR (dB)
MSE
(filtered)
PSNR (dB)
(filtered)
1
Fold 1 0,00101 30,24 0,00091 30,75
Fold 2 8
× 8 0,3750 21,33 0,00117 29,59 0,00098 30,41
Fold 3 0,00118 29,50 0,00099 30,32
Average
8
× 8 0,3750 21,33 0,00112 29,78 0,00096 30,49
1
Fold 1 0,00112 29,78 0,00101 30,29
Fold 2 8
× 8 0,3438 23,27 0,00130 29,17 0,00111 29,85
Fold 3 0,00127 29,26 0,00106 29,97
Average
8
× 8 0,3438 23,27 0,00123 29,40 0,00106 30,04
2
16
× 16
0,2266 70,62 0,00228 26,68 0,00201 27,23
0,1875 85,33 0,00246 26,36 0,00221 26,87
to represent the 8 × 8 blocks of the images. In this case, the
compressionratiowillbecomputedasfollows:
CR
=
bit
original
bit
reconstructed
=
(
8
× 8
)
× 8bits
(
5+14+5
)
bits
=
512
24
= 21, 3333,
or bpp
=
L
IBV
CR
=
√
8 × 8
21, 33
= 0, 3750.
(27)
The number of classified energy and pattern blocks and the
required number of bits to represent each 8
× 8 block of the
images are shown in Ta ble 2.
The evaluation results of Fold 1, Fold 2, and Fold 3 are
presented in Tables 3, 4,and5,respectively.
The same experiments are repeated with the new resized
CEPB obtained after the clustering algorithm. At the end
of the clustering process the sizes of the CEB and CPB are
reduced and the number of classified energy and pattern
blocks is determined as 2
5
and 2
12
,respectively.Thus,an8
× 8 image blocks can be represented by 22 bits in total as
given in Table 2. The evaluation results of Fold 1, Fold 2, and
Fold 3 with clustering are presented in Tables 6, 7,and8,
respectively.
In the second group of experiments the total number
of bits required to represent the 16
× 16 blocks for each
original image file is (16
× 16) × 8bits = 2048 bits. In these
experiments the size of the CEPB is determined and fixed for
all folds (3 Folds) by adjusting the PCC. Thus, total numbers
of classified energy and pattern blocks are determined in the
range of 2
8
and 2
16
in the CEB and CPB sets, respectively.
N
IE
, N
IP
and BSC are represented by 8 bits, 16 bits, and 5 bits,
respectively. To represent the 16
× 16 blocks of the images,
29 bits are required in total. In this case, the compression
ratio w ill be computed as follows,
CR
=
bit
original
bit
reconstructed
=
(
16
× 16
)
× 8bits
(
8+16+5
)
bits
=
2048
29
= 70, 6207,
or bpp
=
L
IBV
CR
=
√
16 × 16
70, 6207
= 0, 2266.
(28)
The number of classified energy and pattern blocks and
the number of bits required to represent e ach 16
× 16 blocks
of the images are given in Ta ble 9 . The evaluation results of
the second group of experiments are presented in Table 10.
In order to reach lower bit rates we also established the
same experiments using an efficient clustering algorithm. At
the end of the clustering process the sizes of the CEB and CPB
are reduced and the number of classified energy and pattern
blocks is determined as 2
5
and 2
14
, respectively. In this case,
16
× 16 image blocks can be represented by 24 bits in total as
given in Ta ble 9 . The evaluation results of the second group
of experiments with clustering are presented in Table 11.
Overall evaluation performance of the method including
the average results of the first and second groups of
experiments is summarized in Table 12.
In order to show the performance of the proposed
method, some of the original and reconstructed versions of
the image are exhibited in Figures 11 and 12 for the first
group of experiments and the second group of experiments,
respectively. It is clearly understood from the figures and the
evaluation results given in the tables that, the performance
of the proposed method depends on the size of the CEPB
associated with the size of the L
IBV
. If the size of the CEPB
is highly reduced or the size of the L
IBV
is increased in
order to achieve higher compression ratios or lower bit rates,
the performance of the method is getting worse and the
blocking effect is also getting visible. Even in this case, it is
remarkable that the PSNR levels are not affected dramatically
and they do not drop below 27 dB at higher compression
ratios (0,1877 bpp or 85,33 : 1 compression ratio on the
average). It is also noted that there is almost no difference
in terms of PSNR level between the images compressed at
70,62 : 1 (27,23 dB) and 85,33 : 1 (26,87 dB). The blocking
effect in the reconstructed images at various compression
ratios and the results of the filtering process are illustrated
in Figures 13(A) and 13(B).
4. Conclusion and Future Works
In this paper, a new image compression algorithm based
on the classified energy and pattern block (CEPB) sets is
16 EURASIP Journal on Advances in Signal Processing
(a) (b) (c)
Figure 11: (a) Original, (b) reconstructed, and (c) filtered versions of the images (Lenna and F73) for the 1st group of experiments (Fold 1).
Lenna: PSNR
= 28,93 and 29,66 (filtered), F73: PSNR = 33,36 and 34,11 (filtered) (CR = 21,33).
(a) (b) (c)
Figure 12: (a) Original, (b) reconstructed, and (c) filtered versions of the images (Lenna and F73) for the 2nd group of experiments. Lenna:
PSNR
= 25,20 and 25,87 (filtered), F73: PSNR = 29,58 and 30,36 (filtered) (CR =70,62).
EURASIP Journal on Advances in Signal Processing 17
(a) (b) (c)
(A)
(a) (b) (c)
(B)
Figure 13: (A) Cropped (a) original, (b) reconstructed, and (c) filtered versions of the images (Lenna and F73) for the 1st group of
experiments (Fold 1). Lenna: PSNR
= 28,93 and 29,66 (filtered), F73: PSNR = 33,36 and 34,11 (filtered) (CR = 21,33). (B) Cropped (a)
original, (b) reconstructed, and (c) filtered versions of the images (Lenna and F73) for the 2nd group of experiments. Lenna: PSNR
= 25,20
and 25,87 (filtered), F73: PSNR
= 29,58 and 30,36 (filtered) (CR = 70,62).
proposed. In the method, first the CEB and CPB sets are
constructed and any image data can be reconstructed block
by block using a block scaling coefficient and the index
numbers of the classified energy and pattern blocks placed
in the CEB and CPB. The CEB and CPB sets are constructed
for different sizes of image blocks such as 8 by 8 or 16 by 16
with respect to different compression ratios desired.
At the end of a series of the experimental works, the
evaluation results show that the proposed method provides
high compression ratios such as 21,33 : 1, 85,33 : 1 while
preserving the image quality at 27–30.5 dB level on the
average. When the compression ratio versus image quality
(PSNR) results in the proposed method compared to the
other works [47], it seems that the method is superior to
the DCT and DWT particularly at low bit rates or high
compression ratios.
For the time being, the performance of the newly
proposed method is measured using PSNR and MSE metrics
and in the next paper on the comparative results of this work,
the other quality assessment metrics such as SSIM will also be
considered.
In our future works we will be focused on better designed
CEB and CPB in order to increase the level of the PSNR
while reducing the number of bits required representing
the image blocks. It was also concluded that the edge
artifacts at the boundaries of the reconstructed blocks affects
the quality of the reconstructed images. We currently are
working on removing or smoothing these artifacts using
some postprocessing and filtering algorithms. As a starting
point the 2D Savitzky-Golay smoothing filter is applied on
the reconstructed images and the PSNR levels are improved
0.5–1 dB compared to plain version of the method.
18 EURASIP Journal on Advances in Signal Processing
In terms of computational complexity, none of the
implementations we employ are optimized for execution
speed. Even the size of the CEPB is reduced and the speed
of the algorithms is increased with an efficient clustering
algorithm this attempt results in degraded image caused by
blocking effect in the reconstruction stage especially at low
bit rates. Our next work will also consider speeding up the
main procedure, in particular the encoding stage, with less
degradation.
It should be noted that we are also working on the
algorithms which select optimum block size length (variable)
instead of fixed in order to get higher compression ratio
in overall with less degradation caused by blocking effect.
In these algorithms, the block size is adaptively changed so
that it is increased in the plain or spatially redundant areas
while it is decreased in the other regions which contain
the detailed information. In order to obtain more precise
results, additional tests with different image sets containing
biomedical (ultrasound, cell), face, and fingerprint images
will be performed. Furthermore, application-specific CEPBs
will be constructed and the possible effects of these CEPBs on
the test images from the same and the different application
domains will be analyzed.
The improved version of the method wil l a lso contain the
Huffman encoding part which provides better performance
in terms of compression ratio. In our future works we are
not only planning to present the results of improved version
of the method but also planning to compare the results to
the other methods such as KLT, DCT, and wavelet-based
methods considering the other quality assessment metrics
which is more appropriate for HVS such as SSIM.
Acknowledgments
The work described in this paper was f unded by the Isik
University Scientific Research Fund (Project contract no.
10B301). The author would like to thank to Professor B.
S. Yarman (Istanbul University, College of Engineering,
Department of Electrical-Electronics Engineering), Assistant
Professor Hakan Gurkan (Isik University, Engineering Fac-
ulty, Department of Electrical-Electronics Engineering), the
researchers in the International Computer Science Institute
(ICSI), Speech Group, University of California at Berkeley,
CA, USA and the researchers in the SRI International, Speech
Technology and Research (STAR) Laboratory, Menlo Park,
CA, USA for many helpful discussions on this work during
his postdoctoral fellow years. The author also would like to
thank the anonymous reviewers for their valuable comments
and suggestions which substantially improved the quality of
this paper.
References
[1] R. C. Gonzales and R. E. Woods, Digital Image Processing,
Pearson Education, Essex, UK, 2nd edition, 2004.
[2] D. Salomon, Data Compression: The Complete Reference,
Springer, New York, NY, USA, 3rd edition, 2004.
[3] N. Jayant and P. Noll, Digital Coding of Waveforms: Princ iples
and Applications to Speech and Video, Prentice-Hall, Engle-
wood Cliffs, NJ, USA, 1984.
[4] N. Jayant, J. Johnston, and R. Safranek, “Signal compression
basedonmodelsofhumanperception,”Proceedings of the
IEEE, vol. 81, no. 10, pp. 1385–1422, 1993.
[5] B. Z. Cihlar, S. Grgic, and D. Modric, “Coding techniques
in multimedia communications,” in Proceedings of the 2nd
International Workshop on Image and Signal Processing (IWISP
’95), pp. 24–32, 1995.
[6] T. Jolliffe, Principal Component Analysis, Springer Series in
Statistics, Springer, New York, NY, USA, 1993.
[7]K.J.Anil,Fundamentals of Digital Image Processing, Prentice
Hall, New York, NY, USA, 1989.
[8] M. Kirby and L. Sirovich, “Application of the Karhunen-Loeve
procedure for the characterization of human faces,” IEEE
Transactions on Pattern Analysis and Machine Intelligence, vol.
12, no. 1, pp. 103–108, 1990.
[9] “Digital Compression and Coding of Continuous Tone Still
Images,” ISO/IEC IS 10918, 1991.
[10] G. K. Wallace, “The JPEG still picture compression standard,”
Communications of the ACM, vol. 34, no. 4, pp. 30–44, 1991.
[11] W. B. Pennebaker and J. L. Mitchell, JPEG Still Image Data
Compression Standard, Van Nostrand Reinhold, New York, NY,
USA, 1992.
[12] K. R. Rao and P. Yip, Discrete Cosine Transform: Algorithms,
Advantages, and Applications, Academic Press, San Diego,
Calif, USA, 1990.
[13] S. Bauer, B. Zovko-Cihlar, and M. Grgic, “The influence of
impairments from digital compression of video signal on per-
ceived picture quality,” in Proceedings of the 3rd International
Workshop on Image and Signal Processing (IWISP ’96), pp. 245–
248, 1996.
[14] Z. Xiong, K. Ramchandran, M. T. Orchard, and YA. Q. Zhang,
“A comparative study of DCT- and wavelet-based image
coding,” IEEE Transactions on Circuits and Systems for Video
Technology, vol. 9, no. 5, pp. 692–695, 1999.
[15] I. Daubechies, Ten Lectures on Wavelets, SIAM, Philadelphia,
Pa, USA, 1992.
[16] M. Vetterli and J. Kovacevic, Wavelets and Sub-Band Coding,
Prentice-Hall, Englewood Cliffs, NJ, USA, 1995.
[17] M. Antonini, M. Barlaud, P. Mathieu, and I. Daubechies,
“Image coding using wavelet transform,” IEEE Transactions of
Image Processing, vol. 1, no. 2, pp. 205–220, 1992.
[18] A. S. Lewis and G. Knowles, “Image compression using the 2-
Dwavelettransform,”IEEE Transactions of Image Processing,
vol. 1, no. 2, pp. 244–250, 1992.
[19] S. G. Mallat, “Theory for multiresolution signal decomposi-
tion: the wavelet representation,” IEEE Transactions on Pattern
Analysis and Machine Intelligence, vol. 11, no. 7, pp. 674–693,
1989.
[20] J. M. Shapiro, “Embedded image coding using zerotrees of
wavelet coefficients,” IEEE Transactions on Signal Processing,
vol. 41, no. 12, pp. 3445–3462, 1993.
[21] A. Said and W. A. Pearlman, “A new, fast, and efficient image
codec based on set partitioning in hierarchical trees,” IEEE
Transactions on Circuits and Systems for Video Technology, vol.
6, no. 3, pp. 243–250, 1996.
[22] Z. Xiong, K. Ramchandran, and M. T. Orchard, “Space-
frequency quantization for wavelet image coding,” IEEE Trans-
actions on Image Processing, vol. 6, no. 5, pp. 677–693, 1997.
[23] E. S. Hong and R. E. Ladner, “Group testing for image
compression,” IEEE Transactions on Image Processing, vol. 11,
no. 8, pp. 901–911, 2002.
[24] C. Christopoulos, “The jpeg2000 still image coding system:
an overview,” IEEE Transactions on Consumer Elect ronic s, vol.
46, no. 4, pp. 1103–1127, 2000.
EURASIP Journal on Advances in Signal Processing 19
[25] K. Pearson, “On lines and planes of closest fit to systems of
points in space,” Philosophical Magazine,vol.6,no.2,pp.
559–572, 1901.
[26] E. Oja, “Neural networks, principal components, and sub-
spaces,” International Journal on Neural Systems, vol. 1, pp.
61–68, 1989.
[27] W. W. Haher, Applied Numerical Linear Algebra, Prentice Hall,
New York, NY, USA, 1988.
[28] T. D. Sanger, “Optimal unsupervised learning in a single-layer
linear feedforward neural network,” Neural Networks, vol. 2,
no. 6, pp. 459–473, 1989.
[29] S. Y. Kung, K. I. Diamantaras, and J. S. Taur, “Adaptive
principal component extraction (APEX) and applications,”
IEEE Transactions on Signal Processing, vol. 42, no. 5, pp.
1202–1271, 1994.
[30] H. M. Abbas and M. M. Fahmy, “Neural model for
Karhumen-Loeve transform with application to adaptive
image compression,” IEEProceedings,PartI:Communications,
Speech and Vision, vol. 140, no. 2, pp. 135–143, 1993.
[31] S. Bannour and M. R. Azimi-Sadjadi, “Principal component
extraction using recursive least squares learning,” IEEE Trans-
actions on Neural Networks, vol. 6, no. 2, pp. 457–469, 1995.
[32] A. C. S. Leung, K. W. Wong, and AH. C. Tsoi, “Recursive algo-
rithms for principal component extraction,” Network: Compu-
tation in Neural Systems, vol. 8, no. 3, pp. 323–334, 1997.
[33] A. Cichocki, W. Kasprzak, and W. Skarbek, “Adaptive learning
algorithm for principal component analysis with partial data,”
in Proceedings of the 13th European Meeting on Cybernetics and
Systems Research, pp. 1014–1019, 1996.
[34] ZE. Wang, Y. Lee, S. Fiori, C. S. Leung, and YI. S. Zhu,
“An improved sequential method for principal component
analysis,” Pattern Recognition Letters, vol. 24, no. 9-10, pp.
1409–1415, 2003.
[35] S. Costa and S. Fiori, “Image compression using principal
component neural networks,” Image and Vision Computing,
vol. 19, no. 9-10, pp. 649–668, 2001.
[36] C. Lv, Z. Liu, and Q. Zhao, “A flexible non-linear PCA
encoder for still image compression,” in Proceedings of the 7th
IEEE International Conference on Computer and Information
Technology (CIT ’07), pp. 645–650, October 2007.
[37] K. M. Curtis, G. Neil, and V. Fotopoulos, “A hybrid fractal/
DCT image compression method,” in Proceedings of the
International Conference on Digital Signal Processing (DSP
’02), pp. 1337–1340, 2002.
[38] N. N. Ponomarenko, K. O. Egiazarian, V. V. Lukin, and J. T.
Astola, “High-quality DCT-based image compression using
partition schemes,” IEEE Signal Processing Letters, vol. 14, no.
2, pp. 105–108, 2007.
[39] S. D. Kulkarni, A. K. Naik, and N. S. Nagori, “A comparison of
real valued transforms for image compression,” International
Journal of Engineering and Applied Sciences, vol. 6, no. 5, pp.
285–289, 2010.
[40] J. Oliver and M. P. Malumbres, “A new fast lower-tree wavelet
image encoder,” in Proceedings of the IEEE International
Conference on Image Processing (ICIP ’01), vol. 3, pp. 780–783,
IEEE Signal Processing Society Press, 2001.
[41] H. Kondo and H. Kou, “Wavelet image compression using
sub-block DCT,” in Proceedings of the 9th IEEE International
Conference on Networks, pp. 337–330, 2001.
[42] J. Akhtar and M. Y. Javed, “Image compression with dif-
ferent types of wavelets,” in Proceedings of the 2nd Annual
International Conference on Emerging Techonologies (ICET
’06), pp. 133–137, November 2006.
[43] T. Tanaka, “Generalized subspace rules for on-line pca
and their application in signal and image compression,” in
Proceedings of the International Conference on Image Processing
(ICIP ’04), pp. 1895–1898, October 2004.
[44] C. Lv, Z. Liu, and Q. Zhao, “A flexible non-linear PCA
encoder for still image compression,” in
Proceedings of the 7th
IEEE International Conference on Computer and Information
Technology (CIT ’07), pp. 645–650, October 2007.
[45] J. E. Fowler, “Compressive-projection principal component
analysis,” IEEE Transactions on Image Processing, vol. 18, no.
10, pp. 2230–2242, 2009.
[46] V. Gaidhane, V. Singh, and M. Kumar, “Image compression
using PCA and improved technique with MLP neural
network,” in Proceedings of the IEEE International Conference
on Advances in Recent Technologies in Communication and
Computing (ARTCom ’10), pp. 106–110, 2010.
[47] S. Grgic, M. Grgic, and B. Zovko-Cihlar, “Performance anal-
ysis of image compression using wavelets,” IEEE Transactions
on Industrial Electronics, vol. 48, no. 3, pp. 682–695, 2001.
[48] Z. Xiong, K. Ramchandran, M. T. Orchard, and YA. Q. Zhang,
“A comparative study of DCT- and wavelet-based image
coding,” IEEE Transactions on Circuits and Systems for Video
Technology, vol. 9, no. 5, pp. 692–695, 1999.
[49] D. Zhang and S. Chen, “Fast image compression using
matrix K-L transform,” Neurocomputing,vol.68,no.1–4,pp.
258–266, 2005.
[50] B. S. Yarman, U. Guz, and H. Gurkan, “On the comparative
results of ”SYMPES: a new method of speech modeling”,”
International Journal of Electronics and Communications, vol.
60, no. 6, pp. 421–427, 2006.
[51]
¨
U. G
¨
uz,H.G
¨
urkan, and B. S. Yarman, “A new method to
represent speech signals via predefined signature and envelope
sequences,” EURASIP Journal on Advances in Signal Processing,
vol. 2007, Article ID 56382, pp. 1–17, 2007.
[52] H. Gurkan, U. Guz, and B. S. Yarman, “Modelling of electro-
cardiogram signals using predefined signature and envelope
vector sets. Special Issue on Advances in Electrocardiogram
Signal Processing and Analysis,” EURASIP Journal on Applied
Signal Processing, vol. 2007, Article ID 12071, pp. 1–12, 2007.
[53] H. G
¨
urkan, U. Guz, and B. S. Yarman, “EEG signal
compression based on classified signature and envelope
vector sets. Special Issue on Bridging Technology Innovations
to Foundations,” International Journal of Circuit Theory and
Applications, vol. 37, no. 2, pp. 351–363, 2009.
[54] U. Guz, H. Gurkan, and B. S. Yarman, “A novel image
compression method based on classified energy and pattern
blocks: initial results,” in Proceedings of the 25th International
Symposium on Computer and Information Sciences, 2010.
[55] A. N. Akansu and R. A. Haddad, Multiresolution Signal
Decomposition, Academic Press, San Diego, Calif, USA, 1992.
[56] J. G. Proakis and D. K. Manolakis, DigitalSignalProcessing,
Prentice Hall, New Yor k, NY, USA, 4th edition, 2006.
[57] A.M.Neto,L.Rittner,N.Leite,D.E.Zampieri,R.Lotufo,and
A. Mendeleck, “Pearson’s correlation coefficient for discarding
redundant information in real time autonomous navigation
system,” in Proceedings of the 16th IEEE International
Conference on Control Applications (CCA ’07), pp. 426–431,
October 2007.
[58] C. Chinrungrueng and A. Suvichakorn, “Fast edge-preserving
noise reduction ultrasound images,” IEEE Transactions on
Nuclear Science, vol. 48, no. 3, pp. 849–854, 2001.
[59] Image database, “USC Viterbi School of Engineering,
Electrical Engineering Department, Signal and Image
20 EURASIP Journal on Advances in Signal Processing
Processing Institute (SIPI),” />base.cgi?volume
=misc.
[60] Z. Wang, A. C. Bovik, H. R. Sheikh, and E. P. Simoncelli,
“Image quality assessment: from error visibility to structural
similarity,” IEEE Transactions on Image Processing, vol. 13, no.
4, pp. 600–612, 2004.
[61] Z. Wang, A. C. Bovik, and L. Lu, “Why is image quality assess-
ment so difficult?” in Proceedings of the IEEE International
Conference on Acoustic, Speech, and Signal Processing (ICASSP
’02), vol. 4, pp. IV/3313–IV/3316, May 2002.